. 2025 Nov;30(11):5121-5136.
doi: 10.1038/s41380-025-03095-w. Epub 2025 Jun 28.

Integrated multi-omics analyses of synaptosomes revealed synapse-associated novel targets in Alzheimer's disease

Affiliations

Integrated multi-omics analyses of synaptosomes revealed synapse-associated novel targets in Alzheimer's disease

Subodh Kumar et al. Mol Psychiatry. 2025 Nov.

Abstract

Synapse dysfunction is an early event in Alzheimer's disease (AD) caused by various factors, including amyloid beta, p-tau, inflammation, and aging. However, the precise molecular mechanism underlying synapse dysfunction in AD remains largely unknown. To understand this, we comprehensively analyzed the synaptosomes fraction in post-mortem brain samples from AD patients and cognitively normal individuals. We conducted high-throughput transcriptomic analyses to identify changes in microRNA (miRNA) and mRNA levels in synaptosomes extracted from the brains of unaffected individuals and those with AD. Additionally, we performed mass spectrometry analysis of synaptosomal proteins in the same sample group. These analyses revealed significant differences in the levels of miRNAs, mRNAs, and proteins between the two groups. To gain further insights into the pathways or molecules involved, we employed an integrated omics approach to study the molecular interactions of deregulated synapse miRNAs, mRNAs, and proteins in samples from individuals with AD and the control group, demonstrating the impact of deregulated miRNAs on their target mRNAs and proteins. Furthermore, the DIABLO analysis revealed complex relationships among mRNAs, miRNAs, and proteins that could be key in understanding the pathophysiology of AD. Our study identified novel synapse-associated candidates that could be critical in restoring synapse dysfunction in AD.


Conflict of interest statement

Competing interests: The authors declare no competing interests. Ethics approval and consent to participate: For AD and control human brain tissues, written informed consent for post-mortem brain donation was obtained from the families of donors through the NIH NeuroBioBank. Prior to their transfer to the TTUHSC El Paso, all samples were de-identified, thereby exempting them from the oversight of the Institutional Review Board (IRB).

Figures
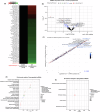
Fig. 1
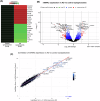
Fig. 1. MiRNA-Seq analysis in AD vs control synapse.
A Heatmap displaying differentially regulated miRNAs: the top upregulated and downregulated miRNAs in AD (n = 27) synaptosomes compared to control (n = 14) synaptosomes. B A volcano plot showing the top deregulated miRNAs’ (log10 p-value). MiRNAs with an FDR < 0.05 were considered statistically significant. C Correlation analysis of the top differentially regulated miRNAs in AD vs control synaptosomes with a significant R-value. D Gene set enrichment analysis of top downregulated miRNAs shows affected biological pathways in human diseases, along with their p-values and number of genes. E Gene set enrichment analysis of top-upregulated miRNAs shows depleted and enriched biological pathways in human diseases, along with their p-values and numbers of genes.
Fig. 2
Fig. 2. mRNA-Seq analysis in AD vs control synapse.
A Heatmap showing the top differentially regulated genes in AD (n = 27) vs control (n = 14) synaptosomes. B Volcano plot depicting the top differentially regulated genes in AD vs control synaptosomes. Genes with an FDR < 0.05 were considered statistically significant. C Correlation analysis of top genes in AD vs control synaptosomes with significant R-value.
Fig. 3
Fig. 3. Mass-spec analyses of differentially regulated proteins in AD vs control synapse.
A The heatmap of the top-up and downregulated proteins in AD (n = 5) vs control (n = 5) synaptosomes includes two technical duplicates. B Volcano plot depicting the top differentially regulated proteins in AD vs control synaptosomes. Proteins with an FDR < 0.05 were considered statistically significant. C Correlation analysis of the expression of the top differentially regulated proteins in AD vs control synaptosomes shows a significant R value. D KEGG pathway analysis of the top upregulated proteins shows significant fold enrichment and protein counts in human diseases and biological pathways. E KEGG pathway analysis of top downregulated proteins shows significant fold enrichment and protein count in human diseases and biological pathways.
Fig. 4
Fig. 4. Immunoblotting analysis of top deregulated proteins in AD post-mortem brain samples.
A Western blots for GPI, UQCRC1, TIMM50, and VAT1L proteins in post-mortem brains from control and AD brains at Braak stages I/II, III/IV, and V/VI. B Densitometry analysis of GPI, UQCRC1, TIMM50, and VAT1L protein blots in control and AD post-mortem brains with different Braak stages. Data are presented as mean ± SEM (n = 4) **P < 0.01, ***P < 0.001 using two-way ANOVA. C Western blots for GPI, UQCRC1, TIMM50, and VAT1L proteins in post-mortem brains from control and AD brains at Braak stage VI. Densitometry analysis of (D) GPI, (E) UQCRC1, (F) TIMM50, and (G) VAT1L protein blots in control and AD post-mortem brains with Braak stage VI. Data are presented as mean ± SEM (n = 4) *P < 0.05, **P < 0.01 using student’s t test.
Fig. 5
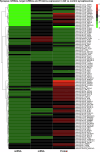
Fig. 5. Multi-omics integration analysis of synapse miRNA-mRNA-proteins in AD.
Heat map showing the expression levels of miRNAs, their target mRNA, and proteins in AD synaptosomes.
Fig. 6
Fig. 6
Gene integration analysis of top deregulated miRNAs and their interaction with target proteins in AD synapse.
Fig. 7
Fig. 7. DIABLO analysis of synapse miRNA-mRNA and proteins in AD.
A Circos plot showing the positive and negative correlations between different molecular data types: mRNA, miRNA, and proteins in AD and control post-mortem brains. B The clustered heatmap shows the expression levels of various molecular features, including mRNAs, miRNAs, and proteins, across samples of AD and control post-mortem brains.

Update of

References

    1. Alzheimer’s disease facts and figures. Alzheimers Dement. 2023;19:1598-695. 10.1002/alz.13016. - PubMed
    1. Armstrong RA. Risk factors for Alzheimer’s disease. Folia Neuropathol. 2019;57:87–105. 10.5114/fn.2019.85929. - PubMed
    1. Khan S, Barve KH, Kumar MS. Recent advancements in pathogenesis, diagnostics and treatment of Alzheimer’s Disease. Curr Neuropharmacol. 2020;18:1106–25. 10.2174/1570159X18666200528142429. - PMC - PubMed
    1. Jackson J, Jambrina E, Li J, Marston H, Menzies F, Phillips K, et al. Targeting the synapse in Alzheimer’s disease. Front Neurosci. 2019;13:735 10.3389/fnins.2019.00735. - PMC - PubMed
    1. Kumar S, Orlov E, Gowda P, Bose C, Swerdlow RH, Lahiri DK, et al. Synaptosome microRNAs regulate synapse functions in Alzheimer’s disease. NPJ Genom Med. 2022;7:47 10.1038/s41525-022-00319-8. - PMC - PubMed

MeSH terms

LinkOut - more resources