. 2025 Jun 28;22(1):169.
doi: 10.1186/s12974-025-03496-2.

CXCR4 and CXCR6 dually limit T cell entry into the polyomavirus-infected brain

Affiliations

CXCR4 and CXCR6 dually limit T cell entry into the polyomavirus-infected brain

Kalynn M Alexander et al. J Neuroinflammation. .

Abstract

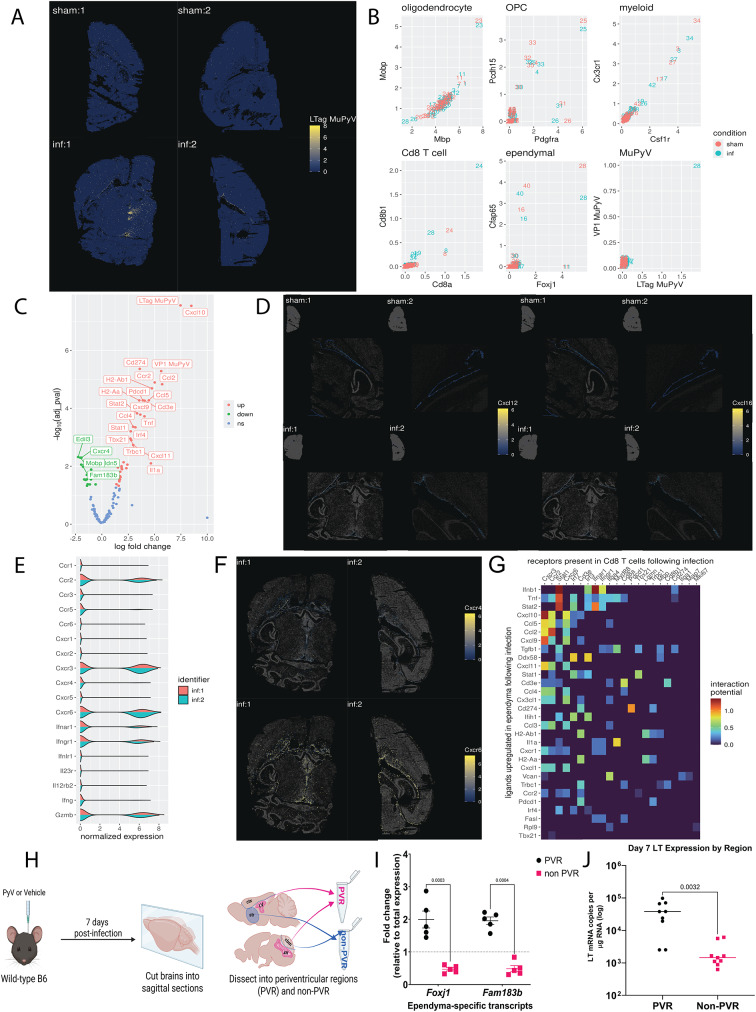
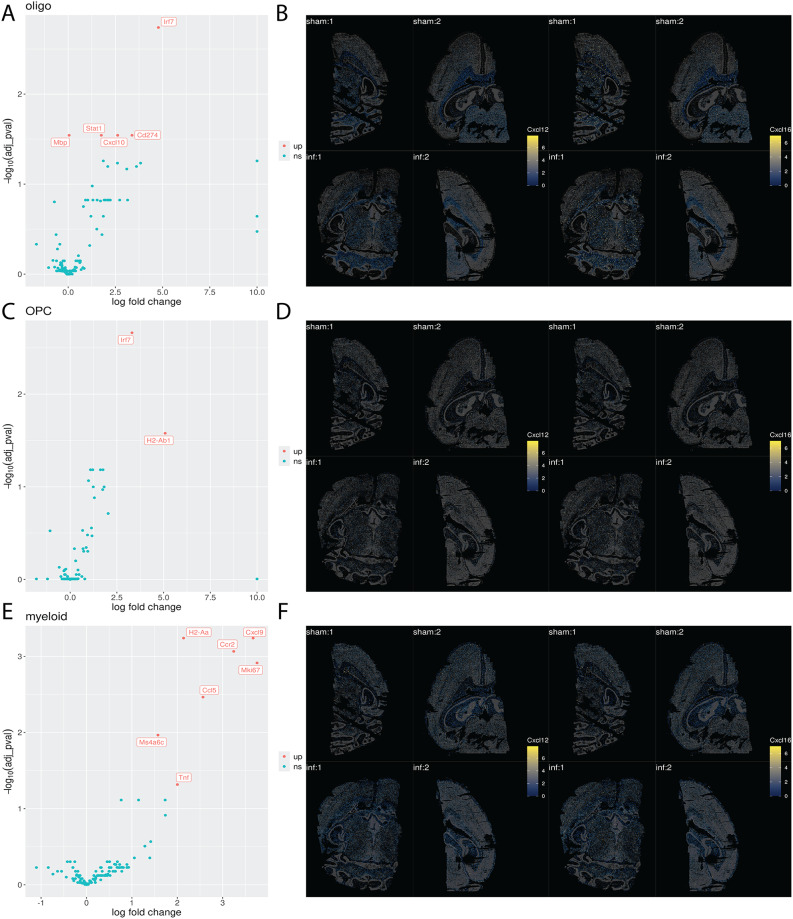
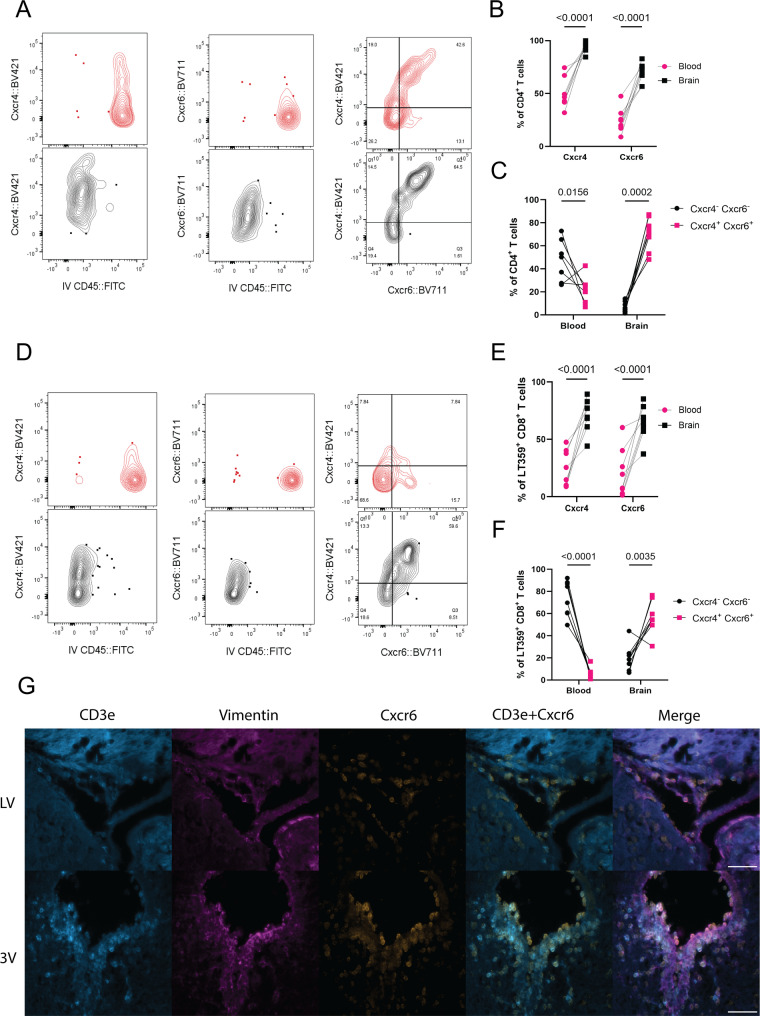
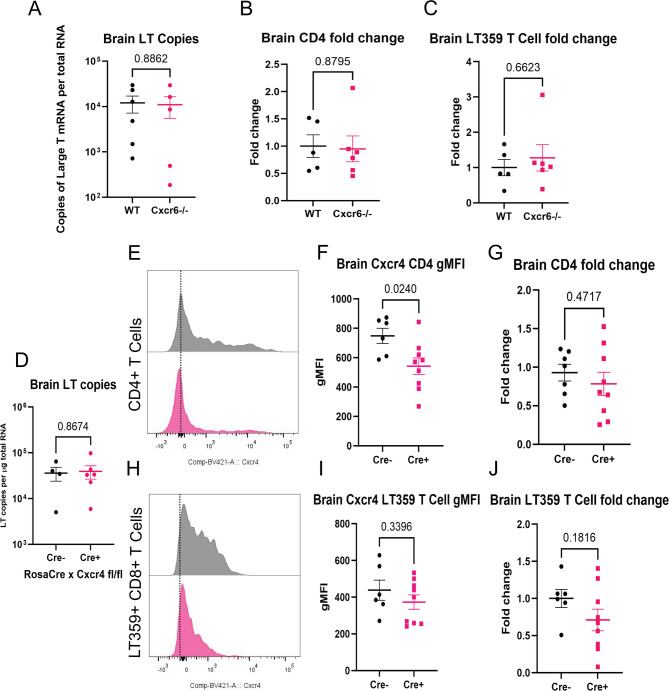
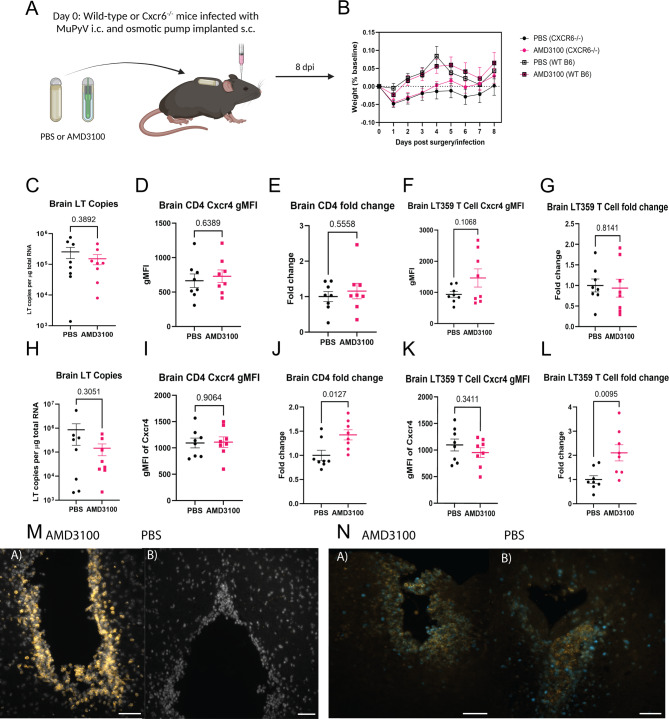
T cell responses are vital for controlling viral infection in the central nervous system (CNS), but must be tightly regulated to limit tissue-damaging inflammation. Using mouse polyomavirus (MuPyV) CNS infection, an in vivo model for JCPyV-induced Progressive Multifocal Leukoencephalopathy (PML), we investigated sites of early infection, immune responses, and recruitment of T cells to the brain. Multiplexed error-robust fluorescence in situ hybridization (MERFISH) single-cell spatial transcriptomics was applied to assess the regionality of virus infection and brain-resident cell and infiltrating leukocyte responses. MERFISH, immunofluorescence microscopy, quantitative PCR, and flow cytometry demonstrate that the ependyma is the predominant region of MuPyV CNS infection and localization of T cells, and implicated CXCR4 and CXCR6 in T cell migration to the ependyma and subventricular zone. Using CXCR6 knockout mice and a specific CXCR4 small molecule antagonist, we found that the combined impairment of CXCR6 and CXCR4 signaling resulted in elevated infiltration of T cells in the MuPyV-infected brain. This work demonstrates that CXCR4 and CXCR6 act in a nonredundant fashion to restrict T cell accumulation to the polyomavirus-infected ependyma, with important implications for ongoing efforts to use JCPyV-specific T cell adoptive immunotherapy for PML.

Supplementary Information: The online version contains supplementary material available at 10.1186/s12974-025-03496-2.

Keywords: CXCR4; CXCR6; Ependyma; MuPyV; T cells.


Conflict of interest statement

Declarations. Ethics approval and consent to participate: Not applicable. Consent for publication: Not applicable. Competing interests: The authors declare no competing interests.

Figures

Fig. 1
Fig. 1
Spatial transcriptomics reveals virus-induced changes in gene expression in the ependyma as well as the primary location of infection in situ. In two independent experiments, wild-type (WT) mice were injected i.c. with vehicle (sham) or MuPyV (infected), and brains collected at 8 dpi. A: Expression of LTag transcripts in each spot in sham and infected samples. Spots are placed according to their x and y coordinates, ignoring their z coordinate (i.e., flattening). Spots are colored according to log-normalized LTag transcript expression. B: Expression of cell markers in specific clusters. Different clusters are placed according to their average log-normalized expression of different genes on the x and y axes. Values were computed separately for the sham and infected conditions, as represented by color. C: Volcano plot displaying DEG analysis for the ependyma. Each gene is represented by a labeled point, organized along the x-axis according to computed log-fold change and by the negative log of the adjusted p value on the y-axis. Points are colored according to the nature of the dysregulation (up, down, or not significant). D: Expression of Cxcl12 and Cxcl16 transcripts in the ependyma in sham and infected samples. Spots are placed according to their x and y coordinates, ignoring their z coordinate (i.e., flattening). Ependymal spots are colored according to log-normalized Cxcl12 and Cxcl16 transcript expression, with non-ependymal spots greyed out and made semi-transparent. A small overview of the entire section is visible on the top left to better place the location of the ependyma within the tissue. E: Density plots of various T cell markers in CD8+ T cells in the infected condition. The x-axis represents the level of log-normalized marker expression, y-axis represents the of the plot represents the amount of spots in the dataset with that level of marker expression, and the color represents each individual sample. F: Expression of Cxcr4 and Cxcr6 transcripts in Cd8 T cells in infected samples. Spots are placed according to their x and y coordinates, ignoring their z coordinate (i.e., flattening). CD8 T cell spots are colored according to log-normalized Cxcr4 and Cxcr6 transcript expression, with non-CD8 T cell spots greyed out and made semi-transparent. G: Interaction potential heatmap between ependymal ligands and T cell receptors. The x-axis plots receptors that were present in over 10% of CD8+ T cell spots in the infected condition, the y-axis represents ligands that were found to be significantly upregulated following infection in ependymal cells, and tiles are colored according to interaction potential as established by Browaeys et al. [31] H, I. The periventricular region of the brain was dissected out and its ependymal gene expression (Foxj1 and Fam183b) confirmed. Diagram made using BioRender.com. The p-values shown are matched 2-way ANOVA with post-hoc. J: Virus levels are higher in this area compared to the rest of the brain at 7 dpi. Data analyzed by a two-tailed Student’s t test
Fig. 2
Fig. 2
Spatial transcriptomics of oligodendrocytes, OPCs, and myeloid cells. A. Volcano plot displaying DEG analysis for oligodendrocytes. Each gene is represented by a labeled point, organized along the x-axis according to computed log-fold change and by the negative log of the adjusted p value on the y-axis. Points are colored according to the nature of the dysregulation (up, down, or not significant). B. Expression of Cxcl12 and Cxcl16 transcripts in oligodendrocytes in sham and infected samples. Spots are placed according to their x and y coordinates, ignoring their z coordinate (i.e., flattening). Oligodendrocyte spots are colored according to log-normalized Cxcl12 and Cxcl16 transcript expression, with non-oligodendrocyte spots greyed out and made semi-transparent. C. Volcano plot displaying DEG analysis for OPCs. Each gene is represented by a labeled point, organized along the x-axis according to computed log-fold change and by the negative log of the adjusted p value on the y-axis. Points are colored according to the nature of the dysregulation (up, down, or not significant). D. Expression of Cxcl12 and Cxcl16 transcripts in OPCs in sham and infected samples. Spots are placed according to their x and y coordinates, ignoring their z coordinate (i.e., flattening). OPC spots are colored according to log-normalized Cxcl12 and Cxcl16 transcript expression, with non-OPC spots greyed out and made semi-transparent. E. Volcano plot displaying DEG analysis for myeloid cells. Each gene is represented by a labeled point, organized along the x-axis according to computed log-fold change and by the negative log of the adjusted p value on the y-axis. Points are colored according to the nature of the dysregulation (up, down, or not significant). F. Expression of Cxcl12 and Cxcl16 transcripts in myeloid cells in sham and infected samples. Spots are placed according to their x and y coordinates, ignoring their z coordinate (i.e., flattening). Myeloid spots are colored according to log-normalized Cxcl12 and Cxcl16 transcript expression, with non-myeloid spots greyed out and made semi-transparent
Fig. 3
Fig. 3
Expression of CXCR4 and CXCR6 on T cells after MuPyV infection is brain-specific. WT mice were inoculated i.c. with MuPyV and IV labeled with CD45::FITC prior to euthanasia. Flow cytometry of the indicated C-C and C-X-C receptors on brain CD4+ and Db LT359 tetramer+ CD8a+ T cells. A. Representative contour plots showing brain CD4+ T cells have increased CXCR4 and CXCR6 staining compared to IV CD45+ cells in the blood. More brain than blood cells were CXCR4+ CXCR6+. B-C. Quantification of the percent positive cells in A. D. As with CD4+ T cells, brain Db LT359 tetramer+ CD8+ T cells have increased CXCR4 and CXCR6 staining, as well as CXCR4+ CXCR6+ cells. E-F. Quantification of the percent positive cells in D. G. Representative images of 8 dpi WT mouse brains at the third ventricle (3 V) and lateral ventricle (LV) stained for CD3e, vimentin, and CXCR6. Both CXCR6+ and CXCR6+ CD3e+ cells are visible at the ventricles. Flow cytometry of n = 8 mice for two independent experiments. Scale bar 50 μm. Percent positive values were determined using the fluorescence minus one (FMO) values for each chemokine. The p-values shown are matched 2-way ANOVA with post-hoc
Fig. 4
Fig. 4
Loss of CXCR6 or CXCR4 signaling alone has no effect on recruitment of T cells to the brain. A-D. WT or CXCR6−/− mice were inoculated i.c. with MuPyV and euthanized at 8 dpi. Tissues were used for flow cytometric analysis of T cell numbers and expression of CXCR4, as well as qPCR to determine virus levels. n = 6 (WT) or 7 (CXCR6−/−) mice per group, 2 independent experiments. (A) LT mRNA copies by qPCR of WT or CXCR6−/− mice. Number of CD4+ T cells (B) or Db LT359 tetramer+ CD8+ T cells (C) in the brains of WT and CXCR6−/− mice calculated as fold change relative to the mean of the WT controls per experiment. D-J. Rosa-CreERT x Cxcr4fl/fl (Cre+ and Cre) mice were treated with tamoxifen for 5 d, then inoculated with MuPyV i.c. and euthanized at 8 dpi. Tissues were used for flow cytometry and qPCR. D. LT mRNA copies of Cre and Cre+ Rosa-CreERT x Cxcr4fl/fl brains. E, H. Representative histograms of Cre- and Cre + expression of CXCR4 on CD4+ T cells (E) or Db LT359 tetramer+ CD8+ T cells (H). F, I. gMFI of CXCR4 expression by CD4+ T cells (F) or CD8+ T cells (I). G, J. Fold change of the number of CD4+ T cells (G) or Db LT359 tetramer+ CD8+ T cells (J) were calculated relative to the Cre controls, n = 6 (Cre-) or 10 (Cre+) mice per group. Data analyzed by two-tailed Student’s t test
Fig. 5
Fig. 5
Inhibition of CXCR4 combined with loss of CXCR6 increases brain T cell recruitment. (A) Experimental paradigm. WT or CXCR6−/− mice were inoculated i.c. with MuPyV and simultaneously implanted with osmotic pumps filled with either PBS or AMD3100 Mice were weighed daily, then euthanized at 8 dpi, and tissues were collected for flow cytometry and qPCR. Diagram made using BioRender.com. (B) Weights of the mice as percent of baseline during the experiments. C, H. LT copies by RT qPCR in WT (C) and Cxcr6-/- (H) mice treated with PBS or AMD3100. D, I. gMFI of Cxcr4 in CD4 + T cells in WT (D) or Cxcr6-null (I) mice with drug treatment. E, J. Fold change of CD4 + T cells relative to PBS controls in WT (E) and CXCR6-/- (J) mice. F, K. gMFI of CXCR4 in Db LT359 tetramer+ CD8+ T cells in WT (F) or CXCR6-/- (K) mice. G, L. Fold change of virus-specific CD8+ T cells relative to PBS controls in WT (G) and CXCR6−/− (L) mice. M. Increased CD8+ T cells (orange) at the ependyma in CXCR6−/− mice with AMD3100 treatment (a) compared to PBS controls (b). N. In CXCR6−/− mice, CD8+ T cells (orange) show Ki67 (blue) positivity after both AMD3100 treatment (a) and PBS treatment (b). n = 3 mice per group, two independent experiments. Scale bar 50 μm. Data analyzed by two-tailed Student’s t test

Similar articles

References

    1. Smolders J, Heutinck KM, Fransen NL, Remmerswaal EBM, Hombrink P, Ten Berge IJM, et al. Tissue-resident memory T cells populate the human brain. Nat Commun. 2018;9(1):4593. - PMC - PubMed
    1. Urban SL, Jensen IJ, Shan Q, Pewe LL, Xue HH, Badovinac VP, et al. Peripherally induced brain tissue-resident memory CD8. Nat Immunol. 2020;21(8):938–49. - PMC - PubMed
    1. Mix MR, van de Wall S, Heidarian M, Escue EA, Fain CE, Pewe LL, et al. Repetitive antigen stimulation in the periphery dictates the composition and recall responses of brain-resident memory CD8. Cell Rep. 2025;44(2):115247. - PMC - PubMed
    1. Mockus TE, Ren HM, Lukacher AE. Shwetank. To go or stay: the development, benefit, and detriment of Tissue-Resident memory CD8 T cells during central nervous system viral infections. Viruses. 2019;11(9). - PMC - PubMed
    1. Lauver MD, Jin G, Ayers KN, Carey SN, Specht CS, Abendroth CS et al. T cell deficiency precipitates antibody evasion and emergence of neurovirulent polyomavirus. Elife. 2022;11. - PMC - PubMed

LinkOut - more resources