. 2025 Sep;12(35):e00325.
doi: 10.1002/advs.202500325. Epub 2025 Jun 29.

Calcitonin Gene-Related Peptide (CGRP)-Expressing Neurons in the External Lateral Parabrachial Area Regulate Pain-Induced Sleep Disturbances

Affiliations

Calcitonin Gene-Related Peptide (CGRP)-Expressing Neurons in the External Lateral Parabrachial Area Regulate Pain-Induced Sleep Disturbances

Nicole Lynch et al. Adv Sci (Weinh). 2025 Sep.

Abstract

Given that sleep and pain are bidirectionally related, we investigated the neural circuits underlying pain-induced sleep disturbances using two acute pain models. Activation of nociceptors in acute inflammatory pain (AIP) significantly reduced sleep by 45-50% in the first 6 h, with reduced sleep spindle density for 1-3 h post-AIP. Additionally, an "optogenetic pain (Opto-Pain)" model is implemented to produce acute peripheral pain-induced awakenings that reduced sleep comparable to AIP. Both pain models are used to test the role of wake-promoting neurons in the parabrachial nucleus that express Calcitonin Gene-Related Peptide (PBelCGRP) in relaying nociceptive stimulus from the dorsal horn as part of the spine-ponto-amygdaloid tract. Blocking PBelCGRP neurons with genetic ablation or optogenetic inhibition attenuated sleep loss. To dissect the PBelCGRP pathways, the terminals are then optogenetically silenced post-AIP and found the reversal of sleep disturbances in the following descending order of effectiveness: substantia innominata of the basal forebrain (SI-BF) > central nucleus of the amygdala (CeA) > bed nucleus of the stria terminalis (BNST) > the lateral hypothalamus (LH). In SI-BF and CeA, a similar reversal of AIP-induced sleep loss occurred with pharmacological blocking of either CGRP or NMDA receptors. The results are relevant to emerging pain therapies aiming to attenuate sleep disturbances.

Keywords: acute pain; neural‐circuits; optogenetics; parabrachial nucleus; sleep‐loss.


Conflict of interest statement

The authors declare no conflict of interest.

Figures

Figure 1
Figure 1
Genetic ablation of PBelCGRP neurons and the resulting recovery of sleep‐loss induced by the Acute Inflammatory Pain (AIP) model: a,b) Representations depicting that CGRP‐creER and WT mice received bilateral PBel injections of the AAV‐Flex‐DTA viral vector to selectively ablate cre‐expressing CGRP neurons. c) DTA expression causes nearly complete deletion of all PBelCGRP neurons (green) in CGRP‐creER mice (bottom panel), while WT mice, which lack cre recombinase, show intact CGRP neurons (top panel). Expression of non‐cre‐dependent mCherry (red) in both CGRP‐creER and WT mice confirms AAV‐Flex‐DTA expression throughout the PBel. d) Representative images showing EEG delta power, integral EMG, and hypnograms of NonREM sleep (green), REM sleep (red), and Wake (black) from both Saline/Control (top panel) and AIP/Formalin (bottom panel) conditions are shown for 24 h post‐injection. AIP‐induced sleep loss (bottom panel) shows almost no sleep in the first hour and sleep fragmentation in the first 3 h, compared to the control above. e) The experimental protocol and timeline for the genetic ablation and AIP study are shown here. f) Average (mean ± SEM) percentage of time spent in wake and sleep, including Non‐REM (NREM) and REM, in the following treatment groups are shown across 24 h post‐injection: deletion of PBelCGRP neurons following saline (PBelCGRP‐S) or AIP (PBelCGRP‐AIP), and intact PBelCGRP neurons following saline (WT‐S) or AIP (WT‐AIP). Sample size = 5 and 6, for WT and PBelCGRP‐DTA AIP groups, respectively, while for the S group, n = 4. Exact p values for each significance symbol are described in the results section. g) The averages (± SEM) of wake and sleep percentages across the groups in 3 h bins post‐injection during the light phase are shown here in bar graphs. Sample size = 5 and 6, for WT and PBelCGRP‐DTA AIP groups, respectively, while for the S group, n = 4. Exact p values for each significance symbol are described in the results section. h) The average sleep bout duration per hour (mean ± SEM) and average number of sleep bouts (mean ± SEM) in the first nine hours post‐injection during the light phase are shown here (data points representing each mouse are included). i) A comparison of the normalized EEG power (mean ± SEM) during NREM across different frequency bins (SWS 0.5–1.5 Hz, Delta 0.5–4 Hz, Theta 5–8 Hz, Sigma 9–15 Hz, Beta 16–29 Hz and Gamma 30–60 Hz) for the groups is represented by a line graph. j) A bar graph compares the SWS and Delta NREM EEG power percentages (mean ± SEM) in the groups (data points representing each mouse are included). Groups were compared using a one‐way (treatment) or two‐way (treatment X time) ANOVA, followed by the Holm‐Sidak method for multiple comparisons, where **p < 0.001; *p < 0.01. The colors of the asterisks in (f,g) represent the group with which WT‐AIP is being compared, while in (h,j), *‐represents a comparison to PBelCGRP‐DTA‐ AIP, and #‐ represents a comparison to WT‐S. Exact p values for each significance symbol are described in the results section. Scale in (c)‐ 100 µm. Abbreviations: PB‐ parabrachial subnucleus; PBcl‐ central lateral PB subnucleus; PBel‐ external lateral PB subnucleus; scp‐ superior cerebellar peduncle.
Figure 2
Figure 2
Optogenetic inhibition of PBelCGRP‐JAWS neurons in the Opto‐Pain model and corresponding in vitro validation: a,b) Representations depicting that CGRP‐ChR2 mice, which express ChR2 in all the CGRP neurons and terminals (see validation in Figure S2, Supporting Information), were injected bilaterally in the PBel with AAV‐Flex‐JAWS‐EGFP (JAWS‐EGFP) and implanted with EEG/EMG sensors, bilateral optical fibers in the PBel, and a µLED wireless device in the foot pad for stimulation of the CGRP‐nociceptors for the acute opto‐pain paradigm. Details of the optogenetic inhibition of JAWS‐EGFP expressing PBelCGRP (PBelCGRP‐JAWS) neurons and the peripheral CGRP nociceptor stimulation in the Opto‐Pain model are also included (b). c) In vitro validation of JAWS expressing PBelCGRP neurons (c): (i) Examples of recorded brain slices showing JAWS‐EGFP expression in the PBel (green; scale bar: 500 µm) and post hoc labeling of recorded PBel neurons filled with biocytin from the recording pipette and then labeled with streptavidin‐AF‐555 conjugate (orange‐red, insert; scale bar: 50 µm). (ii) Image showing the same biocytin‐labeled PBel neurons at higher magnification (white arrows: two recorded PBelCGRP‐JAWS ‐neurons that express JAWS‐EGFP; purple arrow: a recorded PBel neuron that does not express JAWS‐EGFP; scale bar: 50 µm). (iii) Light exposure (635 nm wavelength; 20 s duration) hyperpolarized and silenced action potential firing of PBelCGRP‐JAWS neurons (n = 6). (v) Bar histogram graphs representing the mean membrane potential before (pre), during (light‐on), and after (post) light stimulation. One‐way ANOVA, F= 32.46; p <  0.001, n = 6; Bonferroni's multiple comparisons post‐hoc test; ***p = 0.001 pre vs light‐on; ***p = 0.001, light‐on vs post. (iv) PBel neurons that do not express JAWS (n = 4) do not respond to light. vi) Bar histogram graph representing no changes in the mean membrane potential (MP) before (pre), during (light‐on), and after (post) light stimulation. One‐way ANOVA, F= 0.21; p = 0.8149, n = 4; Bonferroni's multiple comparisons post‐hoc test; ns p > 0.999 pre vs light‐on; ns p > 0.999, light‐on vs post. d) Photomicrographs showing selective expression of JAWS‐EGFP (enhanced green fluorescent protein) in PBelCGRP neurons (purple). (i) White optical fiber tracts (white dashes). These JAWS expressing CGRP cells in the PBel (PBelCGRP‐JAWS ) were targeted by the implanted optical fibers (fiber tracks in (i)) to photo‐inhibit by the laser light of 635 nm (red laser), and the red shaded triangles mark the area (5002 µm) maximally affected by the transmitted light that includes the PBelCGRP‐JAWS expressing neurons. e) The latency to cortical arousal in each trial (represented by a dot/ triangle) following peripheral CGRP nociceptors (Opto‐Pain) in CGRP‐ChR2 mice (blue; n = 7) was compared with mice where PBelCGRP‐JAWS neurons were photo‐inhibited by red laser light (magenta; n = 7), and with those that had no ChR2 expression in CGRP neurons and terminals (no‐ChR2 control; grey; n = 4). f) Mean (±SEM) arousal latency (in sec) for the groups shown in (e) are represented as a bar graph (data points representing each mouse are included). g) The average percent of time in wake and NREM over 24 h following the opto‐pain protocol is shown on an hourly basis for the groups in e and f. Additionally, the graphs also include two controls, CGRP‐ChR2 mice with PBelCGRP‐JAWS neurons but no Opto‐Pain (red; n = 3), and CGRP‐ChR2 mice in a baseline condition (n = 4). Groups were compared using a one‐way (f) or two‐way (g) ANOVA, followed by the Holm‐Sidak method for multiple comparisons, where **, ###p < 0.001; *p < 0.01. The color of the asterisk in (g) represents the group being compared to CGRP‐ChR2 + Opto‐Pain, while in (f) *‐represents the comparison to PBelCGRP‐JAWS+ Opto‐Pain, and #‐ represents the comparison to no‐ChR2 + Opto‐Pain. Exact p values for each comparison are mentioned in detail in the results section. Scale in (d) (i‐iv) 100 µm, and 15 µm in magnified panel. Abbreviations: PB‐ parabrachial subnucleus; PBcl‐ central lateral PB subnucleus; PBel‐ external lateral PB subnucleus; scp‐ superior cerebellar peduncle.
Figure 3
Figure 3
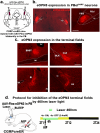
Expression of eOPN3 in the terminal fields of the PBelCGRP neurons. a–c) CGRP‐creER mice were injected bilaterally in the PBel with the cre‐dependent viral vector that co‐expresses eOPN3 (AAV‐hSyn1‐SIO‐eOPN3‐mScarlet) and mScarlet. b,c) eOPN3 expression is shown in the PBelCGRP neurons, and their terminals in the corresponding projection sites are immunolabeled for dsRed (scale: 100 µm). d) Protocol for optogenetic inhibition of PBelCGRP neuron terminals in the AIP model, which blocks the excitatory input from the PBelCGRP neurons at the targeted site. Abbreviations: ac, anterior commissure; SI, substantia innominata; BNST, bed nucleus of stria terminalis; ic, internal capsule; CeA, central nucleus of amygdala; LH, lateral hypothalamus; PBcl, central lateral PB subnucleus; PBel, external lateral PB subnucleus; scp, superior cerebellar peduncle.
Figure 4
Figure 4
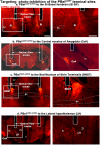
Optical fiber tracts in forebrain arousal areas for optogenetic inhibition of PBelCGRP terminals: Photomicrographs showing representative brain sections of eOPN3 expression in the terminal fields of the PBelCGRP neurons (PBelCGRP‐eOPN3) and the bilateral fiber tracts of the corresponding optical fibers (dashed rectangles) in the (a) substantia innominata (SI) of the basal forebrain (BF), (b) central nucleus of the amygdala (CeA) (b), bed nucleus of the stria terminalis (BNST) (c), and the lateral hypothalamus (d). Dashed rectangles in (a–d) marked the optical fiber tracks that illuminated the terminal sites with LED light (460 nm) at a power of 2–4 mW. Scale in a = 500 (left) and 250 (right) µm and b–d = 200 µm. Abbreviations: ac‐ anterior commissure; SI‐ substantia innominata; BNST‐ bed nucleus of stria terminalis; ic‐ internal capsule; CeA‐ the central nucleus of the amygdala; LH‐ lateral hypothalamus.
Figure 5
Figure 5
Recovery of AIP‐induced sleep loss with optogenetic inhibition of PBelCGRP‐eOPN3 terminals: a1) Percentage (mean ±SEM) of the time spent in the NREM sleep on an hourly basis over 24 h post AIP (n = 9) or control (saline; n = 9) compared across the seven conditions: Saline in CGRP‐creER, AIP in CGRP‐creER mice, AIP in WT mice, AIP with optogenetic inhibition of PBelCGRP‐eOPN3 terminals in the SI‐BF (BFeOPN3; n = 7) or in the CeA (CeAeOPN3; n = 7), or in the BNST (BNSTeOPN3; n = 8), or in the LH (LHeOPN3; n = 5). Wildtype mice (WT) that had a similar injection of the viral vector in the PB, but it did not transduce the PBelCGRP neurons, were also recorded for sleep in response to AIP with laser illumination (WT+AIP; n = 7). a2) Data averaged (Mean ± SEM) over 3 h bins during the light phase. a3) Bar graphs show the averaged NREM (Mean ± SEM) from the same groups as in a1 and a2 over the light phase post‐AIP. Comparison of sleep showed that the order of effect of photoinhibition on sleep reversal was SI‐BF> CeA> BNST> LH. b) Bar graphs showing the recovery in AIP‐induced sleep fragmentation, with individual data points for each mouse included. The sleep fragmentation is assessed by the number of NREM bouts (mean ± SEM; b1) and average sleep bout durations (mean ± SEM; in sec) (b2) for the groups described above, during the light phase post‐injection. Groups were compared using a two‐way (a1, a2) or one‐way (a3‐b2) ANOVA, followed by the Holms‐Sidak method for multiple comparisons, where **, ##p < 0.001; *, #p < 0.01. The color of the asterisk represents the group being compared with the AIP, while # ‐represents a comparison to WT+AIP (a1‐a2). The color of * and # in a3–b2 represents the comparison to AIP and WT‐AIP, respectively. Exact p values for each comparison are mentioned in detail in the results section.
Figure 6
Figure 6
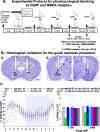
Recovery of AIP‐induced sleep loss with pharmacological blocking of SI‐BF or CeA using CGRP or NMDA receptor antagonists: a) Experimental timeline and protocol for sleep/wake recordings of WT mice during either Formalin (AIP) or Saline (control), with or without local brain injection of either CGRP (BIBN4096BS; 80 µg µl−1) or NMDA (AP‐5; 40 µg µl−1) receptor antagonist, using a programmable dual syringe pump connected to a guide cannula implanted bilaterally in either the SI‐BF or CeA. Both pharmacological blockers were administered using a 10 µl Hamilton syringe at a rate of 3.3 nl s−1 for a total volume of 200 nl. b) Photomicrographs of Nissl‐stained brain sections with the tracks of the guide cannulas (black dashes) used for insertion of the injector cannulas, the tips of which have been marked with additional thionine stain to show vicinity (within a radius of 1–1.5 mm; scale: 0.5 mm) to the substantia innominata (SI‐BF; b1) and the central nucleus of the amygdala (CeA, b2). c) Bar graphs show the percentage (mean ± SEM) time in NREM on an hourly basis over 24 h (c1), and in 3 h bins over the first 6 h (c2), after either AIP or Saline (control). The shaded box represents the active/ dark phase. Sample sizes for the graphs in c1 and c2 are, Saline, n = 9; AIP, n = 9; BIBNBF +AIP, n = 6; BIBNCeA +AIP, n = 5; AP5BF +AIP, n = 6; AP5CeA +AIP, n = 5; BIBNBF, n = 3; AP5BF, n = 3. Groups were statistically compared using a two‐way (treatment X time) ANOVA, followed by the Holms‐Sidak method for multiple comparisons, where **p < 0.001; *p < 0.01. The color of the asterisk represents the group being compared to the AIP group. Exact p values for each comparison are mentioned in detail in the results section.

References

    1. Yong R. J., Mullins P. M., Bhattacharyya N., Pain 2022, 163, E328. - PubMed
    1. Sun Y., Laksono I., Selvanathan J., Saripella A., Nagappa M., Pham C., Englesakis M., Peng P., Morin C. M., Chung F., Sleep Med. Rev. 2021, 57, 101467. - PubMed
    1. Bonvanie I. J., Oldehinkel A. J., Rosmalen J. G. M., Janssens K. A. M., Pain 2016, 157, 957. - PubMed
    1. Finan P. H., Goodin B. R., Smith M. T., J. Pain 2013, 14, 1539. - PMC - PubMed
    1. Alexandre C., Miracca G., Holanda V. D., Sharma A., Kourbanova K., Ferreira A., Bicca M. A., Zeng X., Nassar V. A., Lee S., Kaur S., Sarma S. V., Sacré P., Scammell T. E., Woolf C. J., Latremoliere A., Sci. Transl. Med. 2024, 16, eadg3036. - PMC - PubMed

Substances

LinkOut - more resources