

Ligand-Receptor Analysis of Brain Cell Type Marker Data Reveals Intricate Endothelial Interaction
- PMID: 40584275
- PMCID: PMC12204993
- DOI: 10.1177/09727531251343254
Ligand-Receptor Analysis of Brain Cell Type Marker Data Reveals Intricate Endothelial Interaction
Abstract
Background: Brain endothelial interaction with neurons, astrocytes, oligodendrocytes and microglial cells is critical for brain physiology; it is still far from being mapped. Understanding of the endothelial communication with other brain cell type could unravel novel insight into neurovascular homeostasis.
Purpose: This study aims to construct neurovascular interaction network, focusing on brain endothelial cell interactome using brain cell marker gene dataset and ligand-receptor (LR) pair.
Methods: We curated brain marker gene list from McKenzie et al.'s brain cell type top 1000 marker list of endothelial, microglia, astrocyte, neuron, oligodendrocyte and oligodendrocyte progenitor cell (OPC) and extracted LR interaction between them. Subsequently, using Cytoscape, endothelial cell interaction map was constructed and top interaction and hub gene were derived. Moreover, we performed Kyoto encyclopedia of genes and genomes (KEGG) pathways enrichment (p value < .1) to infer biological information hidden.
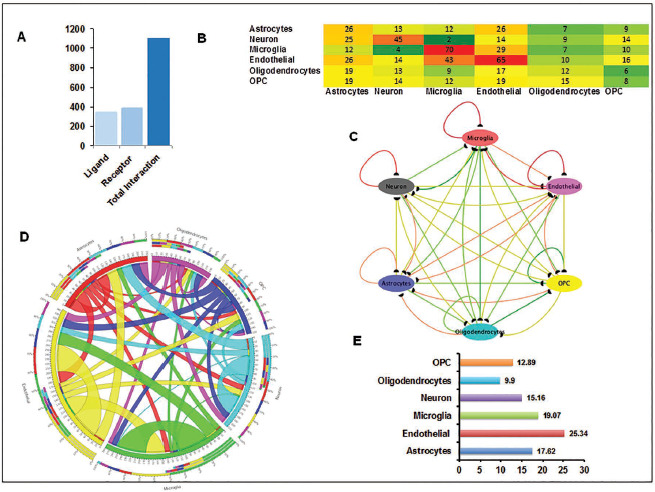
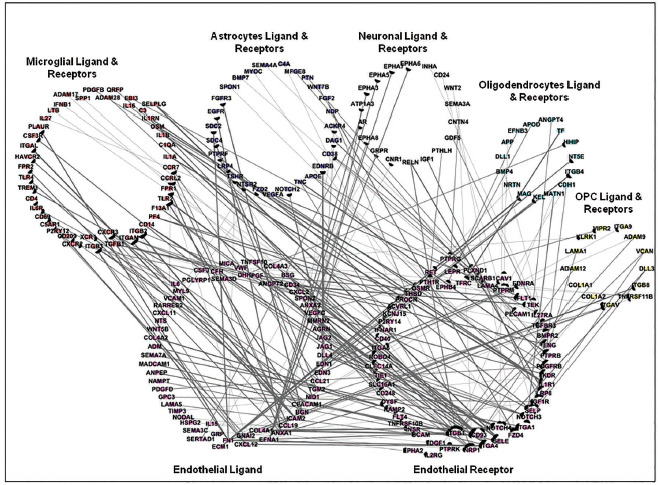
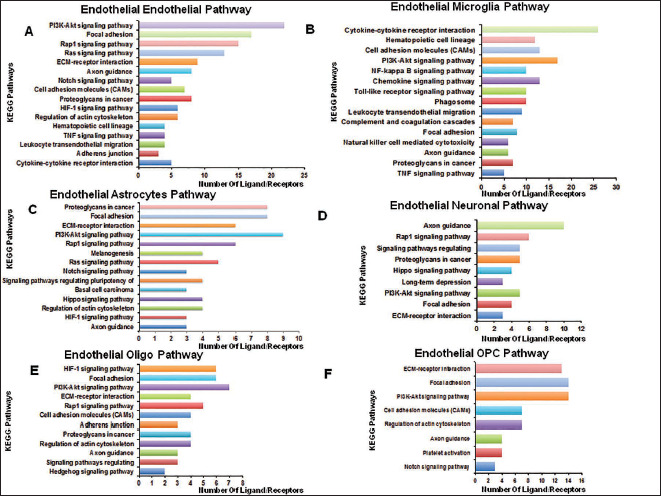
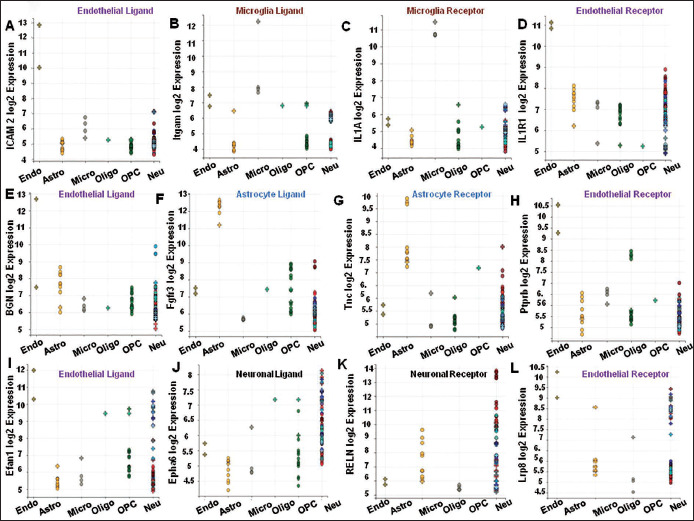
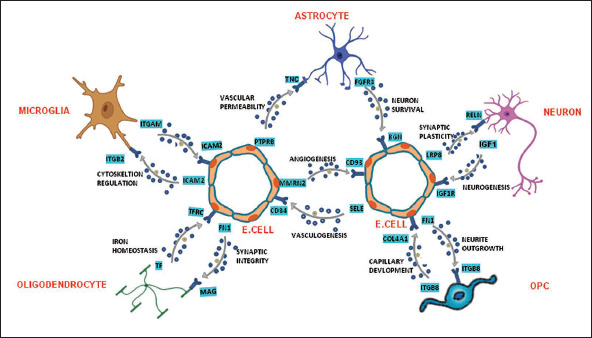
Results: Neurovascular LR interaction showed endothelial cells as the top network having 25.34% of total interaction with 176 outgoing and 171 incoming interactions. A considerable portion of signalling (11%) is involved in autocrine signalling functionally related to vascular tone, angiogenesis and others. Paracrine signalling between endothelial cells with microglia, astrocytes, neurons and OPC constituted 13.5%, 8.9%, 5.8% and 4.9% of total interactions, respectively. Functional enrichment of LR interaction in endothelial-microglia, endothelial-astrocyte and endothelial-neuron networks constitutes 49, 45 and 36 significant KEGG pathways (p value < .1) respectively. These pathways include extracellular matrix (ECM) receptor, axon guidance, chemokine, nuclear factor kappa B (NF-kB) and signalling pathways, among others. Hub gene analysis showed ITGB1 in endothelial cells, ITGA4 in microglia, NOTCH2 in astrocytes and LAMC2 in neurons having maximum interaction in the endothelial network.
Conclusion: This study recapitulated not only previously known gene interactions using a markers gene list but also identified novel interactions between endothelial and other brain cell types. In conclusion, this analysis underscores the critical role of endothelial cell interactions in brain physiology.
Keywords: Function; genetics; neurology; physiology.
© The Author(s) 2025.
Conflict of interest statement
The authors declared no potential conflicts of interest with respect to the research, authorship and/or publication of this article.
Figures
Similar articles
-
Systemic pharmacological treatments for chronic plaque psoriasis: a network meta-analysis.Cochrane Database Syst Rev. 2021 Apr 19;4(4):CD011535. doi: 10.1002/14651858.CD011535.pub4. Cochrane Database Syst Rev. 2021. Update in: Cochrane Database Syst Rev. 2022 May 23;5:CD011535. doi: 10.1002/14651858.CD011535.pub5. PMID: 33871055 Free PMC article. Updated.
-
Systemic pharmacological treatments for chronic plaque psoriasis: a network meta-analysis.Cochrane Database Syst Rev. 2017 Dec 22;12(12):CD011535. doi: 10.1002/14651858.CD011535.pub2. Cochrane Database Syst Rev. 2017. Update in: Cochrane Database Syst Rev. 2020 Jan 9;1:CD011535. doi: 10.1002/14651858.CD011535.pub3. PMID: 29271481 Free PMC article. Updated.
-
Home treatment for mental health problems: a systematic review.Health Technol Assess. 2001;5(15):1-139. doi: 10.3310/hta5150. Health Technol Assess. 2001. PMID: 11532236
-
A rapid and systematic review of the clinical effectiveness and cost-effectiveness of paclitaxel, docetaxel, gemcitabine and vinorelbine in non-small-cell lung cancer.Health Technol Assess. 2001;5(32):1-195. doi: 10.3310/hta5320. Health Technol Assess. 2001. PMID: 12065068
-
Does Augmenting Irradiated Autografts With Free Vascularized Fibula Graft in Patients With Bone Loss From a Malignant Tumor Achieve Union, Function, and Complication Rate Comparably to Patients Without Bone Loss and Augmentation When Reconstructing Intercalary Resections in the Lower Extremity?Clin Orthop Relat Res. 2025 Jun 26. doi: 10.1097/CORR.0000000000003599. Online ahead of print. Clin Orthop Relat Res. 2025. PMID: 40569278
References
-
- Segarra M, Aburto MR and Acker-Palmer A.. Blood-brain barrier dynamics to maintain brain homeostasis. Trends Neurosci 2021; 44: 393–405. DOI: 10.1016/j.tins.2020.12.002 - PubMed
-
- Wu KW, Lv LL, *Lei Y, et al. Endothelial cells promote excitatory synaptogenesis and improve ischemia-induced motor deficits in neonatal mice. Neurobiol Dis 2019; 121: 230–239. DOI: 10.1016/j.nbd.2018.10.006 - PubMed
LinkOut - more resources
Full Text Sources
Miscellaneous
