. 2025 Jun 11;10(24):25376-25393.
doi: 10.1021/acsomega.5c00472. eCollection 2025 Jun 24.

Putative G‑Quadruplex Structures in Dysregulated Long Non-coding RNA of Ovarian Cancer and Their Binding Interactions with Human Serum Albumin

Affiliations

Putative G‑Quadruplex Structures in Dysregulated Long Non-coding RNA of Ovarian Cancer and Their Binding Interactions with Human Serum Albumin

Deepshikha Singh et al. ACS Omega. .

Abstract

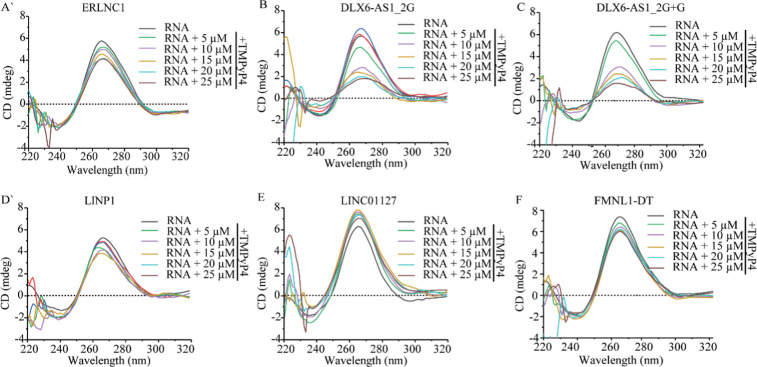
Long noncoding RNAs (lncRNAs) influence the progression, metastasis, and drug resistance of various cancers including ovarian cancer (OC). Putative G-quadruplex (G4)-forming sequences that are abundant in cancer-dysregulated lncRNAs have not been systematically pursued from a structure-function correlation perspective. In this work, we have used a combination of informatics, computational tools, spectroscopy, and molecular biology experiments to identify G4 formation by the OC-dysregulated lncRNAs ERLNC1, DLX6-AS1, LINC01127, FMNL1-DT, and LINP1. The in vitro ability of the lncRNAs to fold into G4 structures was accompanied by interesting profiles of individual G-tract contributions and response to monovalent cations, ligand TMPyP4, and G4-targeting antibody. Human serum albumin (HSA) was found to interact with these G4-forming lncRNAs, albeit with different affinities and structural implications for the G4 motifs. The G4-motif likely plays a crucial role in the binding interactions of select lncRNAs with HSA. This study provides the first systematic study of putative G4-forming sequences in OC-dysregulated lncRNAs and elucidates their interactions with HSA. The interaction of lncRNAs with HSA, possibly facilitated by G4 motifs, can be valuable for OC diagnosis and therapeutics.


Figures

1
1
CD spectra of PQSs of OC-dysregulated lncRNAs. CD spectra of lncRNAs (5 μM) in the absence of additional ions and presence of monovalent cations K+ (100 mM) or Li+ (100 mM) (A) ERLNC1, (B) DLX6-AS1_2G, (C) DLX6-AS1_2G + G, (D) LINP1, (E) LINC01127, and (F) FMNL1-DT.
2
2
CD spectra of PQSs of OC-dysregulated lncRNAs in varying amounts of TMPyP4. CD of lncRNAs (5 μM) in the presence of 5, 10, 15, 20, and 25 μM TMPyP4. (A) ERLNC1, (B) DLX6-AS1_2G, (C) DLX6-AS1_2G + G, (D) LINP1, (E) LINC01127, and (F) FMNL1-DT.
3
3
ThT fluorescence enhancement assay. Emission spectra of lncRNA (2 μM) in the presence of K+ or Li+ and ThT (2 μM) when excited at 445 nm. (A) ERLNC1, (B) DLX6-AS1_2G, (C) DLX6-AS1_2G + G, (D) LINP1, (E) LINC01127, and (F) FMNL1-DT. (G) Fold enhancement of ThT fluorescence in the presence of monovalent cations, with excitation and emission at 445 and 488 nm, respectively. Unpaired t-test was used for statistical analysis, and the resulting statistical significance (P-values) are denoted with asterisks (*). Nonsignificant P-values are not represented.
4
4
ThT fluorescence enhancement assay of deletion mutants. ThT fluorescence enhancement assay of wild-type RNAs and deletion mutants (2 μM) folded in the presence of 100 mM KCl or LiCl with ThT (2 μM). (A) ERLNC1, (B) DLX6-AS1_2G + G, (C) LINP1, and (D) LINC01127. Fold enhancement of ThT fluorescence plotted in mean ± SEM at 488 nm when excited at 445 nm. Unpaired t-test was used for statistical analysis, and the resulting statistical significance (P-values) are denoted with asterisks (*). Nonsignificant P-values are not represented.
5
5
Behavior of substitution mutants of PQS of OC-dysregulated lncRNAs. (A,B) CD spectra of wild type and substitution mutants of lncRNAs DLX6-AS1_2G + G and LINP1. (C) Native PAGE (15%) of folded IVT-derived wild type and substitution mutants of lncRNAs DLX6-AS1_2G + G and LINP1 stained with ThT and diamond nucleic acid. (D) ThT fluorescence enhancement assay of substitution mutants folded in the presence of 100 mM KCl or LiCl with ThT. Fold enhancement of ThT fluorescence plotted in mean ± SEM at 488 nm when excited at 445 nm. An unpaired t-test was used for statistical analysis, and the resulting statistical significance (P-values) are denoted with asterisks (*).
6
6
Complementary oligonucleotide-mediated-G4 disruption. Folded lncRNA PQS (2 μM) in the presence of increasing concentrations of complementary DNA, stained with 0.5 μM ThT. (A–E) ERLNC1 with Comp1, Comp2, Comp3, Comp4, and Comp1234 respectively. (F–J) DLX6-AS1_2G + G with Comp1, Comp2, Comp3, Comp4, and Comp1234 respectively. (K–O) LINP1 with Comp1, Comp2, Comp3, Comp4, and Comp1234, respectively. The bands were normalized against respective non-complementary sequence controls. P-values are calculated by ordinary one-way ANOVA, and the resulting statistical significance is denoted with asterisks (*). Nonsignificant P-values are represented as ns.
7
7
Reverse transcriptase stop assay for assessing the influence of monovalent cations on the stability of G4s (A) DLX6-AS1_2G + G and (B) LINP1 lncRNA in the presence of increasing concentrations of KCl and LiCl. I shows the produced full-length (bands 1 and 2) and truncated cDNA after reverse transcription of the respective lncRNA in the presence of increasing concentrations (0, 50, 100, and 150 mM) of KCl in vitro. II, III, the corresponding quantification of full-length template bands and stop product. IV shows the produced full-length (bands 1 and 2) and truncated cDNA after reverse transcription of lncRNA in the presence of increasing LiCl concentrations (0, 50, 100, and 150 mM) in vitro. V, VI are the corresponding quantification of full-length template bands and stop product. Ordinary one-way ANOVA was employed for the statistical analysis, and the resulting statistical significance is denoted with asterisks (*). Nonsignificant P-values are represented as ns.
8
8
Dot blot assay for PQS of OC-dysregulated lncRNAs in the presence of different ions and ligands. Rows represent the lncRNAs ERLNC1, DLX6-AS1_2G + G, LINP1, LINC01127, FMNL1-DT, TERRA, and columns represent the treatment conditions: enabled control, disabled control, 100 mM KCl, 100 mM LiCl, 10 μM TMPyP4.
9
9
ITC of ERLNC1, DLX6-AS1_2G + G, and LINP1 with HSA. Binding isotherms of A–C, ERLNC1; D–F, DLX6-AS1_2G + G; and G–I, LINP1, were fitted to determine ΔG, ΔH, and -TΔS for the interaction of the RNAs with HSA.
10
10
ThT fluorescence enhancement assay of ERLNC1, DLX6-AS1_2G + G, and LINP1 in the presence of HSA. (A) Schematic representation of the ThT fluorescence assay in the presence of lncRNAs and increasing concentration of HSA. (B–D) Fold enhancement of ThT fluorescence for G4 lncRNAs (2 μM): (B) ERLNC1, (C) DLX6-AS1_2G + G, and (D) LINP1 in the presence of HSA (5 μM to 60 μM). Excitation and emission were at 445 and 488 nm, respectively. An unpaired t-test was used for statistical analysis, and all the resulting P-values were significant.
11
11
(A) EMSA of lncRNA DLX6-AS1_2G + G with HSA. I. Annealed and folded DLX6-AS1_2G + G (4 μM) with increasing concentration of HSA visualized in rhodamine filter. II. Annealed and folded DLX6-AS1_2G + G (4 μM) with increasing concentration of HSA stained with ThT. III, IV, V. Quantification of bands 1, 2, and 3, respectively, as indicated in the figure. (B) EMSA of lncRNA LINP1 with HSA. I. Annealed and folded LINP1 (4 μM) with increasing concentration of HSA visualized in rhodamine filter. II. Annealed and folded LINP1 (4 μM) with increasing concentration of HSA stained with ThT. (C) Evaluation of RNA concentration on molecularity. I. DLX6-AS1_2G + G in increasing concentration (0.25 μM- 5 μM) visualized after ThT staining. II. DLX6-AS1_2G + G in increasing concentration (0.25 μM- 5 μM) visualized after diamond nucleic acid staining. III, IV. Quantification of bands 1 and 2, respectively, as indicated in the figure. Ordinary one-way ANOVA was employed for the statistical analysis, and all the resulting P-values were significant.

Similar articles

References

    1. Ørom U. A., Derrien T., Beringer M., Gumireddy K., Gardini A., Bussotti G.. et al. Long Noncoding RNAs with Enhancer-like Function in Human Cells. Cell. 2010;143(1):46–58. doi: 10.1016/j.cell.2010.09.001. - DOI - PMC - PubMed
    1. Rintala-Maki N. D., Sutherland L. C.. Identification and characterisation of a novel antisense non-coding RNA from the RBM5 gene locus. Gene. 2009;445(1–2):7–16. doi: 10.1016/j.gene.2009.06.009. - DOI - PubMed
    1. Zhu L., Guo Q., Lu X., Zhao J., Shi J., Wang Z.. et al. CTD-2020K17.1, a Novel Long Non-Coding RNA, Promotes Migration, Invasion, and Proliferation of Serous Ovarian Cancer Cells In Vitro. Med. Sci. Monit. 2018;24:1329–1339. doi: 10.12659/MSM.908456. - DOI - PMC - PubMed
    1. Qiu J., Lin X., Tang X., Zheng T., Zhang X., Hua K.. Long noncoding RNA TC0101441 induces epithelial–mesenchymal transition in epithelial ovarian cancer metastasis by downregulating KiSS1. Int. J. Cancer. 2020;146(9):2588–2598. doi: 10.1002/ijc.32692. - DOI - PubMed
    1. Ma S.-Y., Wei P., Qu F.. KCNMA1-AS1 attenuates apoptosis of epithelial ovarian cancer cells and serves as a risk factor for poor prognosis of epithelial ovarian cancer. Riv. Eur. Sci. Med. Farmacol. 2019;23(11):4629–4641. doi: 10.26355/eurrev_201906_18041. - DOI - PubMed

LinkOut - more resources