[Preprint]. 2025 Jun 11:2025.06.10.25328700.
doi: 10.1101/2025.06.10.25328700.

Multicenter Histology Image Integration and Multiscale Deep Learning for Machine Learning-Enabled Pediatric Sarcoma Classification

Affiliations

Multicenter Histology Image Integration and Multiscale Deep Learning for Machine Learning-Enabled Pediatric Sarcoma Classification

Adam Thiesen et al. medRxiv. .

Abstract

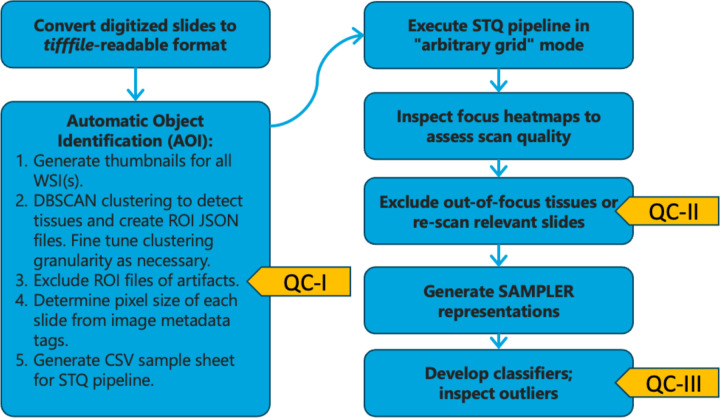
Pediatric sarcomas present diagnostic challenges due to their rarity and diverse subtypes, often requiring specialized pathology expertise and costly genetic tests. To overcome these barriers, we developed a computational pipeline leveraging deep learning methods to accurately classify pediatric sarcoma subtypes from digitized histology slides. To ensure classifier generalizability and minimize center-specific artifacts, we collected and harmonized a dataset comprising 867 whole slide images (WSIs) from three medical centers and the Children's Oncology Group (COG). Multiple convolutional neural network (CNN) and vision transformer (ViT) architectures were systematically evaluated as feature extractors for SAMPLER-based WSI representations, and input parameters such as tile size combinations and resolutions were tested and optimized. Our analysis showed that advanced ViT foundation models (UNI, CONCH) significantly outperformed earlier approaches, and incorporating multiscale features can enhance classification accuracy. Our optimized models achieved high performance, distinguishing rhabdomyosarcoma (RMS) from non-rhabdomyosarcoma (NRSTS) with an AUC of 0.969±0.026 and differentiating RMS subtypes (alveolar vs. embryonal) with an AUC of 0.961±0.021. Additionally, a two-stage pipeline effectively identified scarce Ewing sarcoma images from other NRSTS (AUC 0.929). Compared to conventional transformer encoder architectures used for WSI representations, our SAMPLER based classifiers were more lightweight (0.111 MB vs. 1.9 MB) and three orders of magnitude faster to train. This study highlights that digital histopathology paired with rigorous image harmonization provides a powerful solution for pediatric sarcoma classification. Our models reduce inter-observer variability, augment diagnostic precision, and have the potential to increase global accessibility to robust diagnostics, improving time to diagnosis and subsequent treatment planning.


Figures

Figure 1.
Figure 1.. Workflow for processing whole slide images (WSI).
The process begins with converting WSIs into a tifffile-readable format. The Automatic Object Identification (AOI) tool is then used to identify regions of interest (ROI) within the tissue samples, generating JSON files. Files of histology artifacts are filtered out. The STQ pipeline is executed in “arbitrary grid” mode to process each image and generate focus maps, tiling grid, imaging and nuclear morphometric features. The focus maps are examined for quality, with out-of-focus regions re-scanned or excluded. Finally, a SAMPLER WSI representation is generated for each tissue, followed by downstream classification analyses. Quality control has three distinct stages indicated with yellow pointers.
Figure 2.
Figure 2.. Benchmarking of deep learning backbones and image scales for pediatric alveolar vs embryonal sarcoma histological subtype classification.
A, Mean area-under-ROC curve values for each of the 4 backbones at each FOV. B, Mean AUROCs from 5-fold cross validation with fixed random seeds for pairwise combinations of feature sets, where each feature set derives from a FOV for a given backbone. C, ROC curve for the best performing backbone combination, as measured over 100 5-fold cross-validation iterations. D, Plot of precision, recall, and F1 score curves for the best performing backbone combination (CONCH, FOV 1+2). E, Confusion matrix using the optimal threshold, averaged across all cross-validation iterations and expressed as percentages. F, Precision, recall, F1 score, and accuracy for the best performing backbone combination.
Figure 3.
Figure 3.. Alternative workflow using MHSA transformer architecture for pediatric sarcoma histological subtype classification.
A, As a comparison to the SAMPLER and logistic-regression approach, we implemented the MHSA Transformer architecture to learn a WSI representation based on the interactions between tiles and then make classification predictions. B, ROC curve for the MHSA Transformer model in the task of Alveolar vs Embryonal classification. C, Averaged confusion matrix at threshold 0.5 for the Transformer. D, Precision, recall, F1 score, and accuracy metrics for the Transformer model.
Figure 4.
Figure 4.. Benchmarking of deep learning backbones and image scales for pediatric RMS vs NRSTS sarcoma histological type classification.
A, Comparison of mean AUCs for the 4 deep learning backbones at each FOV. B, Comparison of combinations of concatenated FOV features for each backbone, mean AUC. C, ROC curve for the best performing backbone combination over 100 iterations. D, Plot of precision, recall, and F1 score curves for the best performing backbone combination. E, Confusion matrix across all fold test sets, using the optimal threshold, expressed as percentages. F, Precision, recall, F1 score, and accuracy for the best performing backbone combination.
Figure 5.
Figure 5.. Two-stage classification of Ewing sarcoma.
A, Schematic showing the two-stage classification workflow, where models are trained on all images in the dataset, and predicted NRSTS cases are moved to the second stage of classification. B, Confusion matrix for the combined stages is shown at threshold 0.8 (B). C, ROC curve for the first stage of classification NRSTS vs RMS. Any sample classified as NRSTS then moves to the next round for further subtyping. D, ROC curve for Ewing vs non-Ewing classification. E/F/G, Precision, recall, F1 score, accuracy and support for the two models.
Figure 6.
Figure 6.. Spatial inference of histological types and subtypes of sarcoma.
Panels A-C represent different subtypes of non-rhabdomyosarcoma soft tissue sarcomas (NRSTS) and rhabdomyosarcomas (RMS). Each panel includes three images: Hematoxylin and Eosin (H&E) stained tissue section (left), probability heatmap of NRSTS (middle), and probability heatmap of the specific subtype (right). A, Synovial NRSTS. B, Alveolar RMS. C, Ewing NRSTS. The heatmaps illustrate the spatial distribution of contributing features, which may aid in pathologist visual assessment and further validation by other assays.

References

    1. Florou V., Nascimento A. G., Gulia A. & de Lima Lopes G. Global Health Perspective in Sarcomas and Other Rare Cancers. Am. Soc. Clin. Oncol. Educ. Book 916–924 (2018) doi: 10.1200/EDBK_200589. - DOI - PubMed
    1. Children’s Oncology Group’s 2023. Blueprint for Research: Soft Tissue Sarcomas - PMC. https://pmc.ncbi.nlm.nih.gov/articles/PMC10519430/. - PMC - PubMed
    1. Grünewald T. G. et al. Sarcoma treatment in the era of molecular medicine. EMBO Mol. Med. 12, e11131 (2020). - PMC - PubMed
    1. Rhabdomyosarcoma: Updates on classification and the necessity of molecular testing beyond immunohistochemistry - ClinicalKey. https://www.clinicalkey.com/#!/content/playContent/1-s2.0-S0046817723002.... - PubMed
    1. Williamson D. et al. Fusion Gene–Negative Alveolar Rhabdomyosarcoma Is Clinically and Molecularly Indistinguishable From Embryonal Rhabdomyosarcoma. J. Clin. Oncol. 28, 2151–2158 (2010). - PubMed

Publication types

LinkOut - more resources