[Preprint]. 2025 Jun 12:2025.06.11.25329386.
doi: 10.1101/2025.06.11.25329386.

Diverse Genomes, Shared Health: Insights from a Health System Biobank

Affiliations

Diverse Genomes, Shared Health: Insights from a Health System Biobank

Roni Haas et al. medRxiv. .

Abstract

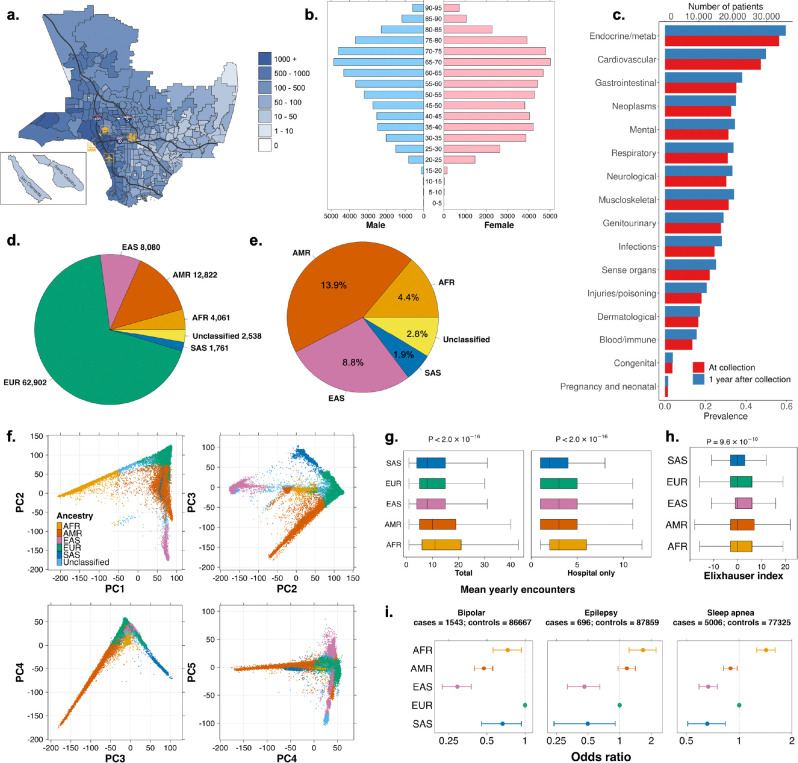
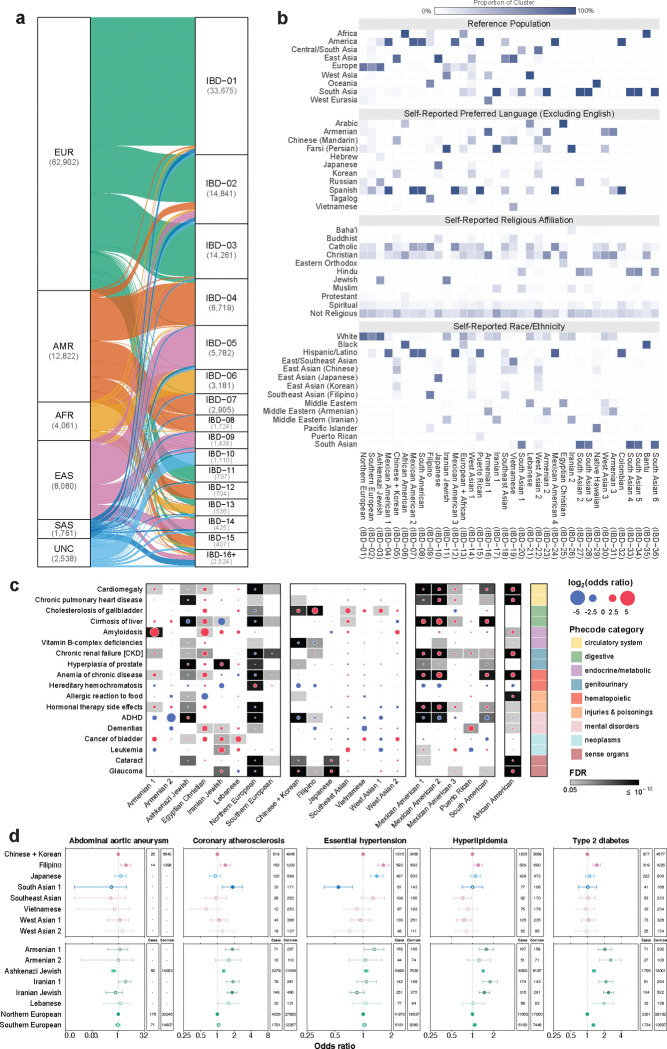
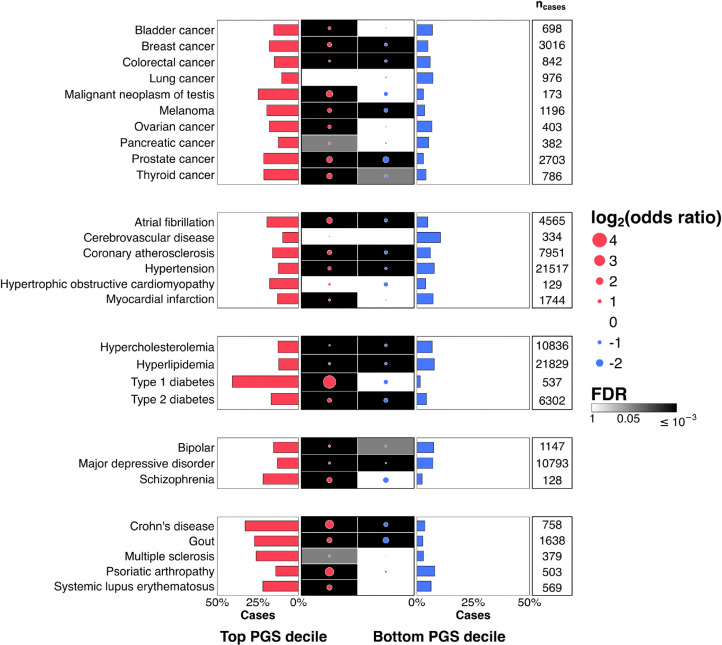
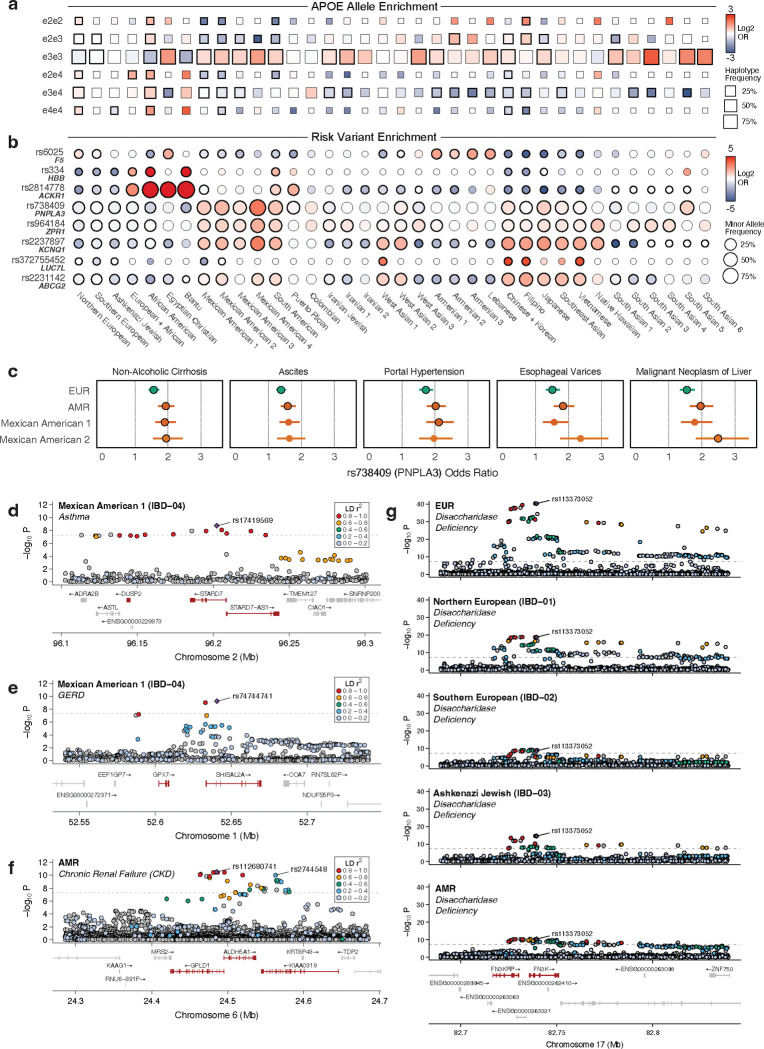
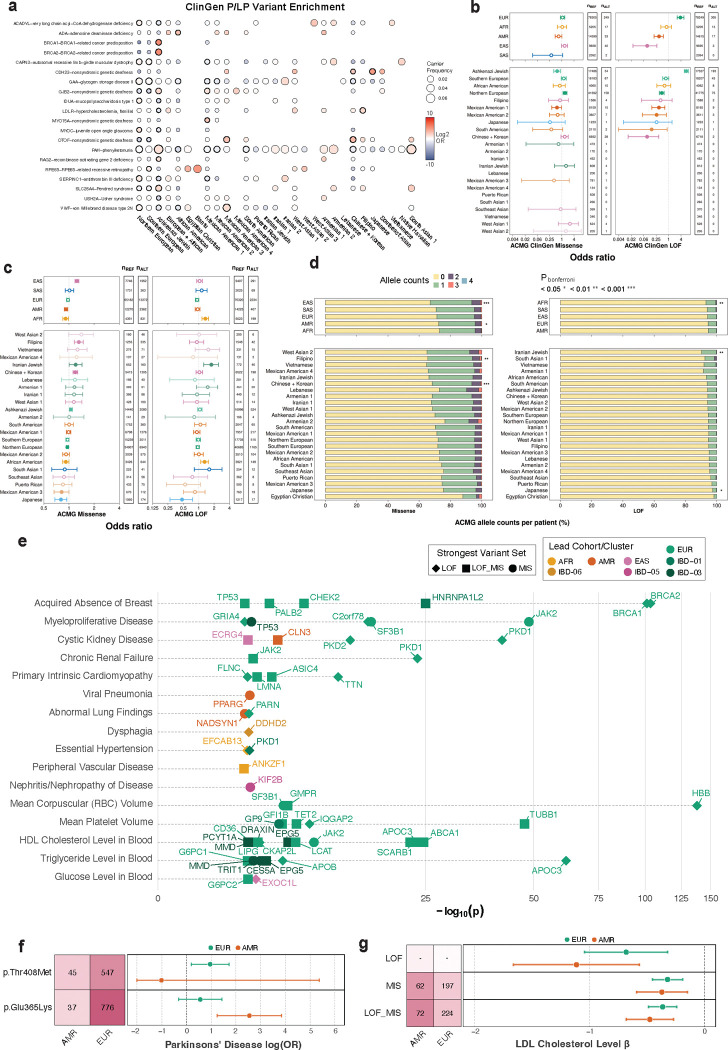
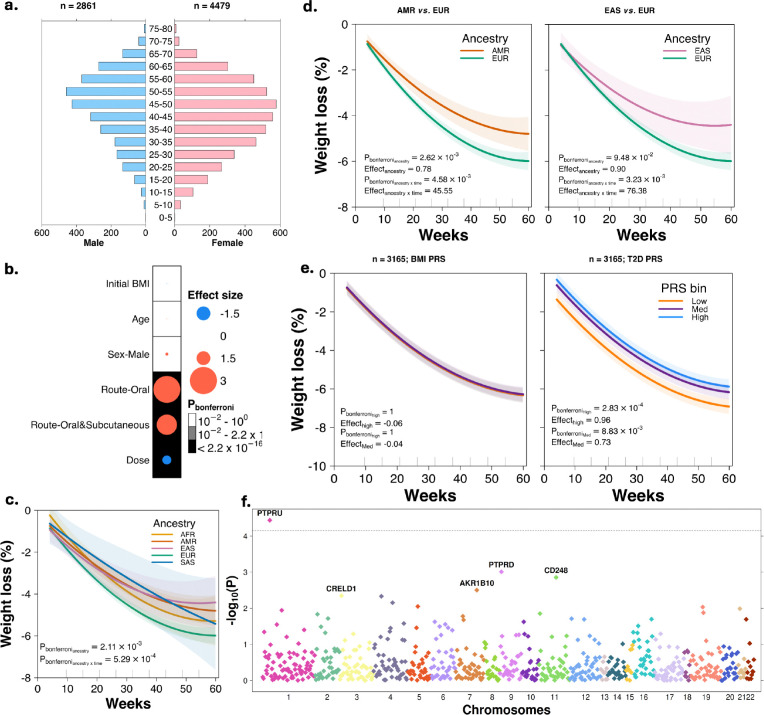
Coupling genetic profiling with electronic health records from hospital biobanks is a foundational resource for precision medicine. However, lack of ancestral heterogeneity limits discovery and generalizability. We leveraged the UCLA ATLAS Community Health Initiative, a diverse biobank with >35% non-European participants in a single health system, to inform disease prevalence and genetic risk across five continental and 36 fine-scale ancestry groups. Analyzing clinical and genetic data for 93,937 individuals, 61,797 with whole-exome sequencing (WES), we identified novel associations between genetic variants and phenotypes, including STARD7 with asthma risk in Mexican Americans and FN3K with intestinal disaccharidase deficiency across Europeans and Admixed Americans. Top decile polygenic scores (PGS) predicted patient status for many common diseases (40% of patients with Type 1 diabetes); an effect markedly diminished in non-Europeans. Exploring the distribution of ACMG ClinGen rare variants across populations demonstrated European bias in curated clinical variants. Mitigating this bias using computationally predicted deleterious variants, we identified new gene-disease associations, including EXOC1L and blood glucose level in East Asians. We identified PTPRU as a modulator of semaglutide's effects on weight loss, and additionally found variability across ancestries and a relationship with type-2-diabetes PGS. We provide an interactive web portal for accessing cross-ancestry associations at atlas-phewas.mednet.ucla.edu. Collectively, our findings support the value of ancestral diversity in advancing precision health across a broad spectrum of populations.


Conflict of interest statement

Competing Interests P.S is a consultant for 10X Genomics, Illumina, Foresight Diagnostics, Natera, and Twinstrand. P.C.B. sits on the scientific advisory boards of Sage Bionetworks, Intersect Diagnostics and BioSymetric. All other authors declare no conflict of interest.

Figures

Figure 1.
Figure 1.. Overview of the UCLA ATLAS biobank.
a. Choropleth map of ATLAS participants within Los Angeles County, with major highways and landmarks labelled b. Distribution of ATLAS participants by age and sex c. Prevalence of phecode groups in the UCLA ATLAS population at the time of collection and within one year of the ATLAS launch date. d. Genetic ancestry sample sizes. e. Genetic ancestry fractions of non-EUR populations. Although EUR are not presented, percentages were calculated using all ATLAS populations, including EUR. f. Genetic PCs of ATLAS individuals. Colors are according to the ancestry predictions as inferred from 1000 Genomes. g. Mean yearly encounters vary across genetic ancestries. h. Comorbidity index across genetic ancestries. i. New associations between clinical phenotypes and broad-scale ancestries.
Figure 2.
Figure 2.. Introduction to IBD mapping and fine-scale ancestry disease risk.
a. The distribution of genetic ancestry between fine- and broad-scale populations. b. Enrichment of reference populations, self-reported language, religion and race across fine-scale ancestries. c. The risk of phenotype-defined phecodes across fine-scale genetic ancestries. Each fine-scale population was tested against all ATLAS participants outside of this population. Only populations with at least 100 participants were tested, and phecodes with at least 100 cases across ATLAS, resulting in 23 tested populations and 1,253 phecodes. FDR was used to control for multiple testing. d. Cardiometabolic disease risk for each fine-scale group within the same broad-scale continental ancestry. Representative cardiometabolic phecodes were selected, and only populations with at least 100 participants were tested. In cases of small sample sizes, ‘–’ was used instead of numeric values to protect patient privacy. Filled points represent significant results (FDR ≤ 0.05).
Figure 3.
Figure 3.. Polygenic risk and disease diagnoses.
The impact of the top and bottom PGS on disease risk is evaluated through odds ratios (dotmps). The top and bottom PRS deciles were compared to the 5th declle to calculate the OR using a logistic regression model (Methods). The numbers of diagnosed patients assigned to the top or bottom PGS bins are shown in barplots. Red represents the top PGS decile, and blue the bottom PGS decile. Diseases are divided into categories, from top to bottom: cancer, cardiovascular, metabolic, neuro-psychiatric and immunne/autoimmune. Only non-related EUR individuals were included. FDR was used to control for multiple testing.
Figure 4.
Figure 4.. Common Variation in the ATLAS Biobank.
a. APOE haplotype frequency across fine-scale cohorts. b. Allele frequency for known risk variants across fine-scale cohorts; shading indicates the level of over- (red) or under- (blue) enrichment of a haplotype/allele in a given cohort via Fisher’s exact test. In panels a-b, a bold border indicates a significant result. c-g. selected PheWAS associations: c. non-alcoholic cirrhosis risk variant rs738409, indicating cohort-specific risk across a range of sequelae from liver cirrhosis. d. Locus plots for novel associations between rs738409-G and asthma, e. rs74744741-C and GERD, f. rs112680741-C and chronic renal failure, and g. rs7208565-T and intestinal disaccharidase deficiency. Point shading (blue to orange to red) indicates level of ancestry-specific LD with the lead SNP, while gene shading (red) indicates prioritized risk genes.
Figure 5.
Figure 5.. Rare variant findings.
a. ClinGen P/LP variant enrichment across fine-scale ancestries. b. Differences across populations in the total numbers of rare ClinGene P/LP variants in ACMG genes. c. Differences across populations in the total numbers of rare predicted damaging missense and LOF variants in ACMG genes. In b-c, nREF is the total number of reference alleles, and nALT of alternative alleles, which are the rare P/LP ClinGen variants in b, and the rare, predicted LOF/damaging missense variants in c. d. The numbers of rare computationally predicted damaging missense and LOF alleles per individual across ancestries. In b-d, the top panels show broad-scale ancestries, and the bottom fine-scale ancestries. Mann-Whitney U test with a Bonferroni correction was applied to test the difference in the distribution of rare LOF and predicted damaging missense counts per individual between any broad- or fine-scale group compared to all others. Statistically significant differences indicated by an asterisk (*). e. ExWAS significant results for selected traits/ancestries. f-g. Ancestry-specific deleterious variant frequencies (heatmap) and effect sizes (forest plot) for f. GBA1 and g. PCSK9. In cases of small sample sizes, ‘–’ was used instead of numeric values to protect patient privacy.
Figure 6.
Figure 6.. Semaglutide efficacy.
a. Distribution of age by sex in semaglutide ATLAS users. b. The effect of non-genetic factors on weight loss in response to semaglutide. c. Weight loss patterns across genetic ancestry groups. Bonferroni-adjusted P-values are obtained from an ANOVA test on a linear mixed model with covariates. The overall number of weight measurements was 24,152, with a mean of 5 repeated measurements per patient. Ancestry sample sizes were: EUR , 3189; AFR, 373; AMR, 914 ; EAS, 291; SAS, 107. d. Differences in weight loss pattern between AMR and EUR populations (left) and EAS and EUR (right). Bonferroni-adjusted P-values were obtained from a linear mixed-effects model that included covariates. e. The relationship between PGS for BMI (left) and DM2 (right) and weight loss in response to semaglutide. Scaled PGS were divided into 3 groups: high, intermediate and low. The relationship between PGS bins and weight loss was tested using a linear mixed model. Only non-related EUR individuals were considered. In c-e linear mixed model fitted values are plotted with 95% CI, based on longitudinal data with repeated weight measurements. f. Semaglutide candidate protein gene-level test results. Presented are the -log10(P values) following a REGINIE additive model applied to test the genetic association between senaglutide-affected proteins and weight loss on semaglutide. The horizontal line shows the threshold for Bonferroni significant results. The top 5 hits are labeled by gene names. For plotting, gene positions across the genome were defined based on the first base pair.

Similar articles

References

    1. Zhou W. et al. Global Biobank Meta-analysis Initiative: Powering genetic discovery across human disease. Cell Genomics 2, 100192 (2022). - PMC - PubMed
    1. Chambers D. A., Feero W. G. & Khoury M. J. Convergence of Implementation Science, Precision Medicine, and the Learning Health Care System: A New Model for Biomedical Research. JAMA 315, 1941 (2016). - PMC - PubMed
    1. The All of Us Research Program Genomics Investigators et al. Genomic data in the All of Us Research Program. Nature 627, 340–346 (2024). - PMC - PubMed
    1. Kurki M. I. et al. FinnGen provides genetic insights from a well-phenotyped isolated population. Nature 613, 508–518 (2023). - PMC - PubMed
    1. Feng Y.-C. A. et al. Taiwan Biobank: A rich biomedical research database of the Taiwanese population. Cell Genomics 2, 100197 (2022). - PMC - PubMed

Publication types

LinkOut - more resources