

This is a preprint.
AI-based Hepatic Steatosis Detection and Integrated Hepatic Assessment from Cardiac CT Attenuation Scans Enhances All-cause Mortality Risk Stratification: A Multi-center Study
- PMID: 40585138
- PMCID: PMC12204434
- DOI: 10.1101/2025.06.09.25329157
AI-based Hepatic Steatosis Detection and Integrated Hepatic Assessment from Cardiac CT Attenuation Scans Enhances All-cause Mortality Risk Stratification: A Multi-center Study
Abstract
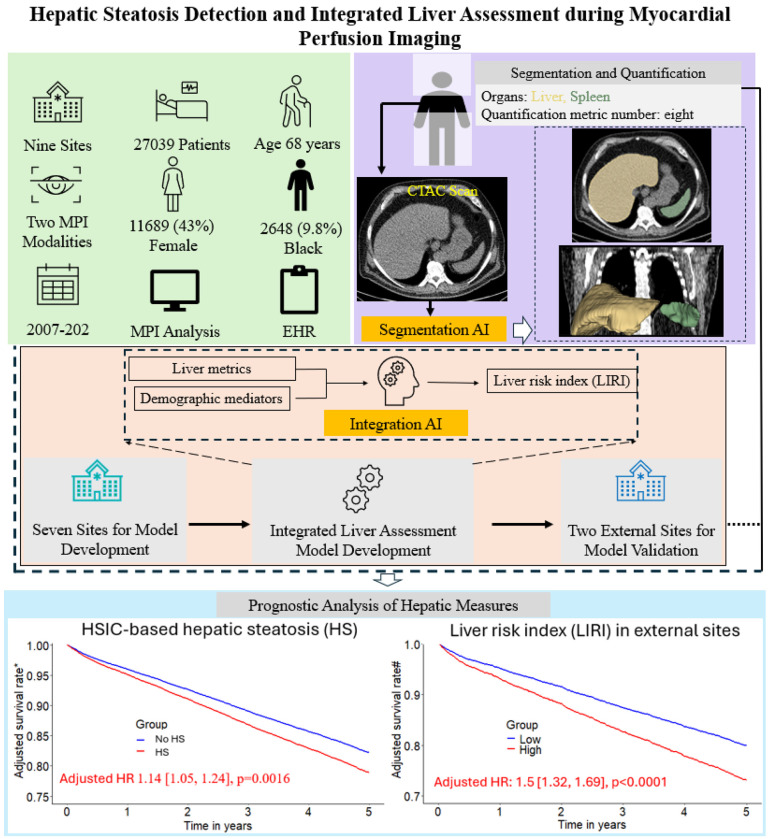
Background: Hepatic steatosis (HS) is a common cardiometabolic risk factor frequently present but under-diagnosed in patients with suspected or known coronary artery disease. We used artificial intelligence (AI) to automatically quantify hepatic tissue measures for identifying HS from CT attenuation correction (CTAC) scans during myocardial perfusion imaging (MPI) and evaluate their added prognostic value for all-cause mortality prediction.
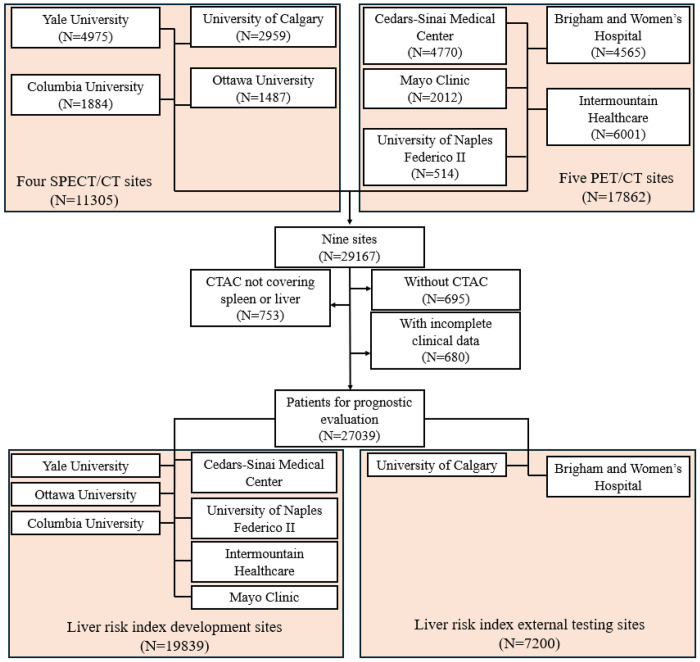
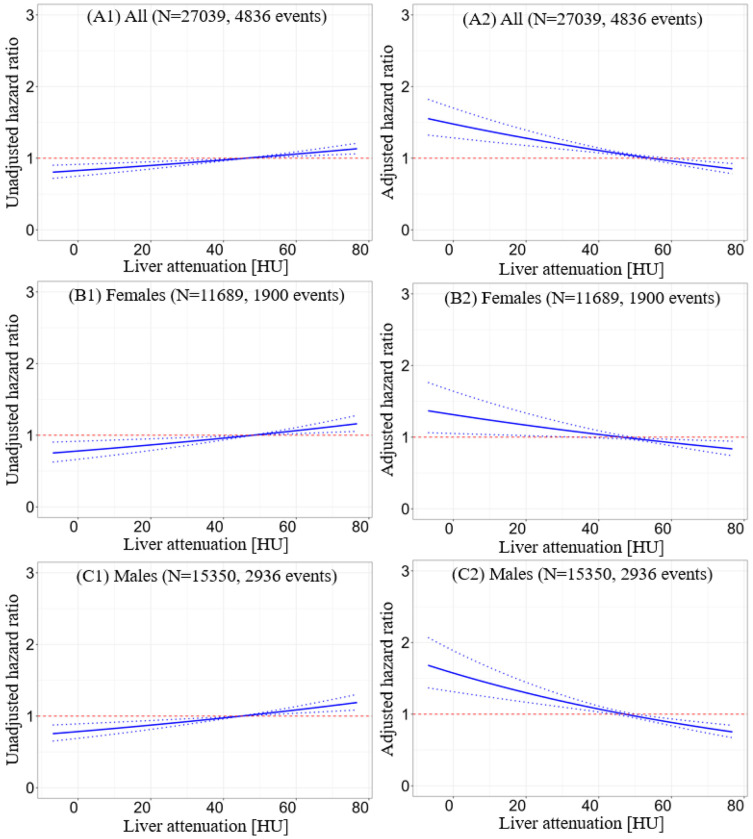
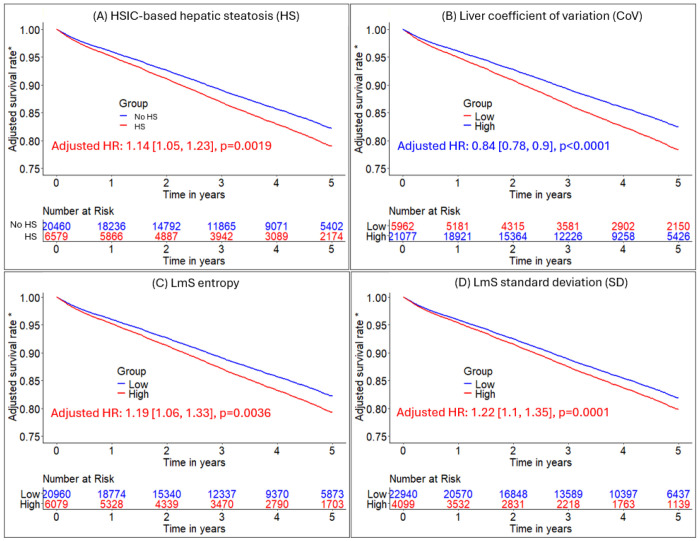
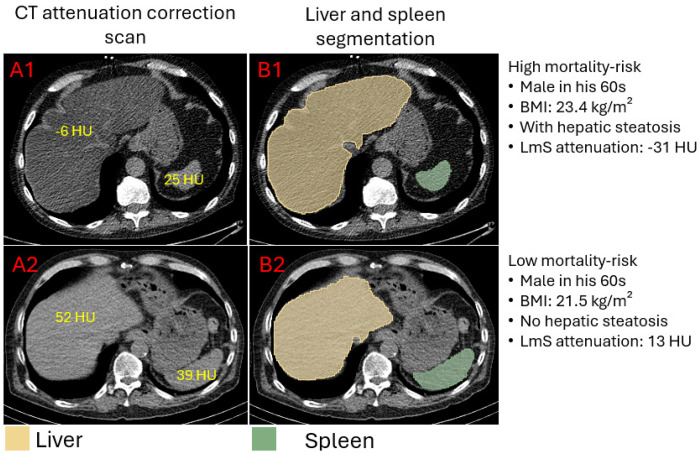
Methods: This study included 27039 consecutive patients [57% male] with MPI scans from nine sites. We used an AI model to segment liver and spleen on low dose CTAC scans and quantify the liver measures, and the difference of liver minus spleen (LmS) measures. HS was defined as mean liver attenuation < 40 Hounsfield units (HU) or LmS attenuation < -10 HU. Additionally, we used seven sites to develop an AI liver risk index (LIRI) for comprehensive hepatic assessment by integrating the hepatic measures and two external sites to validate its improved prognostic value and generalizability for all-cause mortality prediction over HS.
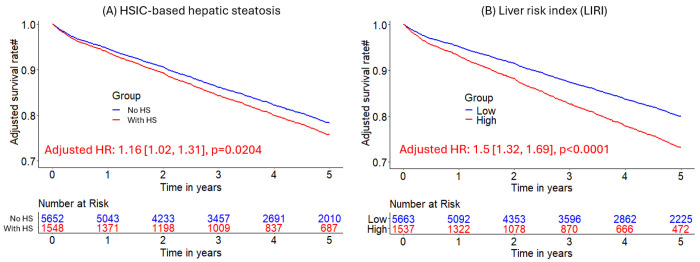
Findings: Median (interquartile range [IQR]) age was 67 [58, 75] years and body mass index (BMI) was 29.5 [25.5, 34.7] kg/m2, with diabetes in 8950 (33%) patients. The algorithm identified HS in 6579 (24%) patients. During median [IQR] follow-up of 3.58 [1.86, 5.15] years, 4836 (18%) patients died. HS was associated with increased mortality risk overall (adjusted hazard ratio (HR): 1.14 [1.05, 1.24], p=0.0016) and in subpopulations. LIRI provided higher prognostic value than HS after adjustments overall (adjusted HR 1.5 [1.32, 1.69], p<0.0001 vs HR 1.16 [1.02, 1.31], p=0.0204) and in subpopulations.
Interpretations: AI-based hepatic measures automatically identify HS from CTAC scans in patients undergoing MPI without additional radiation dose or physician interaction. Integrated liver assessment combining multiple hepatic imaging measures improved risk stratification for all-cause mortality.
Conflict of interest statement
KKP reports an institutional research grant from Jubilant DraxImage and research support from American College of Cardiology Geriatric Cardiology council. RJM has received grant funding and consulting fees from Pfizer as well as grant funding from Alberta Innovates. AMM has received consulting fees from APQ Health. TDR has received research grant support from GE Healthcare and Advanced Accelerator Applications. AJE has received a speaker’s fee from Ionetix, consulting fees from W. L. Gore & Associates and Artrya, authorship fees from Wolters Kluwer Healthcare—UpToDate, and served on scientific advisory boards for Axcellant and Canon Medical Systems USA; his institution has grants/grants pending from Alexion, Attralus, BridgeBio, Canon Medical Systems USA, GE HealthCare, Intellia Therapeutics, Ionis Pharmaceuticals, Neovasc, Pfizer, Roche Medical Systems, Synektik, and W. L. Gore & Associates. EJM has received grant support and serves as a consultant for GE Healthcare. DD, DB, and PS have equity interest in APQ Health. Inc. DB and PS participate in software royalties for QPS software at Cedars-Sinai Medical Center. DB also served as a consultant for GE Healthcare. PS has received research grant support from Siemens Medical Systems and consulting fees from Synektik S.A. The remaining authors have declared no competing interests.
Figures
Similar articles
-
AI-based volumetric six-tissue body composition quantification from CT cardiac attenuation scans for mortality prediction: a multicentre study.Lancet Digit Health. 2025 May;7(5):100862. doi: 10.1016/j.landig.2025.02.002. Epub 2025 May 16. Lancet Digit Health. 2025. PMID: 40382274 Free PMC article.
-
Effects of a gluten-reduced or gluten-free diet for the primary prevention of cardiovascular disease.Cochrane Database Syst Rev. 2022 Feb 24;2(2):CD013556. doi: 10.1002/14651858.CD013556.pub2. Cochrane Database Syst Rev. 2022. PMID: 35199850 Free PMC article.
-
Comparison of Two Modern Survival Prediction Tools, SORG-MLA and METSSS, in Patients With Symptomatic Long-bone Metastases Who Underwent Local Treatment With Surgery Followed by Radiotherapy and With Radiotherapy Alone.Clin Orthop Relat Res. 2024 Dec 1;482(12):2193-2208. doi: 10.1097/CORR.0000000000003185. Epub 2024 Jul 23. Clin Orthop Relat Res. 2024. PMID: 39051924
-
The comparative and added prognostic value of biomarkers to the Revised Cardiac Risk Index for preoperative prediction of major adverse cardiac events and all-cause mortality in patients who undergo noncardiac surgery.Cochrane Database Syst Rev. 2021 Dec 21;12(12):CD013139. doi: 10.1002/14651858.CD013139.pub2. Cochrane Database Syst Rev. 2021. PMID: 34931303 Free PMC article.
-
AI-Defined Cardiac Anatomy Improves Risk Stratification of Hybrid Perfusion Imaging.JACC Cardiovasc Imaging. 2024 Jul;17(7):780-791. doi: 10.1016/j.jcmg.2024.01.006. Epub 2024 Mar 6. JACC Cardiovasc Imaging. 2024. PMID: 38456877 Free PMC article.
References
Publication types
Grants and funding
LinkOut - more resources
Full Text Sources