[Preprint]. 2025 Jun 12:2025.06.10.25329358.
doi: 10.1101/2025.06.10.25329358.

Early Genetic Evolution of Driver Mutations in Uveal Melanoma

Affiliations

Early Genetic Evolution of Driver Mutations in Uveal Melanoma

James J Dollar et al. medRxiv. .

Abstract

Uveal melanoma (UM) is an aggressive cancer of the eye that frequently results in metastatic death. UMs are most likely to metastasize when they are small, at a time when they are difficult to distinguish from benign nevi and often observed without treatment. Unfortunately, little is known about the early genetic evolution of UM or potential biomarkers to indicate small tumors undergoing malignant transformation. Here, we performed targeted next generation sequencing for the 7 canonical UM driver mutations in 1140 primary UMs, including 131 small early-stage tumors. We found that the evolutionary burst of genetic aberrations that determines the archetypal UM subtypes and metastatic propensity has already occurred by the time most small tumors are biopsied, although a significantly larger proportion of small tumors are still evolving compared to larger tumors. We found that the 15-gene expression profile (15-GEP) support vector machine discriminant score was the best indicator of tumors in transition from low-risk Class 1 to high-risk Class 2 signature. While BAP1, SF3B1 and EIF1AX mutations were associated with poor, intermediate and good prognosis, respectively, mutation analysis was inferior to the prospectively validated 15-GEP + PRAME expression classifier for predicting metastasis-free and overall survival. These results provide a more complete picture of genetic evolution in UM, and they move us closer to a molecular definition of malignant transformation in this cancer type.

Keywords: Cancer mutations; Cancer prognosis; Choroidal melanoma; Molecular Prognostication; Prognostic biomarkers; Prospective studies; Survival analysis; Uveal melanoma.


Conflict of interest statement

COMPETING INTERESTS J.J.D, C.L.D., E.W., M.A.M., T.S.F., A.H.S., D.A.R., I.K., K.D.P., H.N., T.A.A., P.M., B.K.W., E.S., S.C.N.O., J.W., D.S.G., J.M., S.D.W., T.T., Z.M.C. and J.W.H. have acted as consultants for Castle Biosciences. K.R.C. is employed by Castle Biosciences. J.W.H. has received royalties for intellectual property related to prognostic testing in uveal melanoma that was licensed to Castle Biosciences. The remaining authors declare no competing interests. Castle Biosciences played no role in the conceptualization, design, data analysis, decision to publish, or preparation of the manuscript; they only contributed to data collection by depositing deidentified genetic data into an encrypted REDCap database without access to patient data.

Figures
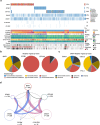
Fig. 1|
Fig. 1|. Genetic landscape of uveal melanomas.
a, Oncoprint of 1140 primary uveal melanomas, demonstrating the 7 canonical uveal melanoma associated mutations (UMAMs), along with 15-GEP status, PRAME status, tumor thickness (millimeters), tumor diameter (millimeters), gender, metastatic status (yes or no), and survival status (alive or dead). b-c, Pie charts summarizing variant types for BAP1, SF3B1, and EIF1AX mutations b, for all samples with at least one mutation (n=836) and c, for BAP1 mutations in Class 1 (n=25) and Class 2 tumors (n=339). Significance was calculated by two-tailed Fisher’s exact test. d, Connectivity plot indicating co-occurring mutations, with connector color representing Gq mutation (blue, GNAQ; mauve, GNA11; purple, PLCB4; yellow, CYSLTR2), and connector thickness corresponding to the number of cases. Dashed lines indicate < 2 cases. Diam, tumor diameter; Thick, tumor thickness. CB, ciliary body. D-score, 15-GEP support vector machine discriminant score. Variant types described in Materials and Methods.
Fig. 2|
Fig. 2|. Comparison of cancer cell fraction and 15-GEP discriminant score in small versus larger uveal melanomas.
a, Scatter plot displaying the distribution of tumor thickness and diameter for 131 small tumors (yellow dots) versus 1009 larger tumors (green dots). b, Raincloud plot of TP-corrected VAF for each BSE mutation in small versus larger tumors. c, Raincloud plot of cancer cell fraction (CCF) for each BSE mutation in small versus larger tumors. d, Box plot comparing the 15-GEP discriminant score for small tumors (yellow boxes) versus larger tumors (green boxes), comparing Class 1, Class 2 and all tumors. Continuous variables were compared by two-tailed Wilcoxon rank-sum test. BSE, mutation in BAP1, SF3B1 or EIF1AX; CCFBSE, cancer cell fraction for each BSE mutation; TP, tumor purity; VAF, variant allele frequency; mm, millimeter.
Fig. 3|
Fig. 3|. Insights into early genetic evolution from 15-GEP discriminant score and BSE cancer cell fraction.
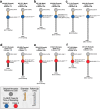
a, Typical Class 1 tumors with high discriminant scores: Case #003-025, near-clonal SF3B1 mutation; Case #007-071, sub-clonal EIF1AX mutation. b, Discordant Class 1 tumors with high discriminant scores: Case #027-106, near-clonal EIF1AX mutation and subclonal BAP1 mutation; Case #026-504, clonal BAP1 and SF3B1 mutations and partial LOH3p involving a limited region around the BAP1 locus. c, Discordant Class 1 tumors with low discriminant scores: Case #017-119, clonal SF3B1 mutation and LOH3p; Case #028-183, near-clonal BAP1 mutation, LOH3p and very low discriminant score (0.02). d, Class 2 tumors with high discriminant scores and bi-allelic BAP1 loss: Case #021-013, sub-clonal BAP1 mutation; Case 023-059, near-clonal EIF1AX mutation and subclonal BAP1 mutation. e, Class 2 tumors with intermediate discriminant scores: Case #026-435, near-clonal SF3B1 mutation and LOH3p but no detectable BAP1 mutation; Case #019-019, sub-clonal BAP1 mutation and no detectable LOH3p. f, Class 2 tumors with low discriminant scores: Case #017-035, near-clonal EIF1AX and BAP1 mutations with LOH3p; Case #021-116, near-clonal BAP1 mutation with no detectable LOH3p. The length of the connector between the ancestor melanoma cell and the melanoma is proportional to tumor diameter (in millimeters) at the time of tumor sampling. The length of the extension beyond the melanoma is proportional to time to death or last follow-up (in months) with final status indicated. ANM, alive no metastasis; DOM, dead of metastasis; D-score, support vector machine discriminant score; LOH3p, loss of heterozygosity of chromosome 3; (-), PRAME negative; (+), PRAME positive. Mutation nomenclature described in Material and Methods.
Fig. 4|
Fig. 4|. Features of BAP1 mutations by 15-GEP Class status.
a, Raincloud plot depicting tumor diameter in relation to 15-GEP Class and BAP1 mutation status (n=1140). b, Raincloud plot depicting tumor thickness in relation to 15-GEP Class and BAP1 mutation status (n=1140). c, Box plot comparing raw discriminant scores by 15-GEP Class and BAP1 allelic “dosage” reflected in BAP1 mutation and LOH3p status (n=905). d-e, Survival analysis plots displaying the d, metastasis-free survival and e, overall survival probabilities for Class 1 (n=715) and Class 2 (n=418) UM according to absolute discriminant score at specified time points ranging from 12 to 60 months. Significance for continuous variables was determined by two-tailed Wilcoxon rank-sum test. Significance for survival analysis was calculated by Cox proportional hazard analysis.
Fig. 5|
Fig. 5|. Hypothesis for relationship between BAP1 dosage, tumor immune microenvironment, and discriminant score.
BAP1 dosage decreases as BAP1-deficient tumor cells outcompete BAP1-wildtype tumor cells, leading to altered composition of infiltrating immune cells in the tumor immune microenvironment (TIM). Since the 15-GEP includes genes expressed in tumor cells, immune cells or both, inversion of the SVM discriminant score from the Class 1 side to the Class 2 side of decision boundary occurs progressively as the transcriptional effects of BAP1 loss accrue in both tumor and immune cells. This would explain why there is not a strict association between the fraction of cancer cells harboring mutant BAP1 (CCFBAP1) and the discriminant score, as the rate at which the TIM changes following BAP1 loss may differ between individuals. This would also explain why transitional tumors with low discriminant score tend to be small, whereas larger tumors which have had longer for these transcriptional changes to occur tend to have high discriminant scores.

References

    1. Carvajal R. D. et al. Advances in the clinical management of uveal melanoma. Nat Rev Clin Oncol 20, 99–115 (2023). 10.1038/s41571-022-00714-1 - DOI - PubMed
    1. Onken M. D., Worley L. A., Ehlers J. P. & Harbour J. W. Gene expression profiling in uveal melanoma reveals two molecular classes and predicts metastatic death. Cancer Res 64, 7205–7209 (2004). - PMC - PubMed
    1. Field M. G. et al. PRAME as an independent biomarker for metastasis in uveal melanoma. Clin Cancer Res 22, 1234–1242 (2016). 10.1158/1078-0432.ccr-15-2071 - DOI - PMC - PubMed
    1. Field M. G. et al. Epigenetic reprogramming and aberrant expression of PRAME are associated with increased metastatic risk in Class 1 and Class 2 uveal melanomas. Oncotarget 7, 59209–59219 (2016). 10.18632/oncotarget.10962 - DOI - PMC - PubMed
    1. Cai L. et al. Gene Expression Profiling and PRAME Status Versus Tumor-Node-Metastasis Staging for Prognostication in Uveal Melanoma. Am J Ophthalmol 195, 154–160 (2018). 10.1016/j.ajo.2018.07.045 - DOI - PMC - PubMed

Publication types

LinkOut - more resources