[Preprint]. 2025 Jun 17:2025.06.16.25329673.
doi: 10.1101/2025.06.16.25329673.

FUS Mislocalization Rewires a Cortical Gene Network to Drive Cognitive and Behavioral Impairment in ALS

Affiliations

FUS Mislocalization Rewires a Cortical Gene Network to Drive Cognitive and Behavioral Impairment in ALS

Raphaelle Cassel et al. medRxiv. .

Abstract

Cognitive and behavioral impairment affects up to half of individuals with amyotrophic lateral sclerosis (ALS), but their molecular origin remains unresolved. Here, we identify mislocalization of the RNA-binding protein FUS in cortical neurons as a defining feature in ALS patients with cognitive impairment (ALS-ci). Selective mislocalization of FUS in adult cortical projection neurons in mice is sufficient to trigger ALS-ci- and ALS with behavioral impairment (ALS-bi)-like phenotypes, including deficits in sociability, and neurodegeneration. Single-nucleus transcriptomics reveal a conserved FUS-dependent gene network downregulated in these mice and ALS-ci patients. This regulon is enriched for ALS genetic risk factors and newly implicates FBXO16 in ALS-bi. Carriers of protein-truncating FBXO16 variants display behavioral abnormalities, frontotemporal atrophy, and increased levels of dementia-linked biomarkers. These findings define a neuron-intrinsic mechanism for cognitive and behavioral dysfunction in ALS and nominate FUS mislocalization and its downstream gene network as therapeutic targets.

Keywords: Amyotrophic lateral sclerosis; behavioral impairment; cognitive impairment; fronto-temporal dementia; genetics; mouse models; single cell biology.


Conflict of interest statement

Declaration of interests BJT has a patent pending (U.S. Patent Application No. 63/717,807) on the diagnostic testing for ALS based on a proteomic panel. BJT holds patents on the clinical testing and therapeutic intervention for the hexanucleotide repeat expansion ofC9orf72. BJT receives research support from Cerevel Therapeutics.

Figures
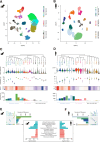
Figure 1:
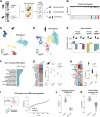
Figure 1:. Cross-species transcriptomic analysis identifies FUS-related signature in vulnerable ALS neurons
A. UMAP plot of the 78,514 cells split across 21 clusters identified in the frontal cortex of FusΔNLS/+ mice B. UMAP plot of the 156,545 cells split across 19 clusters in the human M1 motor cortex. C. Cluster dendrogram, violin plots heatmaps and histogram plot shows number of genes detected, percent of each class (Glutamategic, GABAergic and non-neurons), transcriptome-wide shift from controls in FusΔNLS/+ mice and number of DE genes in each cell subclass. D. Cluster dendrogram, violin plots, heatmap and histogram bar plot shows number of genes detected, percent of each class (Glutamategic, GABAergic and non-neurons), transcriptome-wide shift of ALS patients compared to healthy donors and number of DE genes in each cell subclass. E-F: Intersect plots show the number of DE genes in each excitatory subclass and overlap used to perform gene ontology analysis in mice and human. Histogram bar plot shows gene ontology terms enriched in all excitatory neurons of ALS patients and FusΔNLS/+ mice.
Figure 2:
Figure 2:. Cell-type specific gene module analysis identifies conserved regulatory networks associated with FUS, and shared with TDP-43.
A. Experimental design of the gene network analysis in FusΔNLS/+ mice and ALS patients. B. Cluster dendrogam showing the gene modules identified in human ALS patients and FusΔNLS/+ mice. C-D. UMAP gene network of the selected modules, each dot represents individual gene which size is proportional to its importance (signed kME). The FUS regulon displays a high degree of co-expression in mice which is conserved in ALS patients. E. Bar graphs showing correlation of each module to ALS phenotype and directionality in mice and human. Dashed lines highlight correlation with FDR<0.05 (Benjamini-Hochberg correction). F. Histogram bar graphs show GO enrichment of the FUS regulon. Dashed lines highlight GO term with FDR<0.05 (Benjamini-Hochberg correction). G. Heatmap shows eigengene of the FUS regulon across all cell types in FusΔNLS/+ mice. Wilcoxon rank-sum test with Bonferroni correction *p< 0.05/19 (number of cell types). Dot plot shows FUS regulon eigengene in L5-IT neurons of FusΔNLS/+ mice (Wilcoxon rank-sum test with Bonferroni correction *p=0.00024) H. Heatmap shows FUS regulon eigengene across all cell types in ALS patients. Wilcoxon rank-sum test with Bonferroni correction *p< 0.05/21(number of cell types). Dot plot shows eigengenes expression in L5-PT neurons of FusΔNLS/+ mice (Wilcoxon rank-sum test with Bonferroni correction p=0.040) I. Eigengenes expression of the FUS regulon upon downregulation of 217 different RNA-binding proteins and ranked according to effect sizes. J. Violin plot showing FUS regulon eigengene expression in iPSC-derived motoneurons treated with TDP43 shRNA (one-way ANOVA: Fgroup=31.39, **p=0.0025). K. Violin plot showing FUS regulon eigengene expression in TDP43 nuclei from FTLD patients (one-way ANOVA: Fgroup=21.14, ***p=0.000613).
Figure 3:
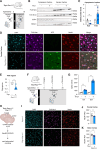
Figure 3:. molecular, histological and electrophysiological consequences of adult mislocalization of FUS in cortical projection neurons.
A. Scheme of the experimental design. Cortical projection neurons show normal nuclear FUS until tamoxifen administration (TM) at 6 weeks of age. After this age, FUS is permanently mislocalized in the cytoplasm of these neurons, but not in other cell types. B. Representative immunoblot analysis of FUS protein extracted from the frontal cortex, predicted molecular weights (MW) in kilodalton (kDa) are shown on the left. SOD1, mostly found in the cytoplasm, and HDAC1 exclusively found in the nucleus, were used as control of the purity of extracts. Two antibodies for FUS, targeting either the N-terminal part of FUS or the NLS (in C-terminal) were used. C. Quantification of FUS immunoreactive bands in cytoplasmic fractions relative to control mice (two-tailed Mann-Whitney test: *p=0.0127 and **p=0.0013). D. Representative widefield images of the immunofluorescent staining of cortical neurons in the frontal cortex of 4-month-old mice. GFP and NeuN staining was used to identify neurons (NeuN) recombined (GFP). The FUS antibody used here targets the N-terminal part of FUS, we observed a clear FUS cytoplasmic mislocalization in cortical neurons of Thy1CRE-ERT2/ Fusexon15 mice. E. FUS regulon eigengene expression in prefrontal cortex of Thy1CRE-ERT2/ Fusexon15 and control mice 3 months after TM (two-tailed t-test: T=−3.6, *p=0.013. F. Scheme of the experimental design for ECoG recording. G. Assessment of spikes events (defined as an event higher than a window discriminator of 4 times the baseline standard deviation calculated from control mice) at 12 and 20-weeks of age in Thy1CRE-ERT2/ Fusexon15 and control mice. Thy1CRE-ERT2/ Fusexon15 mice show a number of events two times greater than control mice at 12 weeks (two-tailed Mann-Whitney test; **p=0.0079), and five times greater at 20 weeks two-tailed Mann-Whitney test; **p=0.0079). Cortical activity alteration in transgenic mice significantly increases over time (two-way ANOVA: Ftime =146.7, p<0.0001) depending on the genotype (two-way ANOVA: Fgenotype =455.4, p<0.0001). H-K. Neurodegeneration characterization. H. 10 slices per mouse in the frontal cortex or in the motor cortex were selected for counting. I. Representative widefield images of the immunofluorescent staining of cortical neurons in the frontal cortex of 4-month-old mice. NeuN staining was used to identify and count neurons in the upper layers (mainly layer 2–3 and 5). J. We highlighted a significant decrease in the number of neurons in the frontal cortex of the transgenic mice (nested t-test: ** p=0.0086) and K. in the motor cortex of those (nested t-test: **p=0.0242). Results are expressed as mean ± SEM, control mice are represented in black and Thy1CRE-ERT2/ Fusexon15 in blue. C. Study of FUS mislocalization, n = 6 for control mice and n = 8 for Thy1CRE-ERT2/ Fusexon15. E. Study of FUS regulon. n = 5 for control mice and n = 5 Thy1CRE-ERT2/ Fusexon15 mice (t-test: *p=0.013). F. Study of cortical activity, n = 5 for control mice and n = 5 Thy1CRE-ERT2/ Fusexon15 mice. I-K. Study of neurodegeneration, n = 5 for control mice and n = 4 Thy1CRE-ERT2/ Fusexon15 mice.
Figure 4:
Figure 4:. FUS mislocalization in adult neurons leads to ALS-related behavioral and cognitive impairment.
A. Scheme of the experimental design. B-C. Nesting abilities assessment of Thy1CRE-ERT2/ Fusexon15 and control mice. B. Score attributed to the nests built in a 24hours period starting with 3 g of pressed cotton pieces. We observed that transgenic mice construct nest that are less complicated that the one performed by control mice (two-tailed Mann-Whitney test: *p=0.030). C. Mass of pressed cotton pieces which were found untorn after 24h. The mass of untorn cotton pieces was significantly higher for Thy1CRE-ERT2/ Fusexon15 than for control mice (two-tailed Mann-Whitney test: *p=0.045), highlighting difficulties to plan and/or execute the successive steps involved in nesting. D-F Sociability and social memory assessed using 3 chamber test. D During the first 3 trials, we measured the time spent contacting an empty cage or a cage with a mouse (mouse) while during the fourth trial, an unknown mouse is introduced (novel mouse) and allowed to assess the innate attractivity of mouse for novelty. Three-way ANOVA analysis showed a decrease of interest over time (Ftime =8.217, p=0.0008), a higher interest for the mouse than the empty box (Fboxes =157.6, #p<0.0001) and a difference between genotype (Fgenotype =4.075, *p=0.0488). E. Social memory evaluation by presenting a mouse already met (during trial 1–3, i.e. Known mouse) and a novel mouse. The contacting time of Thy1CRE-ERT2/ Fusexon15 mice with novel mice was significantly lower compared to those of control mice (two-way ANOVA: Fgenotype=14.39, ***p=0.0006). Šídák’s multiple comparisons test indicated significant higher exploration of novel mice in comparison to the known one in control mice (### p<0.0001). This is not the case for Thy1CRE-ERT2/ Fusexon15 mice (p=0.8783). F. The recognition index, computed as the contacting time with novel mouse divided by the total contacting time, was significantly decreased compared to those of control mice (two-tailed Mann-Whitney test: *p=0.035). When we compared this recognition index to chance level (placed at 50 and indicated by the horizontal dotted line), we observed that only control mice presented an index higher than chance level (one sample t-test: control mice $p<0.0001 and Thy1CRE-ERT2/ Fusexon15, p=0.2233). G-H. Social alteration assessed in another paradigm, resident intruder test. We placed in the tested mouse cage an intruder and assess for 5 min the total contacting time (G) and the total number of contact (H). We confirmed the social alteration observed in Thy1CRE-ERT2/ Fusexon15 as they spent less time contacting the intruder than the control mice (two-tailed Mann-Whitney test: *p=0.0317) and showed a lower number of total interactions (two-tailed Mann-Whitney test: **p=0.0011). I-J. Short-term (10 min) and long term (24hours) object recognition memory. I. We did not observe any short-term object memory alteration (two-tailed Mann-Whitney test: p=0.662). Both groups spent more time than chance level (indicated by the horizontal dotted line) exploring the novel object (one sample t-test: $p=0.011 for control mice and $ $p=0.0058 for Thy1CRE-ERT2/ Fusexon15 mice). J. Long-term (10 min) object recognition memory is not affected either (two-tailed Mann-Whitney test: p=0.345). Both groups spend more time than chance level exploring the new object ($p=0.016 for control mice and $ $ $p=0.0005 for Thy1CRE-ERT2/ Fusexon15 mice). Results are expressed as mean ± SEM, control mice are represented in black and Thy1CRE-ERT2/ Fusexon15 in blue. D-F. Study of 3 sociability in 3 chamber test, n = 9 for control mice and n= 10 for Thy1CRE-ERT2/ Fusexon15 mice. G-H Study of sociability in resident intruder test, n= 12 control mice and n = 11 for Thy1CRE-ERT2/ Fusexon15 mice. I-J Study of object recognition, n = 6 control mice and n = 8 for Thy1CRE-ERT2/ Fusexon15 mice.
Figure 5:
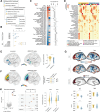
Figure 5:. FUS mislocalization and downregulation of FUS regulon in vulnerable neurons of patients with ALS and cognitive impairment
A. Representative photomicrographs of C9ORF72 human post-mortem tissue taken at 10x (top panel) and 40x magnification with optical zoom (middle and lower panels) demonstrating DAB immunohistochemical staining for FUS protein in BA39 (language brain region). These cases had undergone ECAS testing during life, evaluating language function of this brain region, and based on clinically approved cut offs cases were classified as affected (ECAS score < or = 26) or unaffected (ECAS score > 26). Black arrowheads indicate nuclear pathology, and white arrowheads indicate cytoplasmic pathology within layers III and V of the cortex. B-C. Cell counts were performed by counting the number of cells affected by cytoplasmic pathology (B) or nuclear pathology (C) in 10 randomly assigned regions of interest (1.5 mm2) in three cases for each group. Cell counts were performed by a pathologist who was blinded to case and demographic data. ALS cases with normal language function are plotted in yellow and with language dysfunction plotted in red. Each case is plotted demonstrating the variability between and within cases. D. Heatmap showing cell-type specific expression of L5-ET marker genes in 9 excitatory neuron subclasses spanning four different tissues (BA4,BA9,BA44 and BA46). E. Uniform manifold approximation and projection (UMAP) UMAP plot projecting gene expression from 287,275 excitatory neurons colored by subclasses and density plot showing the expression profile of L5-ET top marker genes (ADRA1A,POU3F1,VAT1L and SULF2) in L5-ET subgroups and L5-ET subtypes top marker genes (NETO1, SERPINE2, THSD4 and GRIN3A) F. UMAP plot colored by sampled tissue show selective regional presence of L5-ET subgroups across motor areas (BA4) and prefrontal area of the cortex (BA9, BA44, BA46). E. UMAP plot split according to diagnosis show a reduction in L5-ET neurons. H. Bar plot showing proportion of each excitatory neurons subclass sampled across all donors and showing a reduction in L5-ET neurons in ALSci patients compared to ALS and HC (inset on the right). The lower panel shows results of a permutation-based test identifying L5-ET neurons as significantly depleted in ALSci patients (FDR<0.05 & log2 Fold difference <−0.58). I. Heatmap displays FUS regulon expression across major subclasses of excitatory neurons in controls (HC), ALS and ALSci patients. A significant decrease is observed in L5-ET neurons in ALSci compared to controls (Wilcoxon rank sum test Bonferroni adjusted **p=0.007) and in ALS compared to ALSci patients (Wilcoxon rank sum test Bonferroni adjusted **p=0.044). *Adjusted-p <0.05 vs HC, # Adjusted-p <0.05 vs ALS. The violin plot on the right shows FUS regulon expression difference in L5-ET neurons of ALSci compared to controls (Wilcoxon rank sum test Bonferroni adjusted **p=0.002) and ALS (Wilcoxon rank sum test Bonferroni adjusted *p=0.029) but not between ALS and HC (Wilcoxon rank sum test Bonferroni adjusted p=0.051). J. Unsupervised clustering of ALS donors (n=36) screened for cognitive impairment shows a clear separation between ALS patients (n=22) and ALSci patients (n=14) and heterogeneity in clinical scores. Heatmap displays clinical score across 4 ECAS domains that are ALS specific (Executive,Language and Verbal Fluency) and non-specific (Memory). Overlay heatmaps show FUS regulon expression across donors, TDP43 burden, disease duration and genetic burden of rare and common variants associated with neurodegenerative disease-associated dementia. K. Scatter plot shows FUS regulon expression correlation with clinical ALS specific score (R2=0.32,p=0.051) and ECAS total score (R2=0.326,*p=0.048). L. Corrplot displays strong correlation across clinical subscore across individuals and a significant correlation of the FUS regulon expression with executive function in BA46 (R2=0.60,*p=0.017) but not with language in BA44 (R2=0.37,p=0.26) illustrated in scatter plots on the right. M. Strategy to relate genetic burden of dementia to FUS regulon expression and cognitive impairment. N. Violin plot shows a significant reduction of the ECAS total score in ALS patient with high genetic burden (>=2 screened missense variants per patient) vs low (< 2 screened missense variants per patient) (Wilcoxon rank sum test *p=0.034). O. Dot plots across patients colored by diagnosis shows an increase burden of the number of genetic variation observed per individual in known genes and its association with clinical subscores. P. Scatter plot shows FUS regulon expression inverse correlation with genetic burden across donor (R2=−0.39,*p=0.034).
Figure 6:
Figure 6:. FUS regulon is enriched in ALS/FTD heritability and prioritizes FBXO16 as a novel risk factor for ALS associated with behavioral impairment.
A. Strategy to characterize heritability through integration of GWAS with the FUS regulon. Each gene in the FUS regulon was mapped to the associated TSS and/or enhancer through single nuclei ATACseq (snATACseq) and linkage disequilibrium score regression computed as described previously B. Dots indicate enrichment and 95% confidence interval computed from LD-score regression. Two-sided p-values were derived from linear regression in LDSC analysis. * Indicates significance after Bonferroni correction p<0.05/12. Results indicate enrichment for ALS-GWAS *p=1.07.10−24 and the FUS regulon *p=1.3.10−9 in ALS heritability but no significant enrichment for randomly samples set of genes (p>0.05). C. Genetic risk factors for ALS, ALS-FTD and FTD were overlapped with the FUS regulon. Venn diagram show overlap between each group with a significant overlap between ALS-FTD gene and FUS regulon (Fisher’s exact test p=2.2.10−06) but not with ALS only (Fisher’s exact test p=0.054) or FTD only (Fisher’s exact test p=0.33). D. Strategy to perform GWAS of ALS associated with cognitive (ALS-ci) or behavioral impairment (ALS-bi). Whole genomic sequencing from ALS patients were filtered for SNPs with minor allele frequency above 5% (MAF > 0.05). WGS were then filtered based on gene overlap with FUS regulon genes leading to 131,202 SNPs used for GWAS. E. Quantile–Quantile plot depicting on x-axis the −log10 of expected p value versus the actually measured p values from generalized logistic regression for 131,202 SNPs association with ALS-ci. Genome-wide correction for multiple testing was set at P < 1 × 10⁻⁶. Highlighted SNP in red reaches genome-wide significant (p=5.44.10−07) and is located in the FBXO16 gene. F. Quantile–Quantile plot depicting on x-axis the −log 10 of expected p value versus the actually measured p values from generalized logistic regression for 131,202 SNPs association with ALS-bi. Genome-wide correction for multiple testing was set at P < 1 × 10⁻⁶. Highlighted SNP in red reaches suggestive significance (p=5.08.10−05) and located in WWOX gene. G. Forest plot display per-GWAS association of rs11991627 (FBXO16) and rs12324967 (WWOX) in ALS-ci and ALS-bi. Odds ratio (OR) values and 95% CI for each cohort are depicted in different color. The graphs display the means and 95% confidence interval. H. Locus zoom plot showing the SNP (+/− 500KB) rs11991627 (FBXO16) association with ALS-bi. Red dashed lines show the genome-wide significant SNP at a p-value < 6.10−07 and colored dots represent LD with the lead variant (red diamond). I. Violin plots shows behavioral score in rs11991627 carriers of homozygous reference allele (n=139) compared to heterozygous carriers (n=104) (One-way ANOVA Fgenotype=14.26, p=1.31.10−06, Tukey’s post-hoc **p=2.58.10−03) and to homozygous carriers (n=25) (Tukey’s post-hoc ****p=5.67.10−06).
Figure 7:
Figure 7:. FBXO16 PTV carriers have behavioral deficits associated with fronto-temporal atrophy and increase plasmatic expression of NEFL and GFAP.
A Strategy to characterize FBXO16 PTV carriers in the UK Biobank, and numbers of individuals included. FBXO16 PTV carriers (n=231) were screened for symptoms associated with cognitive or behavioral deficits among 460,312 individuals of European ancestry. We then evaluated alteration of the brain structure using diffusion and T1 structural MRI from FBXO16 PTV carriers (n=13) and 37,817 non-carriers controls individuals. Finally, we have used large-scale proteomics data from the UK-Biobank to test whether FBXO16 PTV carriers (n=14) show significant alteration in major biomarkers when compared to age and sex-matched controls (n=21,604). Levels of different proteins were compared to incident diseased cases diagnosed with Alzheimer’s dementia (n=642), ALS (n=198), FTD (n=70) and Vascular dementia (n=161). B. Logistic regression analysis testing whether FBXO16 PTV carriers’ status predict UK-Biobank associated symptoms and signs involving cognition, perception, emotional states and behavior. Forest plot shows significant association of FBXO16 genotype with R45 category (Logistic regression Beta coefficient = 1.22; (0.81–1.64), *p=0.0030). *Significance is set at p-values < 0.05 / 6. A significant association is observed between FBXO16 genotype and two R45 subcategory which are hostility (Beta coefficient = 2.92, (1.91–3.92), *p=0.0037) and nervousness (Beta coefficient = 2.76, (1.75–3.77), *p=0.006) and a suggestive association with apathic behavior (Beta coefficient = 0.80, (0.46–1.14), p=0.018). *Significance is set at Bonferroni corrected p-value < 0.05 / 6 = 0.008. C. Heatmap depicts −log10(p) obtained from generalized linear model testing whether FBXO16 genotype is a predictor of IDPs obtained from diffusion MRI imaging of FBXO16 carriers (n=13) and non-carriers (n=37,817). GLM p-values are depicted for the fractional anisotropy and axial diffusivity for both hemispheres and each of the white matter tracts. A significant association is observed between FBXO16 genotype and a decrease FA of the genu of the corpus callosum (Beta = −0.03 (−0.048,−0.012),* adjusted-p =0.041) and a decrease AD of the left uncinate fasciculus (Beta coefficient = −6.17.10−05 (−9.53.10−05, −2.8.10−05), *adjusted-p=0.337). D-F. Heatmap shows the percentage of each of the 31 structures from the Desikan-Killiany cortical parcellation atlas which is connected to the nine major white matter tracts in FBXO16 PTV carriers and non-carriers. We observe a decrease in the percentage of the structure connected through the left uncinate fasciculus to the pars orbitalis (BA47), the pars-triangularis (BA45) and the rostral-middle frontal (BA46). Dashed rectangles. The number of tracts from the left uncinate fasciculus connecting to BA47, BA45 and BA46 is significantly decreased in FBXO16 carriers compared to non-carriers (unpaired t-test: t=2.16, *p=0.045). Also, we observed a lower proportion of highly connected tracts of the uncinate fasciculus to BA44, BA45, and BA47 in FBXO16 PTV carriers when compared to non-carriers (Fischer’s exact test: X-squared = 4.576, df = 1, *p = 0.032). G. Illustration shows the Z-score differential gray matter area and volume. Unbiased brain-wide cluster correlation analysis reveals a significant decrease in left gray matter area located on the frontal region in the pars triangularis (BA45) and the rostral medial frontal region (BA46). Region-of-interest reveals a significant decrease in the left pars triangularis gray matter area (unpaired-t test: t=3.24, **p=0.0047) and volume (unpaired-t test: t=3.33, **p=0.0036). H. Volcano plot shows a significant association between increase GFAP (Beta coefficient = 0.332, adjusted-p=3.25.10−05) and NEFL (Beta coefficient = 0.337, adjusted-p=1.96.10−06) protein levels in the plasma with incidence of FTD. Forest plot display association between GFAP and NEFL levels with dementia subtypes which significant for Alzheimer’s disease (GFAP-Beta coefficient = 0.29 , ***p=3.38.10−49; NEFL- Beta coefficient = 0.17 , ***p=1.08.10−23), vascular dementia (GFAP-Beta coefficient = 0.22 , ***p=5.45.10−06; NEFL- Beta coefficient = 0.16 , ***p=8.32.10−04). Only a significant association of NEFL with ALS (NEFL- Beta coefficient = 0.14, **p=3.17.10−03) but not with GFAP (NEFL- Beta coefficient = −0.003, p=0.92) In FBXO16 carriers a significant association is observed for NEFL (NEFL- Beta coefficient = 0.27, **p=0.0047) and trend for GFAP (GFAP- Beta coefficient = 0.19, p=0.085). Violin plot show a significant increase in mean GFAP protein expression (D-cohen = 0.47; one-tailed *permuted-p = 0.027) and NEFL (D-cohen = 0.67; one-tailed **permuted-p = 0.0023) in FBXO16 PTV carriers.

References

    1. Abrahams S. (2023). Neuropsychological impairment in amyotrophic lateral sclerosis-frontotemporal spectrum disorder. Nat Rev Neurol 19, 655–667. - PubMed
    1. Aguzzoli C.S., Battista P., Hadad R., Ferreira Felloni Borges Y., Schilling L.P., and Miller B.L. (2022). Very early-onset behavioral variant frontotemporal dementia in a patient with a variant of uncertain significance of a FUS gene mutation. Neurocase 28, 403–409. - PubMed
    1. Bakken T.E., Jorstad N.L., Hu Q., Lake B.B., Tian W., Kalmbach B.E., Crow M., Hodge R.D., Krienen F.M., Sorensen S.A., et al. (2021). Comparative cellular analysis of motor cortex in human, marmoset and mouse. Nature 598, 111–119. - PMC - PubMed
    1. Bampton A., McHutchison C., Talbot K., Benatar M., Thompson A.G., and Turner M.R. (2024). The Basis of Cognitive and Behavioral Dysfunction in Amyotrophic Lateral Sclerosis. Brain Behav 14, e70115. - PMC - PubMed
    1. Baxi E.G., Thompson T., Li J., Kaye J.A., Lim R.G., Wu J., Ramamoorthy D., Lima L., Vaibhav V., Matlock A., et al. (2022). Answer ALS, a large-scale resource for sporadic and familial ALS combining clinical and multi-omics data from induced pluripotent cell lines. Nat Neurosci 25, 226–237. - PMC - PubMed

Publication types

LinkOut - more resources