[Preprint]. 2025 Jun 11:rs.3.rs-6797967.
doi: 10.21203/rs.3.rs-6797967/v1.

Single-cell transcriptomics reveal differences between chorionic and basal plate cytotrophoblasts and trophoblast stem cells

Affiliations

Single-cell transcriptomics reveal differences between chorionic and basal plate cytotrophoblasts and trophoblast stem cells

Robert Morey et al. Res Sq. .

Abstract

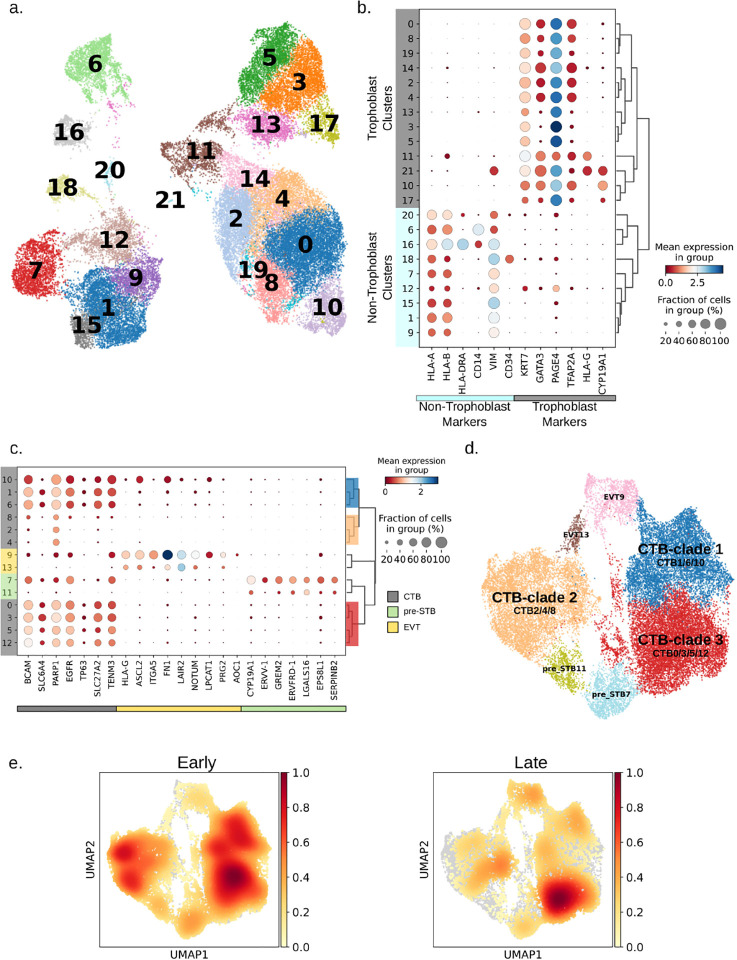
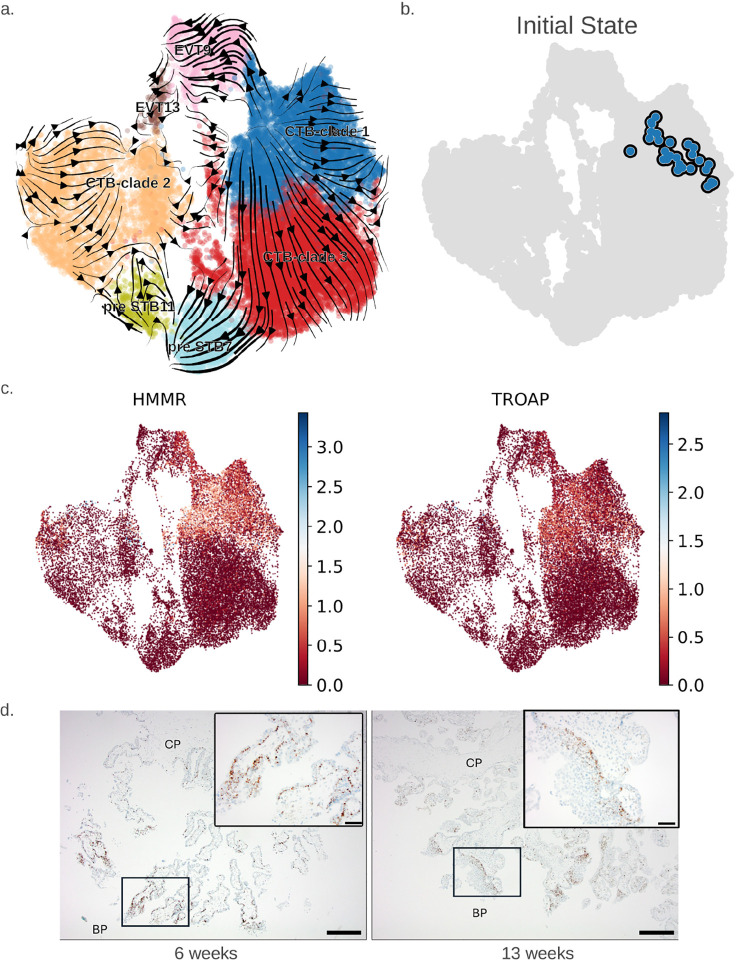
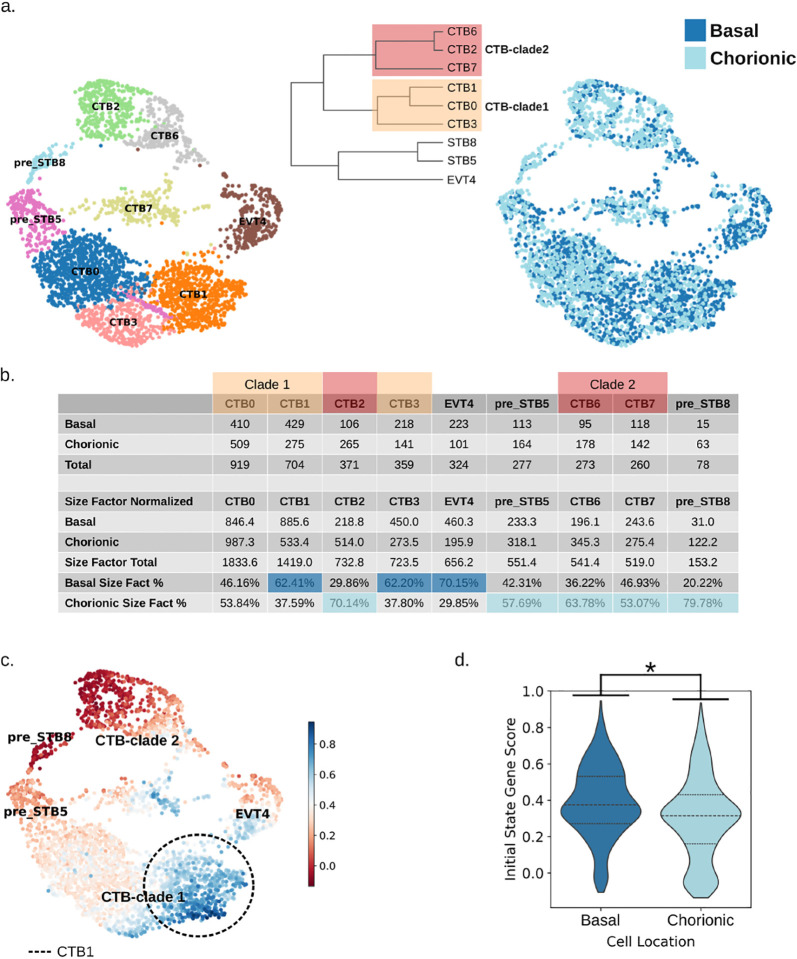
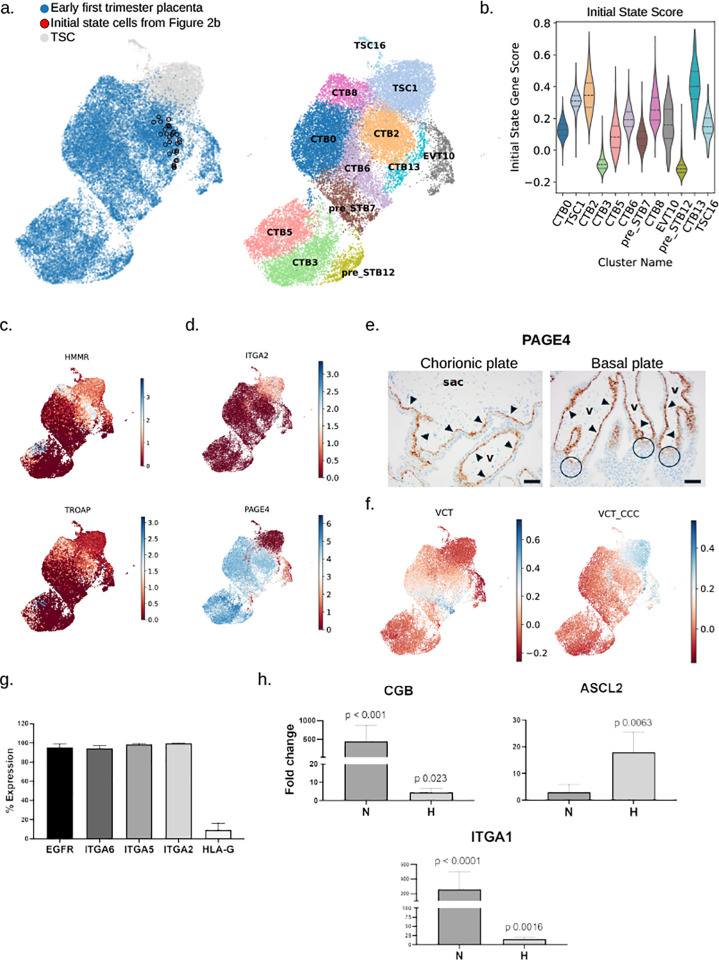
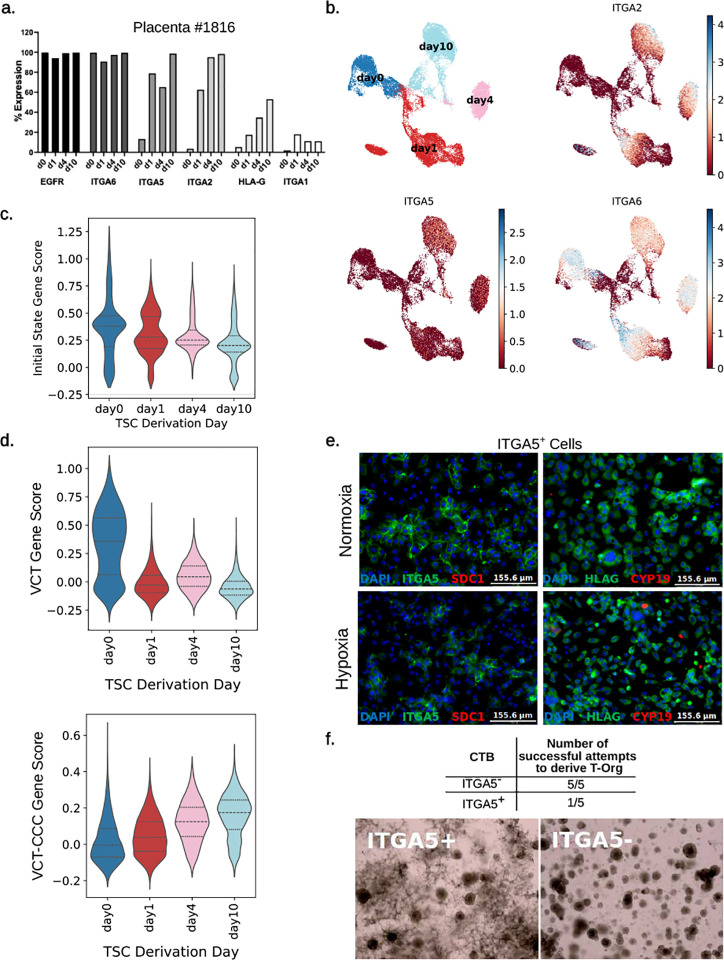
Cytotrophoblast (CTB) of the early gestation human placenta are bipotent progenitor epithelial cells, which can differentiate into invasive extravillous trophoblast (EVT) and multinucleated syncytiotrophoblast (STB). Trophoblast stem cells (TSC), derived from early first trimester placentae, have also been shown to be bipotential; however, their cell-of-origin has not been identified. In this study, we set out to probe the transcriptional diversity of early and late first trimester villous CTB (vCTB) and compare these to TSC. To this end, we performed single-cell RNA sequencing (scRNA-seq) on placental villous tissue from early (6-8 weeks) and late (12-14 weeks) first trimester placentae; we also evaluated CTB within basal (maternal) and chorionic (fetal) regions of early first trimester placenta, both by scRNA-seq and GeoMx-based spatial transcriptomics. Finally, we performed scRNA-seq on three TSC lines, derived from 6-8 week gestation placentae, as well as on early first trimester CTB at several timepoints during TSC derivation. We found notable distinctions within CTB clusters based on gestational age, further influenced by location near the basal or chorionic plates. We identified trophoblast states representing "initial state" vCTB (in vivo CTB progenitors), as well as additional CTB subtypes, precursor STB, and precursor and mature EVT. CTB progenitors were enriched in early first trimester placentae at the basal plate; overall, basal plate CTB were biased toward EVT, and chorionic plate CTB toward STB, precursors. Clustering and trajectory inference analysis indicated that TSC were most like EVT precursor cells. In fact, vCTB lost their in vivo "initial state" markers, including PAGE4, as they transitioned to TSC during in vitro culture. This was confirmed by flow cytometric analysis of 6 different TSC lines, which showed uniform expression of proximal column markers ITGA2 and ITGA5. Additionally, we found that ITGA5+ CTB could be plated in 2D, forming only EVT upon spontaneous differentiation, but failed to form self-renewing organoids; conversely, ITGA5- CTB could not be plated in 2D, but readily formed organoids. Our findings suggest that distinct CTB states exist in different regions of the placenta as early as six weeks gestation and that current TSC lines most closely resemble ITGA5+ CTB, biased toward the EVT lineage.

Keywords: Cytotrophoblast; Placenta; Trophoblast; Trophoblast stem cells.


Conflict of interest statement

Declaration of interests The authors declare no competing interests.

Figures

Fig. 1
Fig. 1. Integrated placental single cell RNA-seq data, showing distinct CTB clades in early vs. late first trimester.
(a) UMAP of all placental cells following quality control filtering, integration, and clustering. (b) Dot plot and hierarchical clustering of cell clusters using trophoblast and non-trophoblast specific gene expression. (c) Dot plot and hierarchical clustering of cell clusters using cell type specific gene expression. Dendrogram is colored based on the CTB clade color in the UMAP in part (d). (d) UMAP of trophoblast cells annotated based on cell type specific gene expression shown in part (c). Clades were formed based on hierarchical clustering seen in part (c) and in dendrogram in Fig. S2d. (e) UMAPs depicting the cell density in early (left) and late (right) first trimester placentae.
Fig. 2
Fig. 2. Identification of “initial state” CTB within early first trimester placentae.
(a) RNA velocity projected as streamlines on the integrated first trimester trophoblast UMAP. CTB names refer to CTB clades after combining CTB clusters in Fig. 1c. (b) Initial state cells (n=30) as calculated by CellRank. (c) Expression of the initial state markers HMMR and TROAP on the integrated first trimester trophoblast UMAP. (d) In-situ hybridization of HMMR expression in early and late first trimester placenta. Low-power micrographs show chorionic (CP) and basal (BP) plate regions (scale bar = 625 μm); inset is a magnified micrograph of the BP region (scale bar = 125 μm).
Fig. 3
Fig. 3. Identification of distinct CTB clades within basal and chorionic plate regions of early first trimester placenta.
(a) UMAP of annotated and integrated basal and chorionic plate trophoblast from two early first trimester placentae, showing individual clusters (left) and placental region (dark blue for basal plate and light blue for chorionic plate) (right). Dendrogram (middle) shows transcriptomic similarity (Pearson correlation) between UMAP clusters. (b) Table showing the number of cells comprising each cluster, including both raw numbers and size factor-normalized, originating from either the basal or chorionic plate. (c) Expression of the initial state markers (Table S10), in the basal and chorionic plate UMAP. Dashed circle marks cells in cluster CTB1. (d) Violin plot showing the initial state score difference between all the basal and chorionic plate cells (Wilcoxon rank-sum test, p-value=1.67e-33 indicated by *). Dashed lines show quartiles.
Fig. 4
Fig. 4. Comparison of TSC to early first trimester trophoblast identifies differences between TSC and initial state CTB.
(a) UMAP of integrated first trimester trophoblast and TSC, annotated based on cell type specific gene expression, as shown in Fig. S8c (right). Location of initial state cells (n=30) determined in Fig. 2b (left) is highlighted using red color and black outline. (b) Violin plot showing the initial state score by cluster, based on expression of genes significantly upregulated by initial state cells (Figure 2b, Table S10). Dashed lines show quartiles. (c) UMAPs showing expression of initial state markers HMMR (top) and TROAP (bottom). (d) UMAPs showing expression of pcEVT marker ITGA2 (top) and vCTB marker PAGE4 (bottom). (e) In-situ hybridization of PAGE4 in a 6-week placenta, showing uniform expression in villous CTB (arrowheads) within the gestational sac (“sac”), as well as in chorionic villi (“v”) near the chorionic and basal plates, but excluded from proximal column trophoblast (circles). Scale bar=125 μm. (f) UMAP visualizations depicting the scores of villous cytotrophoblast (VCT) and cytotrophoblast cell columns derived from VCT (VCT-CCC) cell types based on the top 50 uniquely expressed genes as outlined by Arutyunyan et al[8] (g) Percent expression of villous CTB (EGFR and ITGA6), proximal column EVT (ITGA5 and ITGA2), and pan-EVT (HLA-G) markers in undifferentiated TSCs by flow cytometry. Data are reported as mean ± standard deviation of 6 distinct TSC lines. (h) Quantitative PCR of STB marker CGB, and EVT markers ASCL2 and ITGA1, in TSC spontaneously differentiated over four days in normoxia (N, 21% oxygen) or hypoxia (H, 2% oxygen). Data are presented as fold change over undifferentiated TSC, reported as mean ± standard deviation (n=2), with p-values calculated using one-way ANOVA.
Fig. 5
Fig. 5. TSC diverge from vCTB and toward a pcEVT phenotype during in vitro derivation.
(a) Percent of early gestation first trimester CTB expressing markers of CTB (EGFR, ITGA6), pcEVT (ITGA5, ITGA2), pan-EVT (HLA-G) and mature EVT (ITGA1), by flow cytometry, at 4 timepoints during TSC derivation. (b) UMAPs colored by day in TSC medium (top left) and expression of ITGA2/5/6 in the same placenta as (a). (c) Violin plot showing initial state scoring of cells grouped by day of derivation in placenta #1816. Scoring was done using the significantly upregulated genes in initial state cells in first trimester placenta (Fig. 2b, Table S10). Dashed lines represent quartiles. (d) Violin plots, grouped by day of derivation, scoring cells from placenta #1816 based on the top 50 uniquely expressed genes as outlined by Arutyunyan et al.[8] for the cell types villous cytotrophoblast (VCT) and cytotrophoblast cell columns derived from VCT (VCT-CCC). Dashed lines represent quartiles. (e) Primary first trimester CTB, MACS-sorted based on ITGA5 expression, allowed to spontaneously differentiate over 4 days in either normoxia (21% oxygen) or hypoxia (2% oxygen), then fixed and stained for pcEVT marker ITGA5, the EVT marker HLA-G, STB markers SDC1, CYP19A1, and DAPI. Only ITGA5+ cells are shown, as ITGA5 cells did not adhere to any substrate in 2D. (f) Organoid (T-Org) formation using first trimester CTB sorted for ITGA5. Table shows number of successful attempts to derive and culture organoids beyond 5 passages. Brightfield images of representative T-Org, derived from ITGA5 and ITGA5+ CTB.

Similar articles

References

    1. Sah N. & Soncin F. Conserved and divergent features of trophoblast stem cells. J Mol Endocrinol 72 (2024). - PMC - PubMed
    1. Cherubini M., Erickson S. & Haase K. Modelling the human placental interface in vitro-a review. Micromachines (Basel) 12 (2021). - PMC - PubMed
    1. Turco M. Y. & Moffett A. Development of the human placenta. Development 146 (2019). - PubMed
    1. Hamilton W. J. & Boyd J. D. Development of the human placenta in the first three months of gestation. J Anat 94, 297–328 (1960). - PMC - PubMed
    1. Huang C. C. et al. Establishment of the fetal-maternal interface: developmental events in human implantation and placentation. Front Cell Dev Biol 11, 1200330 (2023). - PMC - PubMed

Publication types

LinkOut - more resources