

Hypoglycemia compensation mechanisms in dry fasting
- PMID: 40585323
- PMCID: PMC12206320
- DOI: 10.1016/j.metop.2025.100363
Hypoglycemia compensation mechanisms in dry fasting
Abstract
Background: Dry fasting (DF) presents three primary risks: hypovolemia, hypertonicity, and hypoglycemia. The first two have been shown to be effectively compensated, and the respective mechanisms have been studied. The behavior of glucose has only been roughly described, while the hypoglycemia compensation mechanisms remain unexplored.
Objectives: Studying the glucose behavior, the hypoglycemia compensation mechanisms, and the insulin resistance during DF.
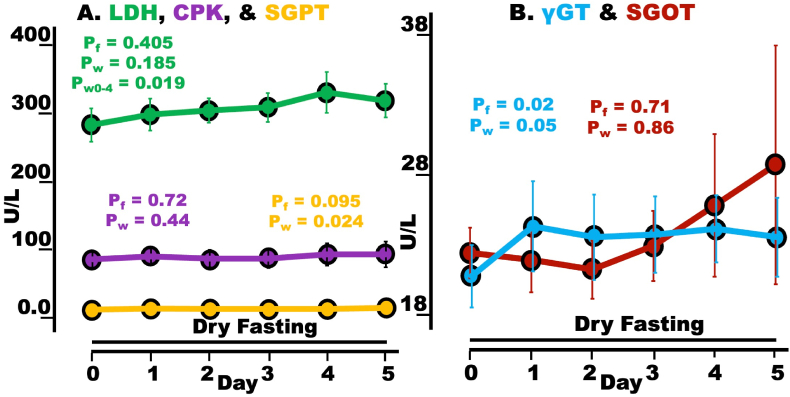
Methods: Following parameters were daily monitored in ten participants undergoing a 5-day DF: Weight, body circumferences, glucose, creatinine clearance (GFR), insulin, HOMA-IR, acetoacetate in 24-h urine, glucagon, growth hormone (GH), IGF-1, TSH, T4, T3, leptin, cholesterol, LDL-cholesterol (LDL-C), HDL-cholesterol (HDL-C), triglycerides, and the enzymes LDH, CPK, SGPT, SGOT, and γGT.
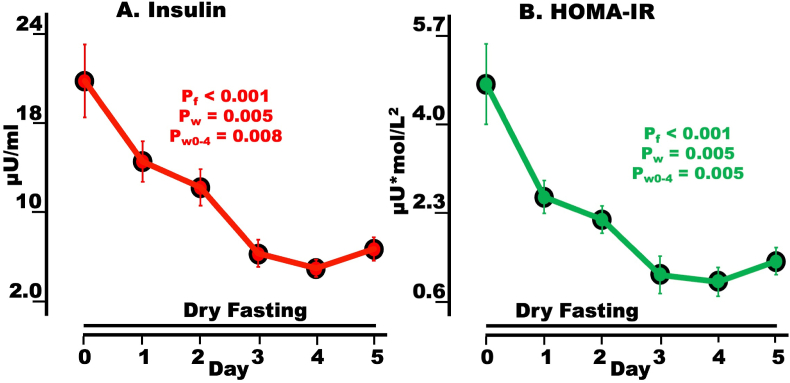
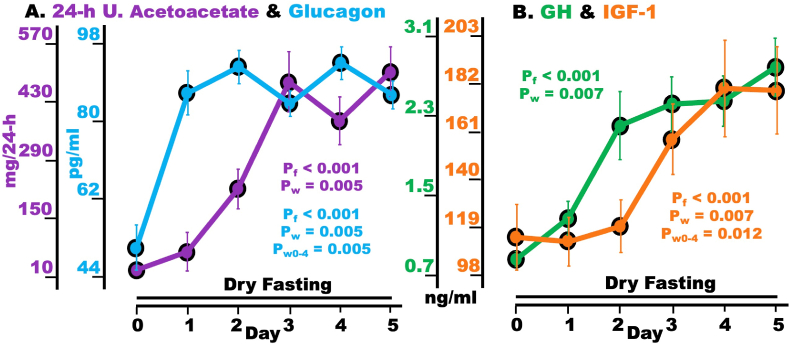
Results: Weight, body circumferences, TSH, T3, and T4 decreased to minima on Day 5; insulin and HOMA-IR decreased, reaching minima on Day 4; GH, cholesterol, LDL-C, and acetoacetate increased to maxima on Day 5; Glucagon, IGF-1, and GFR increased, presenting maxima on Day 4; Glucose, leptin, and triglycerides exhibited biphasic profiles with minima on Days 3, 3, and 2, respectively; HDL-C, LDH, CPK, SGPT, SGOT, and γGT showed minimal or non-significant changes.
Conclusion: A comprehensive description of glucose behavior and the hypoglycemia compensation mechanisms in DF were presented. DF decreased insulin resistance, likely by improving the blood - cell interphase, and enhanced GFR. The increase in LDL-C, tissue-protecting IGF-1, and late increase in leptin and triglycerides were unexpected. The results may inform the development of novel therapeutic approaches for obesity, metabolic syndrome, type-2-diabetes, non-alcoholic fatty liver disease, adiposity, and atheromatous diseases.
Keywords: Blood - Cell interphase; GFR increase; IGF-1 increase in dry fasting; Insulin resistance decrease; Late leptin increase in dry fasting; Selective LDL increase in dry fasting; Tissue protection.
© 2025 The Authors.
Conflict of interest statement
We have no conflicts of interests to declare.
Figures


Similar articles
-
Effects of Supplementation With Different Specificities of Dietary Fiber on Health-Related Indicators in Adults With Overweight or Obesity: A Systematic Review and Meta-analysis of Randomized Controlled Trials.Nutr Rev. 2025 Jul 1;83(7):e1544-e1563. doi: 10.1093/nutrit/nuae193. Nutr Rev. 2025. PMID: 39821284
-
The Effect of Endocrine Disorders on Lipids and Lipoproteins.2023 Apr 6. In: Feingold KR, Ahmed SF, Anawalt B, Blackman MR, Boyce A, Chrousos G, Corpas E, de Herder WW, Dhatariya K, Dungan K, Hofland J, Kalra S, Kaltsas G, Kapoor N, Koch C, Kopp P, Korbonits M, Kovacs CS, Kuohung W, Laferrère B, Levy M, McGee EA, McLachlan R, Muzumdar R, Purnell J, Rey R, Sahay R, Shah AS, Singer F, Sperling MA, Stratakis CA, Trence DL, Wilson DP, editors. Endotext [Internet]. South Dartmouth (MA): MDText.com, Inc.; 2000–. 2023 Apr 6. In: Feingold KR, Ahmed SF, Anawalt B, Blackman MR, Boyce A, Chrousos G, Corpas E, de Herder WW, Dhatariya K, Dungan K, Hofland J, Kalra S, Kaltsas G, Kapoor N, Koch C, Kopp P, Korbonits M, Kovacs CS, Kuohung W, Laferrère B, Levy M, McGee EA, McLachlan R, Muzumdar R, Purnell J, Rey R, Sahay R, Shah AS, Singer F, Sperling MA, Stratakis CA, Trence DL, Wilson DP, editors. Endotext [Internet]. South Dartmouth (MA): MDText.com, Inc.; 2000–. PMID: 28121116 Free Books & Documents. Review.
-
Insulin and glucose-lowering agents for treating people with diabetes and chronic kidney disease.Cochrane Database Syst Rev. 2018 Sep 24;9(9):CD011798. doi: 10.1002/14651858.CD011798.pub2. Cochrane Database Syst Rev. 2018. PMID: 30246878 Free PMC article.
-
Interventions for people with type 2 diabetes mellitus fasting during Ramadan.Cochrane Database Syst Rev. 2023 Jul 12;7(7):CD013178. doi: 10.1002/14651858.CD013178.pub2. Cochrane Database Syst Rev. 2023. PMID: 37435938 Free PMC article.
-
Effects of four-weeks porcine-collagen hydrolysate consumption on glucose concentrations, glycemic variability, and fasting/postprandial cardiometabolic risk markers in men and women with overweight or obesity: A randomized, controlled trial.Clin Nutr. 2025 Mar;46:60-71. doi: 10.1016/j.clnu.2025.01.018. Epub 2025 Jan 22. Clin Nutr. 2025. PMID: 39889494 Clinical Trial.
References
-
- Hippocrates. On regimen in acute diseases, Paragraph 11. In: acutedis.11.11.html hcmeH, ed.400 B.C.
-
- Sinaites I. Klimax6th century A.C.
-
- Syros I. Ascetic speeches7th century A.C.
LinkOut - more resources
Full Text Sources
Miscellaneous
