. 2025 May 30;28(7):112793.
doi: 10.1016/j.isci.2025.112793. eCollection 2025 Jul 18.

Alzheimer's disease brain-derived tau extracts show differential processing and transcriptional effects in human astrocytes

Affiliations

Alzheimer's disease brain-derived tau extracts show differential processing and transcriptional effects in human astrocytes

Matthew J Reid et al. iScience. .

Abstract

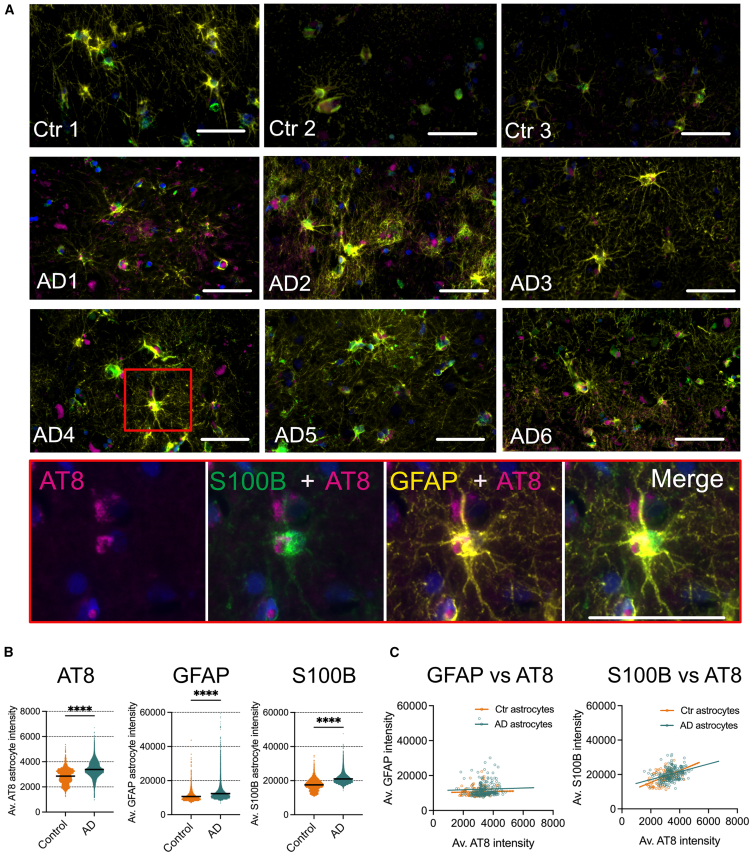
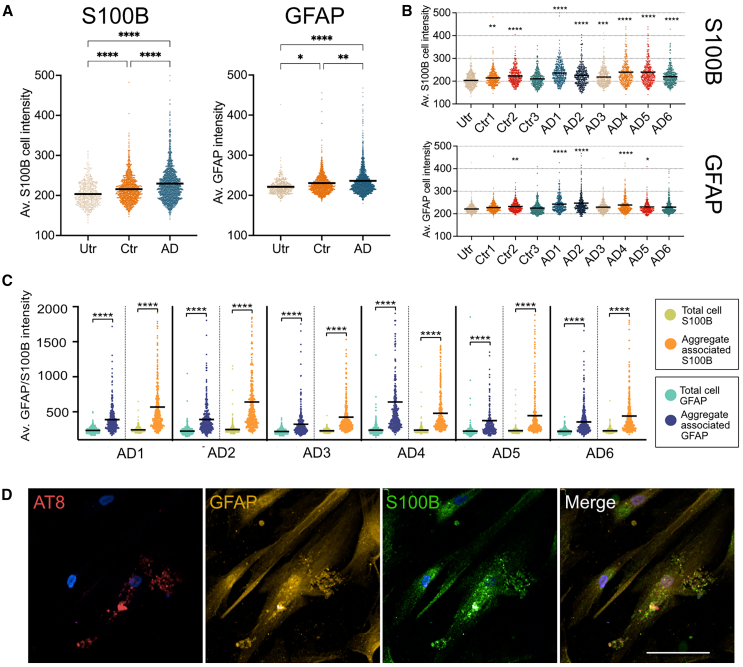
Post-translational modifications of tau, including phosphorylation at specific residues, are closely linked with tau seeding ability and clinical disease progression. While most previous evidence has focused on neuronal tau spread, evidence supports a similar role for astrocytes. Here, we demonstrate that well characterized tau aggregates isolated from postmortem Alzheimer's disease brain are internalized and processed by control human-induced pluripotent stem cell-derived astrocytes. Differences in the efficiency of tau internalization, clearance and/or seeding were noted, which reflect molecular properties of tau and/or co-factors in brain extracts. We observed a direct relationship between tau handling by astrocytes and astrocyte transcriptomic changes. Dysregulated genes include several previously identified as upregulated in reactive astrocytes in Alzheimer's brain, as well as those implicated in pathological tau clearance by autophagy and other pathways. The study provides insights into the complex interplay between tau molecular diversity and astrocyte responses in Alzheimer's disease.

Keywords: Cell biology; Cellular neuroscience; Neuroscience; Omics.


Conflict of interest statement

The author declare that they have no competing interests.

Figures

None
Graphical abstract
Figure 1
Figure 1
Characterization of human postmortem temporal cortex shows tau inclusions associated with astrocytes (A) Representative immunolabeling of astrocytes with antibodies against GFAP (yellow), S100B (green) and AT8 (purple) in temporal cortex tissue sections from AD 6 cases and 3 control brains. Lower panel shows higher magnification image of area indicated by the red box in AD4. Scale bar = 50 μm. (B) Scatterplots of AT8, GFAP and S100B intensity in individual astrocytes from AD (n = 6) and Control (n = 3) brain sections. Black lines represent mean intensities. (C) Pearson correlation analysis of intensity of AT8 immunolabeling relative to GFAP or S100B in individual astrocytes in temporal cortex of AD (n = 6) and control sections (n = 3). Data in (B) and (C) were analyzed from cells positive for both GFAP and S100B in gray matter of temporal cortex, for a combined total of 68510 astrocytes in AD tissue sections and 3217 astrocytes in control tissue sections using an unpaired t-test in (A) and Pearson correlation analysis in (B), ∗∗∗∗p < 0.0001.
Figure 2
Figure 2
Characterization of sarkosyl-insoluble tau from postmortem human brain by LC-MS/MS (A) Heatmap of tau phosphorylation sites within individual AD and control brain samples, quantified as the ratio of modified (phosphorylated) to equivalent unmodified peptides and normalized between 0 (blue) and 1 (red) for each sample (gray = undetected) to show the relative abundance of tau phosphorylation sites within that sample. (B) The presence (red) or absence of phosphorylation at specific tau residues was used for unbiased hierarchical clustering of AD and control cases that determined 3 main groups: Ctr1-3; AD3,5; AD1,2,4,6. PRD, Proline rich domain; MTBD, microtubule binding domain; C, C-terminus.
Figure 3
Figure 3
Astrocyte uptake of tau aggregates derived from AD postmortem tissue iPSC-astrocytes were incubated with 35 ng/mL of sarkosyl-insoluble tau derived from postmortem tissue of six AD cases and three equivalent control brain fractions. (A) Schematic diagram outlining the treatment of astrocytes differentiated from iPSC and treatment with sarkosyl-insoluble (SI) fractions from control and AD postmortem human brain for analysis of tau (AT8) content and to generate material for RNA-seq. (B) Average detected volume of internalized AT8 positive tau aggregates in astrocytes after 1, 3, 5, or 7 days of exposure to sarkosyl-insoluble tau fractions. (171–419 cells per treatment condition across 3 experiments, n = 3 control; n = AD 6). (C) Average detected volume of internalized AT8 tau after 7-day tau incubation (+0), and at +14 and +28 days after tau removal from media. (400–500 cells across 3 experiments, n = 3 control; n = AD 6). (D) Representative immunolabeling of AT8 positive tau (red) internalized within GFAP positive (gray) astrocytes at 1, 3, 5, and 7 days after exposure to AD1 tau. White scale bars = 100 μm. (E) Representative immunolabeling of AT8 positive tau (red) internalized within GFAP positive (gray) astrocytes after 7-day treatment (+0) and 14 days (7 days +14) or 28 days (7 days + 28) after tau removal. White scale bars = 100 μm. Data are from three independent differentiations of iPS-astrocytes. Data is mean ± SEM. Statistical analysis by two-way ANOVA with Tukey’s multiple comparisons test to untreated cells in (A) and one-way ANOVA with Dunnett’s multiple comparisons test to baseline (7 days + 0) in (B). ∗∗∗∗p < 0.0001, ∗∗∗p < 0.001, ∗∗p < 0.01, ∗p < 0.05, ns = not significant.
Figure 4
Figure 4
GFAP and S100B localize to internalized tau aggregates (A) Immunofluorescence intensity of GFAP and S100B in iPSC-astrocytes were measured after incubation with 35 ng/mL of sarkosyl-insoluble AD and control fractions for 7 days. (A) Scatterplots of average GFAP and S100B immunofluorescence intensity for combined AD treated (n = 6), control treated (n = 6) and untreated iPSC-astrocytes (2461, 1275, and 427 astrocytes respectively per treatment group across 3 experiments). (B) Scatterplots of average S100B and GFAP immunofluorescence intensity following exposure to tau from individual AD and control sarkosyl-insoluble fractions, relative to untreated iPSC-astrocytes (385–488 cells per treatment across 3 experiments, n = 3 Ctr, n = AD 6). (C) Scatterplots comparing mean “total cell intensity” relative to mean “aggregate-associated” tau intensity after internalization of AD sarkosyl-insoluble tau aggregates (n = 398–488 cells across 3 experiments, n = 3 Ctr, n = AD 6). (D) Representative immunolabeling showing GFAP (yellow) and S100B (green) localizing at high levels around internalized AT8-positive tau aggregates (red) in astrocytes exposed to sarkosyl-insoluble AD1 tau for 7 days. White scale bar = 50 μm. Data are from three independent differentiations of iPS-astrocytes. Black bar is mean of individual cell data. Statistical analysis by one-way ANOVA with Dunnett’s multiple comparisons test to untreated in (B), and paired t-test for GFAP/S100B total cell average vs. aggregate-associated immunofluorescence in (C). ∗∗∗∗p < 0.0001, ∗∗∗p < 0.001, ∗∗p < 0.01, ∗p < 0.05.
Figure 5
Figure 5
Differential gene expression in astrocytes after AD tau exposure iPSC-astrocytes were treated with 35 ng/mL of tau from sarkosyl-insoluble fraction of (AD1–6) and control (Ctr1-3) brains for 7 days and compared to untreated astrocytes after bulk RNA-sequencing. Data was pooled to compare AD treated (n = 6) and control treated (n = 3) gene expression changes to untreated astrocytes across 3 experimental repeats. (A) Venn diagram of significantly (p < 0.05) up (red) and down (blue) regulated genes in AD treated (left), control treated (right) and overlapping genes, relative to untreated astrocytes. (B) Volcano plot of significant upregulated (red) and downregulated (blue) DEGs (p < 0.05) in AD and control treated astrocytes vs. untreated controls, with annotation of the most significantly altered genes (p < 0.01). (C) Top DEGs in both control and AD groups ranked by lowest p values and filtered by log2FC > 1.5. Red gradient represents strength of upregulation and blue represents downregulation as per log2(Fold change) relative to untreated astrocytes.
Figure 6
Figure 6
Heterogeneity in astrocytic gene expression response between AD cases iPSC-astrocytes were treated for 7 days with 35 ng/mL of tau in sarkosyl-insoluble fractions of AD cases (AD1–6) and equivalent volumes of control brains (Ctr1-3) and compared individually to untreated astrocytes after bulk RNA-sequencing. (A) Total number of up- (red) and down- (blue) regulated DEGs in astrocytes exposed to samples from individual AD and control cases, compared to untreated cells. (B) Hierarchical clustered heatmap showing all significant genes (p < 0.05) for astrocytes treated with each case compared to untreated. (C) Weighted correlation network analysis (WGCNA) heatmap depicting modules with most consistent expression changes across technical repeats, compared to untreated astrocytes. The strength of gene expression for each module is represented by its eigengene value representing trend of upregulation (red) or downregulation (blue) of gene in that module compared to untreated astrocytes. Each module displays a mean of 3 technical repeats ±SD. (D) Highest expressed genes for each module from (C) depicted in network diagrams.

References

    1. Brandebura A.N., Paumier A., Onur T.S., Allen N.J. Astrocyte contribution to dysfunction, risk and progression in neurodegenerative disorders. Nat. Rev. Neurosci. 2023;24:23–39. doi: 10.1038/s41583-022-00641-1. - DOI - PMC - PubMed
    1. Ferrari-Souza J.P., Ferreira P.C.L., Bellaver B., Tissot C., Wang Y.T., Leffa D.T., Brum W.S., Benedet A.L., Ashton N.J., De Bastiani M.A., et al. Astrocyte biomarker signatures of amyloid-beta and tau pathologies in Alzheimer's disease. Mol. Psychiatry. 2022;27:4781–4789. doi: 10.1038/s41380-022-01716-2. - DOI - PMC - PubMed
    1. Crowther R.A., Goedert M. Abnormal tau-containing filaments in neurodegenerative diseases. J. Struct. Biol. 2000;130:271–279. doi: 10.1006/jsbi.2000.4270. - DOI - PubMed
    1. Wesseling H., Mair W., Kumar M., Schlaffner C.N., Tang S., Beerepoot P., Fatou B., Guise A.J., Cheng L., Takeda S., et al. Tau PTM Profiles Identify Patient Heterogeneity and Stages of Alzheimer's Disease. Cell. 2020;183:1699–1713.e13. doi: 10.1016/j.cell.2020.10.029. - DOI - PMC - PubMed
    1. Fitzpatrick A.W.P., Falcon B., He S., Murzin A.G., Murshudov G., Garringer H.J., Crowther R.A., Ghetti B., Goedert M., Scheres S.H.W. Cryo-EM structures of tau filaments from Alzheimer's disease. Nature. 2017;547:185–190. doi: 10.1038/nature23002. - DOI - PMC - PubMed

LinkOut - more resources