. 2025 Jun 12;15(14):7045-7063.
doi: 10.7150/thno.112299. eCollection 2025.

Endothelium-specific sensing of mechanical signals drives epidermal aging through coordinating retinoid metabolism

Affiliations

Endothelium-specific sensing of mechanical signals drives epidermal aging through coordinating retinoid metabolism

Xia Wu et al. Theranostics. .

Abstract

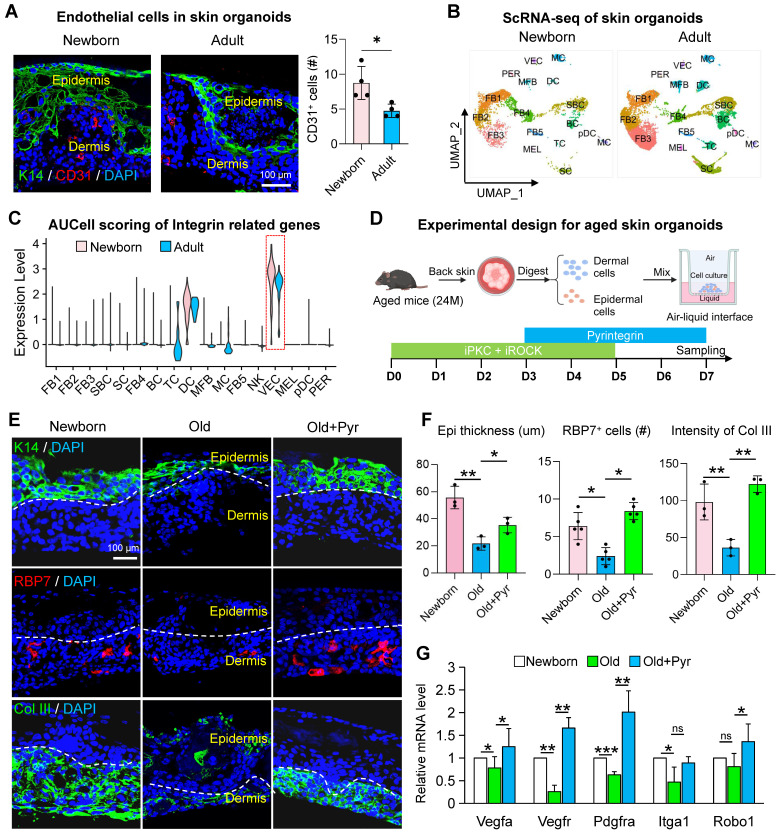
Introduction: Skin aging manifests as a systemic decay of intercellular mechano-chemical coordination. While vascular endothelial cells emerge as central orchestrators, their specific roles in sensing mechanical signals remain poorly understood. Methods: To investigate age-related skin changes, we performed single-cell RNA sequencing (scRNA-seq) and spatial transcriptomics to analyze cellular proportions and differentially expressed genes (DEGs) across young, middle-aged, and elderly human skin samples. The mechanical properties of skin were quantified using photonic crystal cellular force microscopy (PCCFM) to compare Young's modulus between young and aged skin. Cell-cell communication networks, particularly interactions among fibroblasts, vascular endothelial cells, and epidermal cells, were deciphered via CellChat analysis in young versus aged groups. Functional validation of integrin receptors and the MK signaling pathway was conducted using aging mouse models and skin organoid systems. Age-associated biomarkers were identified through immunofluorescence staining, hematoxylin-eosin (HE) staining, and RT-qPCR. RNA-seq further screened downstream targets of the MK pathway. Skin organoid cultures were employed to validate the rejuvenating effects of retinol metabolites. Results: Here we revealed that mechanoresponsive endothelial cells drive skin aging by orchestrating a tripartite axis (fibroblast-endothelial-epidermal) via integrin-mediated mechano-transduction that modulates retinoid metabolism. First, we found that reduced extracellular matrix (ECM) expression by fibroblasts weakens integrin-mediated interactions with endothelial cells, leading to a decreased number of endothelial cells and thinner skin during aging. Then, attenuated endothelial cells-derived MDK signaling to SDC4 in basal cells results in declined basal cell retinol metabolism, a process essential for maintaining skin homeostasis and regeneration. Using our established skin organoid model, we demonstrated that adding retinol metabolites can rejuvenate skin cells with better structural and functional integrity. Conclusions: These findings highlight the intricate intercellular dynamics that underlie skin aging and shed light on the previously underexplored role of mechano-sensitive endothelial cells in this process. Aging as an endothelial-specific coordination failure with other cells in the skin and potentiates developing combinatorial mechano-metabolic intervention strategies to restore tissue-level rejuvenation.

Keywords: aging; endothelial cells; mechano-chemical coordination; retinol metabolism.


Conflict of interest statement

Competing Interests: The authors have declared that no competing interest exists.

Figures

Figure 1
Figure 1
Fibroblast-driven ECM stiffening disrupts endothelial mechanoadaptive capacity during aging. A. UMAP visualization of integrated scRNA-seq data from human young, middle-aged, and aged buttock skin. B. Comparative analysis of cellular subset proportions in young, middle-aged, and old buttock skin. Red boxes indicate the age-dependent changes in the proportion of vascular endothelial cell (VEC) clusters, highlighting a decline in VEC abundance with advancing age. C. AUCell-based gene set enrichment scores for proliferation-associated genes across cellular clusters of human buttock skin. Red boxes highlight the age-related changes in proliferation gene scores within VEC clusters, demonstrating a significant reduction in proliferative capacity in aged VECs. D. Left: Representative immunostaining images of K14 (basal keratinocytes marker) and CD31 (endothelial marker) in human chest skin (n = 4). Right: Quantitative analysis of CD31⁺ cell density and epidermal thickness. Data are presented as mean ± SEM; *p < 0.05, **p < 0.01, ***p < 0.001, indicating significant age-related decreases in both parameters. E. KEGG pathway enrichment analysis of differentially expressed genes (|log₂FC| > 1, adjusted p < 0.05) in VECs between aged and young buttock skin. Key pathways related to ECM organization and angiogenesis are highlighted, showing significant downregulation in aged skin. F. Comparative analysis of CellChat-predicted interaction strength between FB and VEC in young versus aged skin. Top panel depicts buttock skin communications; Bottom panel showcases eyelid skin interactions. G. Young's modulus heatmaps of aged and young skin. Upper: Representative PCCFM images showing Young's modulus heatmaps of aged and young skin (n = 3 donors). Lower: Quantitative analysis of Young's modulus in epidermal and dermal regions (n = 25 pixels per group), demonstrating increased stiffness in aged skin. H. Volcano plots depicting differentially expressed genes (|log2FC| > 1, adjusted p < 0.05) in dermal fibroblasts comparing young versus aged skin. Top panel: buttock skin analyses; Bottom panel: eyelid skin profiling. I. Immunofluorescence of K14 and CD31 in Collagen-treated skin organoids. Left: Architectural schematic of skin organoid culture process. Middle: Representative immunofluorescence images of K14 and CD31 expression in skin organoids treated with recombinant type I murine collagen, n = 4. Right: Quantification of CD31⁺ cell density and epidermal thickness. Statistical significance: *p < 0.05 indicating enhanced vascular and epidermal integrity upon collagen treatment. J. Schematic representation of age-related changes. This diagram illustrates age-related declines in VEC numbers, collagen content, and epidermal thickness.
Figure 2
Figure 2
Fibroblast-endothelial crosstalk attenuation compromises cutaneous vascular regeneration during aging. A. Heatmap showing changes in cell-cell interaction strength between aged and young human skin. Red indicates upregulation in the aged group, blue indicates downregulation in the aged group. B. Dot plot illustrating differential Collagen-mediated interaction intensities between FB and VEC in young versus aged cohorts. C. Violin plots depicting age-dependent variations in collagen gene expression across young, middle-aged, and aged cohorts. Upper panel: Buttock skin, Lower panel: Eyelid skin. D. Feature plots showing the expression of ITGA9 and ITGB1 in young and aged buttock skin. E. ImageFeaturePlot visualization of spatial transcriptomic data depicting ITGA9 and ITGB1 expression in young and aged human skin. F. Representative immunostaining images of ITGB1 and ITGA9 expression in young human skin (n = 3 biological replicates). G. EGG pathway enrichment analysis of highly expressed genes in ITGA9⁺ and ITGB1⁺ VECs from young (upper panel) and aged (lower panel) buttock skin.
Figure 3
Figure 3
Integrin-mediated mechanoactivation drives vascular remodeling and dermal rejuvenation in aged skin. A. Bubble plot showing the changes in interactions between FB1 and FB2 with VEC in the scRNA-seq data of young and old mouse skin. B. FeaturePlot showing the expression of Itga9 and Itgb1 in the scRNA-seq data of dorsal skin from young and old mice. C. Bar graph showing the changes in relative expression levels of Itga9 and Itgb1 in the dorsal skin of young and old mice. N = 3, *p < 0.05, **p < 0.001. D. Schematic of the experimental procedure for treating 24-month-old mice with pyrintegrin. E. Representative immunostaining images showing the changes in K14, CD31, and PCNA expression in the dorsal skin of mice after pyrintegrin treatment, n = 3. F. Volcano plot showing the number of differentially expressed genes between the pyrintegrin group and the control group in RNA-seq. G. Bar graph showing the KEGG enrichment analysis terms of upregulated genes in the pyrintegrin group. H. Heatmap showing the changes in expression of angiogenesis-related genes in RNA-seq, n = 3 per group. I. Schematic illustrating the effects of pyrintegrin on vascular endothelial cells and epidermis in old mice.
Figure 4
Figure 4
Integrin signaling modulation restores youthful phenotypes in aged skin organoids. A. Representative immunofluorescence images showing the expression of the endothelial cell marker CD31 in skin organoids derived from neonatal and adult mice. n = 3. B. UMAP plot showing the distribution of cell subclusters in scRNA-seq data from skin organoids derived from neonatal (P0) and adult mice (P60). C. Violin plot comparing the expression scores of integrin receptor genes related to biomechanics in skin organoids from neonatal and adult groups. D. Schematic illustration of the construction of skin organoids derived from the skin of aged mice. E. Representative immunofluorescence images comparing the expression of basal epidermal cell marker K14, endothelial cell marker RBP7, and dermal fibroblast marker Col III in Newborn, Old, and Old + Pyr groups. N = 3. F. Quantitative analysis of CD31-positive cells (left panel), RBP7-positive cells (middle panel), and fluorescence intensity of Col III (right panel) in Newborn, Old, and Old + Pyr groups. N = 4, *p < 0.05, **p < 0.01. G. RT-qPCR analysis comparing the relative expression levels of Vegfa, Vegfr, Pdgfra, Itga1, and Robo1 in Newborn, Old, and Old + Pyr groups. N = 3, *p < 0.05, **p < 0.01, ***p < 0.001, “ns” means no significance.
Figure 5
Figure 5
Endothelial-derived paracrine factors regulate epidermal regenerative capacity in aging skin. A. Circle plot comparing the interactions of VEC as signal senders with other cell clusters across young, middle-age, and old human buttock skin. B. Bubble plot showing the changes in interaction strength between VEC and BC based on MK (midkine) signaling with increasing age. N = 4, **p < 0.01, ***p < 0.001. C. Violin plot showing the expression changes of MDK and SDC4 in scRNA-seq data of human facial skin. D. RT-qPCR analysis comparing the relative expression levels of MDK and SDC4 in human skin. N = 3, **p < 0.01, ***p < 0.001. E. ImageFeaturePlot showing the expression changes of MDK and SDC4 in spatial transcriptomics data of young and aged human skin. F. Left panel: Representative immunostaining images showing the expression of MDK and SDC4 in young and aged human skin. Right panel: Quantitative analysis of relative fluorescence intensity of MDK and SDC4. N = 3, *p < 0.05, ***p < 0.001. G. Left panel: Representative immunofluorescence images comparing the expression levels of K14 and EGFR in control and aMDK (treated by MDK activator) groups of mice. Right panel: Quantitative analysis of epidermal thickness and relative fluorescence intensity of EGFR in control and aMDK groups. N = 3, **p < 0.01, ***p < 0.001. H. Left panel: Representative immunofluorescence images comparing the expression levels of K14 and EGFR in skin organoids from control and aMDK groups. Right panel: Quantitative analysis of epidermal thickness and relative fluorescence intensity of EGFR in skin organoids from control and aMDK groups. N = 3, **p < 0.01, ****p < 0.0001.
Figure 6
Figure 6
Deciphering the Mdk-Sdc4 signaling axis in cutaneous homeostasis. A. Volcano plot showing differentially expressed genes between the aMDK group and the control group in RNA-seq analysis. B. Bar graph showing Reactome enrichment analysis terms of upregulated genes in the aMDK group. C. Left panel: Venn diagram showing the overlap of upregulated genes in the aMDK group, upregulated genes in the Pyr group, and downregulated genes in aged basal cells. Right panel: Reactome enrichment analysis of intersection genes of three groups. D. Violin plot showing the expression changes of retinol metabolism genes RARA, RBP1, and RBP4 in scRNA-seq data of human facial skin, n = 3, **p < 0.01, ***p < 0.0001. E. ImageFeaturePlot showing the expression changes of RARA, RBP1, and RBP4 in spatial transcriptomics data of young and aged human skin. F. Representative immunofluorescence images showing the expression of RARA, RBP1, and RBP4 in young and aged human skin, n = 3. G. Quantitative analysis of relative fluorescence intensity of MDK and SDC4. N = 3, *p < 0.05, **p < 0.01. H. Left panel: Representative immunofluorescence images showing changes in RBP1 expression in the control and iMDK groups. Right panel: Quantitative analysis of relative fluorescence intensity of RBP1 in the control and iMDK groups. N = 3, *p < 0.05, **p < 0.01.
Figure 7
Figure 7
Mdk-Sdc4 axis orchestrates epidermal regeneration through retinoid-mediated endothelial-basal cell crosstalk. A. FeaturePlot showing the expression changes of Rbp1 in scRNA-seq data from young and aged mouse skin. B. KEGG enrichment analysis highlighting the signaling pathways specifically enriched in Rbp1-positive cells in mouse skin. C. Upper panel: Representative immunofluorescence images showing the expression of K14 and PCNA in RP-RBP1 and control groups (left), and quantitative analysis of PCNA-positive cell numbers (right). N = 3, ****p < 0.0001. Lower panel: Representative H&E staining images showing changes in the epidermis of RP-RBP1 and control groups (left), and quantitative analysis of epidermal thickness. N = 3, ***p < 0.001. D. Violin plot showing the expression levels of Rbp1, Rara, and Rbp4 in epidermal cell clusters of skin organoids derived from neonatal and aged mice. E. Schematic diagram illustrating the reprogramming of aged mouse skin organoids using all-trans retinoic acid (atRA) and all-trans retinol (atRE). F. RT-qPCR analysis comparing the expression levels of senescence-associated markers Cdkn1a and Cdkn2a, as well as epidermal growth-related genes Egfr, Mki67, and Tp63 in control, atRA, and atRE groups, n = 3, *p < 0.05, **p < 0.01, ***p < 0.001, “ns” means no significance. G. Representative immunofluorescence images showing the expression of K14, Laminin, and P63 in control, atRA, and atRE groups. H. Quantitative analysis of the number of K14-positive cell layers, Laminin signal intensity, and P63-positive cell counts, n = 3, **p < 0.01, ***p < 0.001, “ns” means no significance.

References

    1. Grunewald M, Kumar S, Sharife H, Volinsky E, Gileles-Hillel A, Licht T. et al. Counteracting age-related VEGF signaling insufficiency promotes healthy aging and extends life span. Science. 2021;373(6554):eabc8479. - PubMed
    1. Franco AC, Aveleira C, Cavadas C. Skin senescence: mechanisms and impact on whole-body aging. Trends Mol Med. 2022;28:97–109. - PubMed
    1. Tamargo IA, Baek KI, Kim Y, Park C, Jo H. Flow-induced reprogramming of endothelial cells in atherosclerosis. Nat Rev Cardiol. 2023;20:738–53. - PMC - PubMed
    1. Hamrangsekachaee M, Wen K, Bencherif SA, Ebong EE. Atherosclerosis and endothelial mechanotransduction: current knowledge and models for future research. Am J Physiol Cell Physiol. 2023;324:488–504. - PMC - PubMed
    1. Wang H, Su Y. Collagen IV contributes to nitric oxide-induced angiogenesis of lung endothelial cells. Am J Physiol Cell Physiol. 2011;300:979–88. - PMC - PubMed