. 2025 Jun 9;15(14):6593-6614.
doi: 10.7150/thno.104329. eCollection 2025.

Enhanced neoangiogenesis and balance of the immune response mediated by the Wilms' tumor suppressor WT1 favor repair after myocardial infarction

Affiliations

Enhanced neoangiogenesis and balance of the immune response mediated by the Wilms' tumor suppressor WT1 favor repair after myocardial infarction

Nicole Wagner et al. Theranostics. .

Abstract

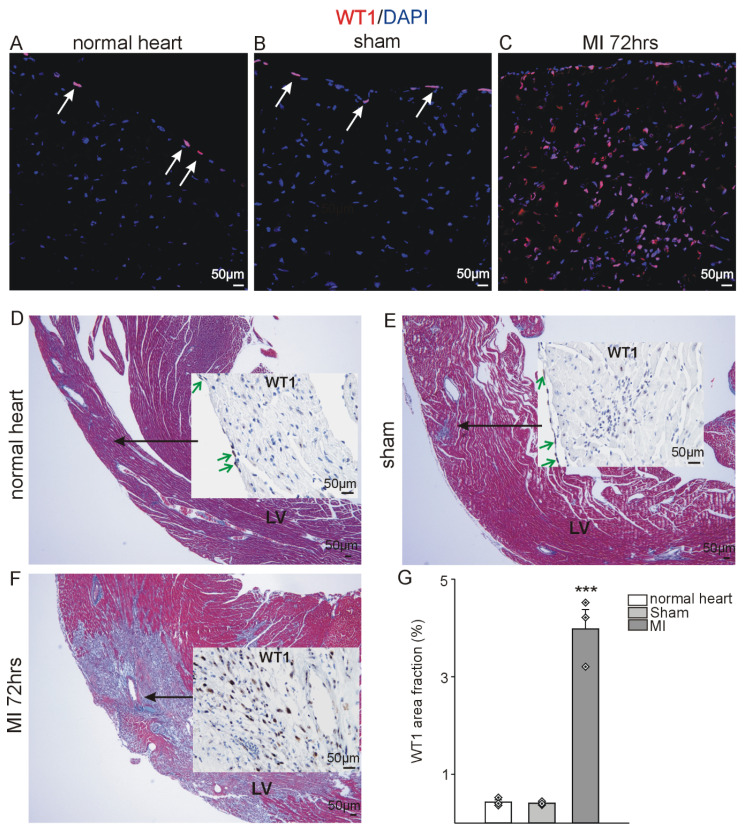
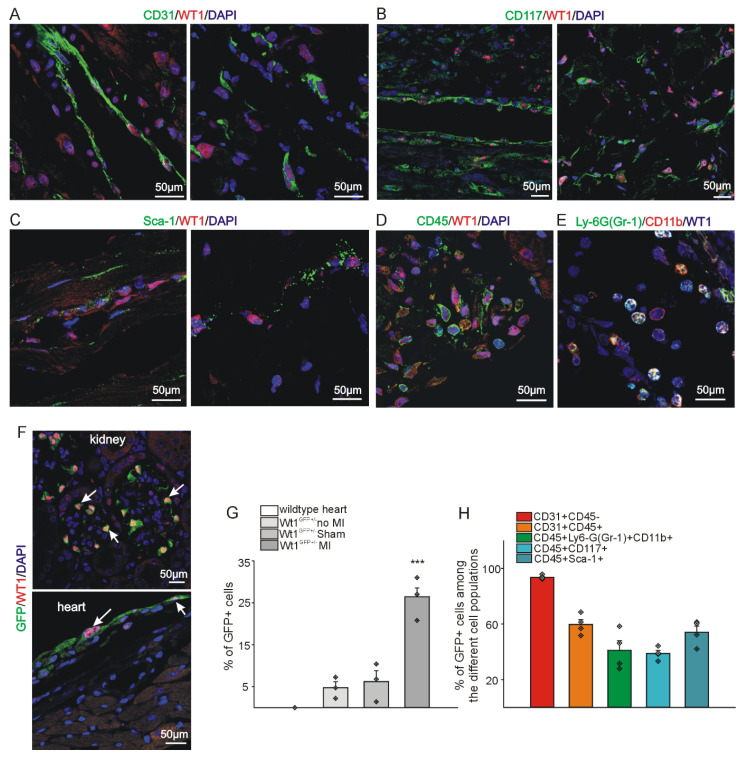
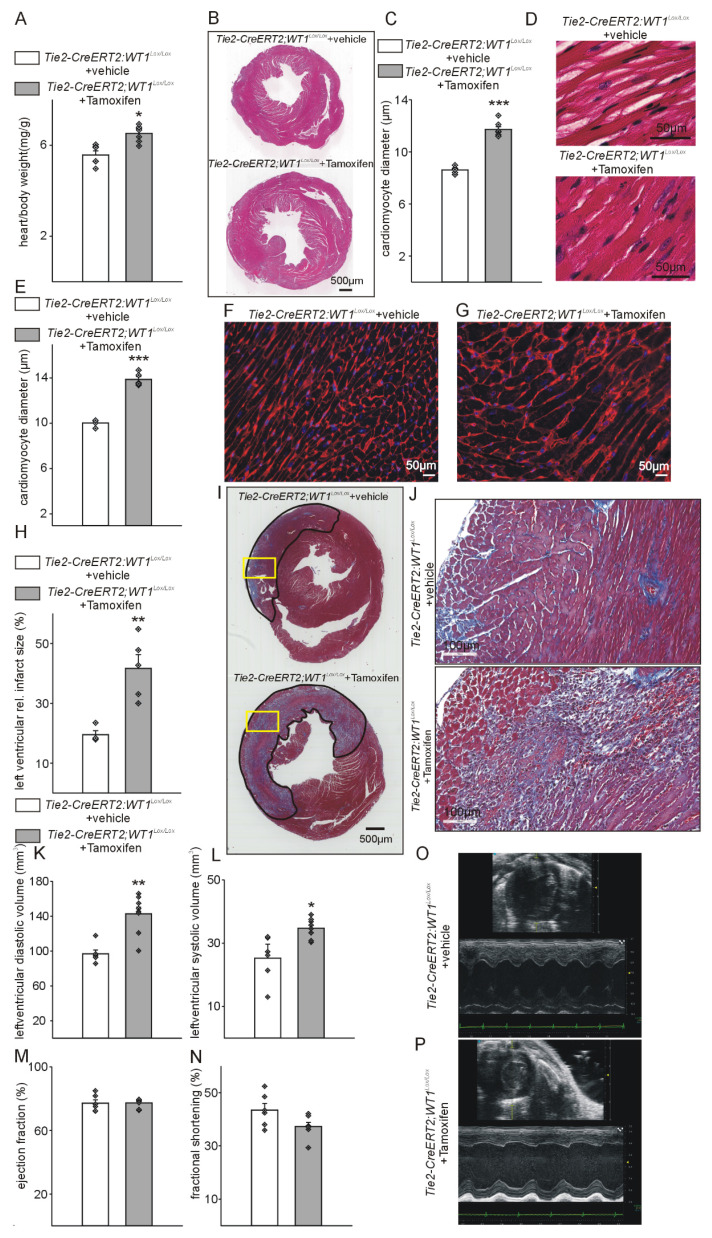
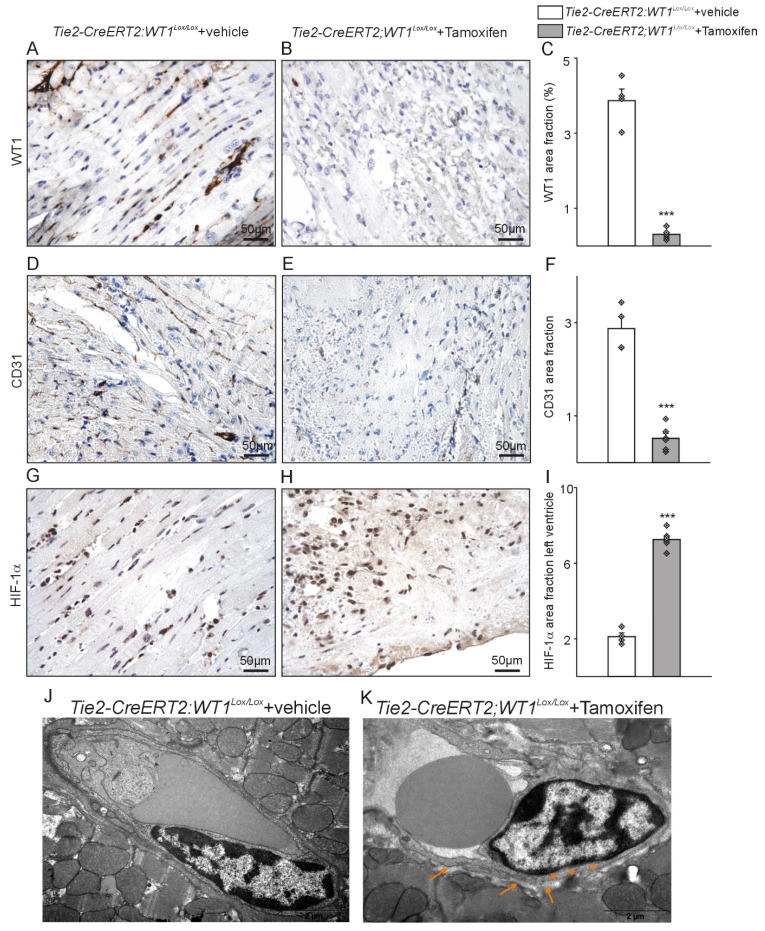
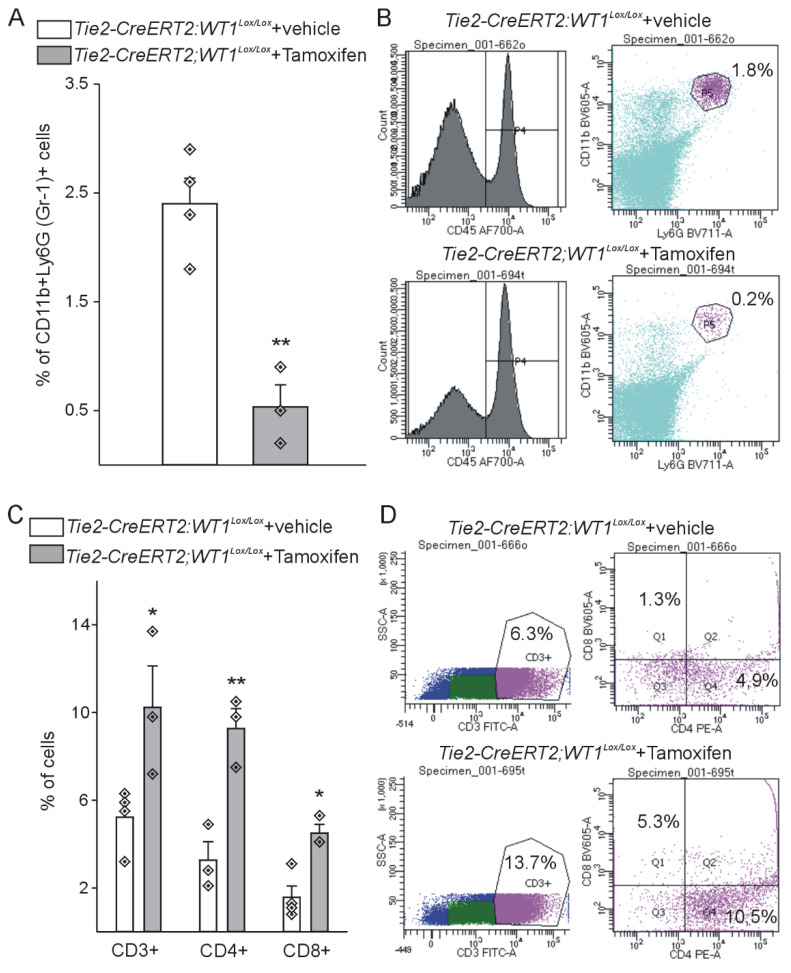
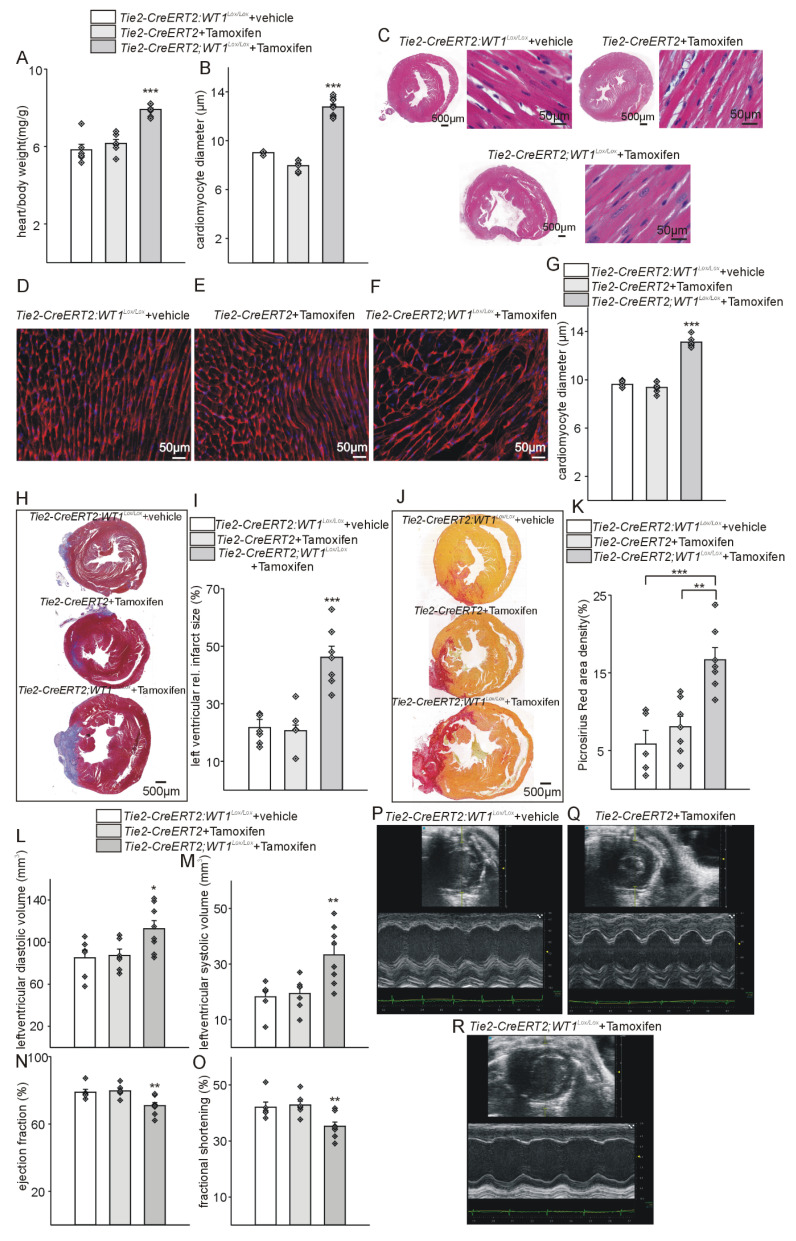
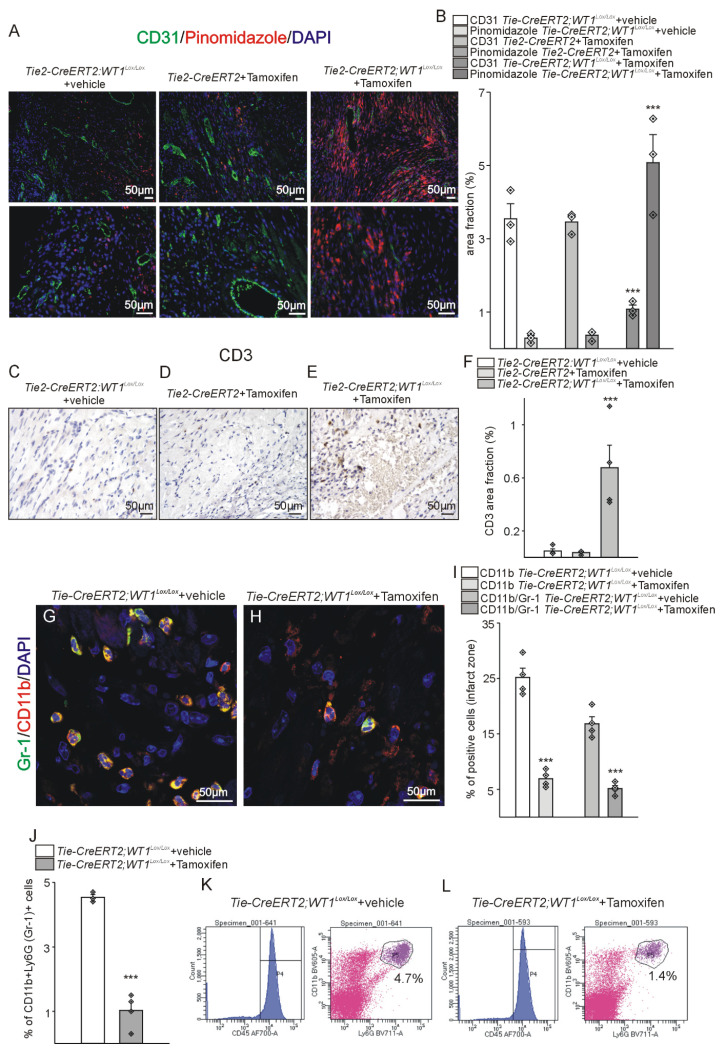
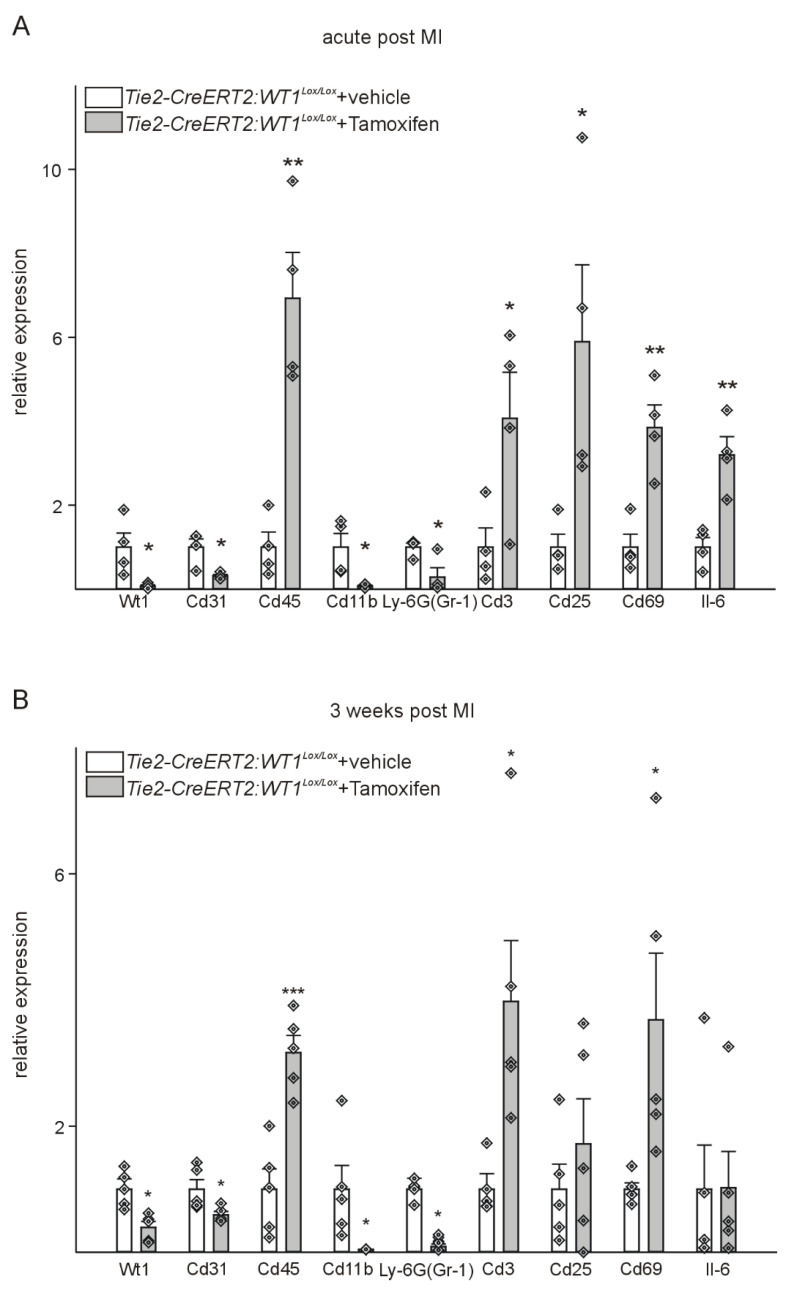
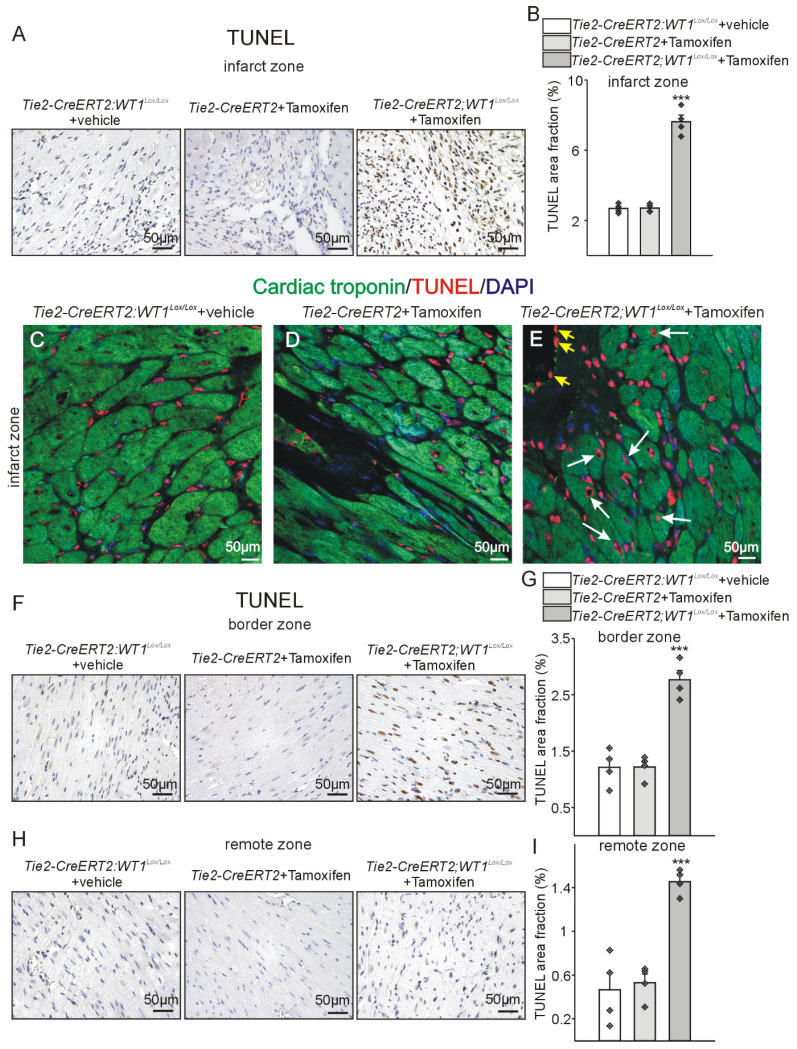
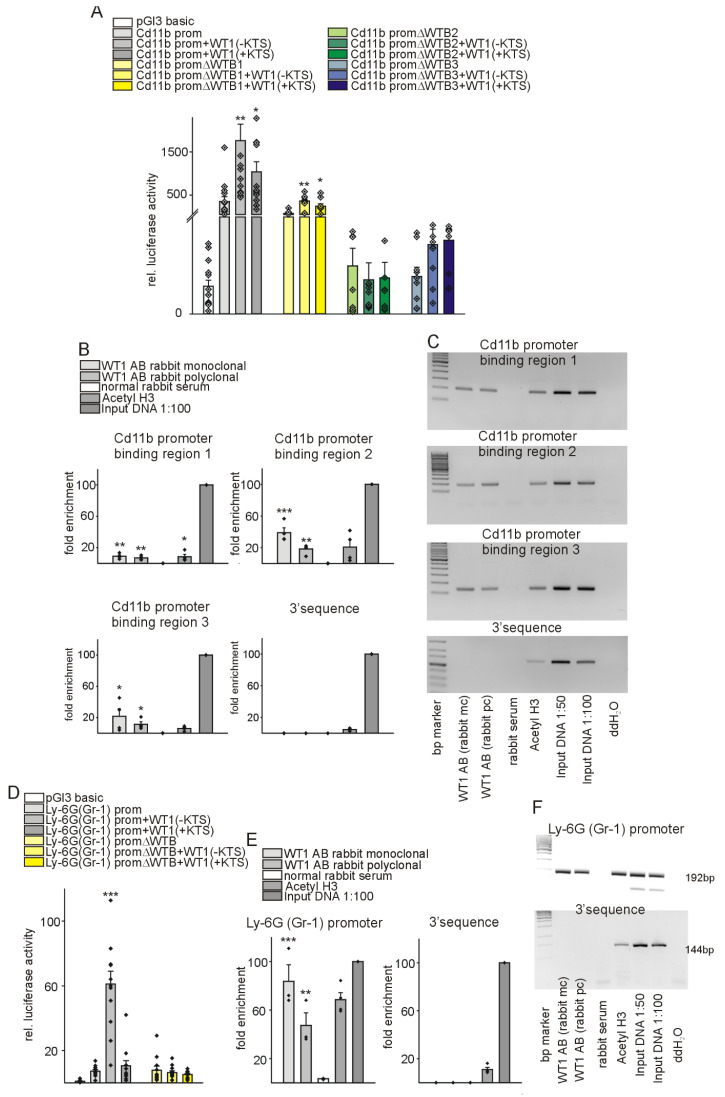
Rationale: Cardiac repair and regeneration are severely constrained in adult mammals. Several cell types have been identified as playing a role in cardiac repair. However, our understanding of the regulatory proteins common to these cell types and implicated in cardiac repair remains limited. Methods: Experimental myocardial infarctions (MI) were induced in mice by ligation of the left coronary artery. WT1 expression in different cell types was determined by immunofluorescent double-labelling. VE-cadherin-CreERT2 (VE-CreERT2) mice were crossed with Wt1lox/lox animals to generate the VE-CreERT2;Wt1lox/lox strain to knockout WT1 in endothelial cells. Wt1lox/lox and Tie2-CreERT2 animals were crossed to generate Tie2-CreERT2;Wt1lox/lox mice to delete WT1 in endothelial and myeloid-derived cells. Results: We show that the Wilms' tumor suppressor WT1 is expressed in progenitor cell populations, endothelial cells, and myeloid-derived suppressor cells (MDSCs) in mice following MI. Endothelial-specific knockout of WT1 results in reduced vascular density after MI but does not affect functional recovery. Conversely, combined knockout of WT1 in endothelial and myeloid-derived cells increases infarct size, cardiac hypertrophy, fibrosis, hypoxia, and lymphocyte infiltration. Notably, angiogenesis, infiltration of MDSCs, and cellular proliferation were diminished, and importantly, cardiac function was reduced. Mechanistically, in addition to the previously established role of WT1 in promoting the expression of angiogenic molecules, this transcription factor positively regulates the expression of Cd11b and Ly6G, which are crucial for MDSC invasion, migration and function thereby preventing overactivation of the immune response. Conclusions: Several molecules have been identified that are implicated in distinct aspects of cardiac repair following MI. The identification of WT1 as a transcription factor that is essential for repair mechanisms involving various cell types within the heart may potentially enable the future development of a coordinated repair process following myocardial infarction.

Keywords: Wilms' tumor suppressor; angiogenesis; cardiac repair; immune response; myocardial infarction.


Conflict of interest statement

Competing Interests: The authors have declared that no competing interest exists.

Figures

Figure 1
Figure 1
WT1 is upregulated after myocardial infarction. Left-ventricular WT1 protein expression (red, DAPI counterstain, blue) in adult (A) healthy mouse hearts, (B) sham-operated and (C) animals 72hrs after MI. Trichrome Masson-stained overviews of the left ventricle (LV) of (D) healthy mouse hearts, (E) sham-operated and (F) animals 72hrs after MI with insertion of representative WT1 immunostainings of this region for subsequent quantification. Arrows (white in (A) and (B), green in (D) and (E)) point to the epicardium where physiological WT1 expression can be seen in controls and sham operated animals, whereas in addition to WT1 expressing epicardial cells, a high number of cells in the left ventricle express WT1 after myocardial infarction. (G) Quantification of WT1 signal area fractions of left ventricle sections from healthy, sham-operated and animals after acute MI (n = 3 each). Data are mean ± SEM. ***p ˂ 0.001.
Figure 2
Figure 2
WT1 is expressed in a high fraction of different cell types after myocardial infarction. Co-localization of WT1 expression (red) with (A) CD31, (B) CD117, and (C) Sca-1 (green) in vessels and stroma of the left ventricle 72hrs after MI. DAPI (blue) served as counterstain. Co-expression of (D) WT1 (red) and CD45 (green) and (E) WT1 (blue), Ly-6G (Gr-1) (green), and CD11b (red) in cells of the left ventricle 72hrs after MI. (F) GFP (green) and WT1 (red) double-staining of heart and kidney confirms correct co-expression of WT1 and GFP in WT1-GFP knock-in mice. DAPI (blue) served as counterstain in (A,B,C,D,F). White arrows point to some representative kidney podocytes and epicardial cells of the heart. Scale bars indicate 50µm. (G) ImageStream® based quantitative analysis of the percentage of WT1 expressing cells under different conditions using WT1-GFP knock-in mice and wildtype animals. No WT1/GFP expression could be detected in wildtype animals. A low percentage of cells (approx. 5%) expressed WT1/GFP in healthy and sham-operated mouse hearts. In contrast, 72hrs after MI, approx. 25% of cells in the heart were WT1/GFP positive (n = 3 each). (h) ImageStream® analysis of the fraction of WT1/GFP expressing cells in different cell populations i.e. endothelial cells (CD31+CD45-), hematopoietic/myeloid cells (CD31+CD45+), MDSCs (CD45+, Ly6-G(Gr-1)+CD11b+), and progenitor cells (CD45+CD117+, CD45+Sca-1+) 72hrs after myocardial infarction. Data are mean ± SEM. ***p ˂ 0.001.
Figure 3
Figure 3
Tie2-CreERT2-mediated conditional WT1 knockout leads to additional cardiac hypertrophy, enhanced tissue damage, and worsened functional parameters compared to controls shortly after MI. Respective heart-to-body weight ratios (A), photomicrographs of HE-stained heart sections (B), quantification of cardiomyocyte diameters based on measurements from HE-stained heart sections (C), and high-power photomicrographs of HE-stained heart sections showing individual cardiomyocytes (D) from Tie2-CreERT2;Wt1lox/lox+vehicle controls (n = 6) and Tie2-CreERT2;Wt1lox/lox+Tamoxifen mice (n = 7). (E) Quantification of cardiomyocyte diameters based on measurements from WGA-stained heart sections, and high-power photomicrographs of WGA-stained heart sections showing individual cardiomyocytes (F) from Tie2-CreERT2;Wt1lox/lox+vehicle controls (n = 4) and (G) Tie2-CreERT2;Wt1lox/lox+Tamoxifen mice (n = 5). (H) Quantification of relative left ventricular infarct sizes from Tie2-CreERT2;Wt1lox/lox+vehicle (n = 4), and Tie2-CreERT2;Wt1lox/lox+Tamoxifen mice (n = 5). (I) Representative photomicrographs of Trichrome-Masson-stained heart sections with demarcation of the infarcted area. The yellow rectangles indicate the region of the high-power magnifications. (J) High power photomicrographs of Trichrome-Masson-stained heart tissue sections showing enhanced immune infiltration of Tie2-CreERT2;Wt1lox/lox+Tamoxifen hearts (lower panel) after MI compared to controls (upper panel). Left-ventricular diastolic volume (K), left-ventricular systolic volume (L), ejection fraction (M), and fractional shortening (N) as echocardiographic parameters of Tie2-CreERT2;Wt1lox/lox+vehicle) (n = 6) and Tie2-CreERT2+Tamoxifen (n = 8) animals after MI. Representative echocardiographic images for (O) Tie2-CreERT2;Wt1lox/lox+vehicle, and (P) Tie2-CreERT2;Wt1lox/lox+Tamoxifen animals. Data are mean ± SEM. *p ˂ 0.05; **p ˂ 0.01.
Figure 4
Figure 4
Tie2-CreERT2-mediated knockout of WT1 in endothelial and hematopoietic-derived cells impairs angiogenesis, increases hypoxia, and damages vessel integrity in the acute phase after MI. Photomicrographs of WT1 immunostained left ventricles after acute MI of (A) Tie2-CreERT2;Wt1lox/lox+vehicle and (B) Tie2-CreERT2;Wt1lox/lox+Tamoxifen animals. (C) Quantification of WT1 signal area fractions of left ventricle sections from Tie2-CreERT2;Wt1lox/lox+vehicle controls (n = 4) and Tie2-CreERT2+Tamoxifen (n = 6) animals after acute MI. Photomicrographs of CD31 immunostained left ventricles after acute MI of (D) Tie2-CreERT2;Wt1lox/lox+vehicle and (E) Tie2-CreERT2;Wt1lox/lox+Tamoxifen animals. (F) Quantification of CD31 signal area fractions of left ventricle sections from Tie2-CreERT2;Wt1lox/lox+vehicle controls (n = 4) and Tie2-CreERT2+Tamoxifen (n = 6) animals after acute MI. Photomicrographs of HIF-1α immunostained left ventricles after acute MI of (G) Tie2-CreERT2;Wt1lox/lox+vehicle and (H) Tie2-CreERT2;Wt1lox/lox+Tamoxifen animals. (I) Quantification of HIF-1 α signal area fractions of left ventricle sections from Tie2-CreERT2;Wt1lox/lox+vehicle controls (n = 4) and Tie2-CreERT2+Tamoxifen (n = 6) animals after acute MI. Representative high resolution electron microscopy images of left ventricular vessels of (J) Tie2-CreERT2;Wt1lox/lox+vehicle controls (n = 3) and (K) Tie2-CreERT2;Wt1lox/lox+Tamoxifen mice (n = 3). Note the starting degradation of the endothelial cell basement membrane (orange asterisks) and the enlargement of the subcellular space (orange arrows) in the Tie2-CreERT2;Wt1lox/lox+Tamoxifen animal. Data are mean ± SEM. ***p ˂ 0.001.
Figure 5
Figure 5
Cardiac lesions of Tie2-CreERT2;Wt1lox/lox+Tamoxifen animals in the acute phase after MI are characterized by less MDSC infiltration and higher lymphocyte invasion. (A) Quantification of flow cytometry analysis of the fraction of CD45+CD11b+Ly-6G (Gr-1)+ MDSCs from hearts of Tie2-CreERT2;Wt1lox/lox+vehicle controls (n = 4) and Tie2-CreERT2;Wt1lox/lox+Tamoxifen (n = 3) animals after acute MI. Representative flow cytometry examples (B) of a Tie2-CreERT2;Wt1lox/lox+vehicle control heart (upper panel) and a Tie2-CreERT2;Wt1lox/lox+Tamoxifen heart (lower panel) for MDSC quantification. (C) Quantification of flow cytometry analysis of the fraction of CD3+, CD3+CD4+, and CD3+CD8+ lymphocytes from hearts of Tie2-CreERT2;Wt1lox/lox+vehicle controls (n = 4) and Tie2-CreERT2;Wt1lox/lox+Tamoxifen (n = 3) animals after acute MI. Representative flow cytometry examples (D) of a Tie2-CreERT2;Wt1lox/lox+vehicle control heart (upper panel) and a Tie2-CreERT2;Wt1lox/lox+Tamoxifen heart (lower panel) for lymphocyte quantification. Data are mean ± SEM. *p ˂ 0.05; **p ˂ 0.01.
Figure 6
Figure 6
Tie2-Cre mediated inducible knockout of WT1 leads to cardiac hypertrophy, increased tissue damage, higher cardiac fibrosis, and impaired cardiac function after myocardial infarction. Heart-to-body weight ratios (A) and quantification of cardiomyocyte diameters based on measurements from HE-stained heart sections (B) from Tie2-CreERT2;Wt1lox/lox+vehicle (n = 6), Tie2-CreERT2+Tamoxifen (n = 6) and Tie2-CreERT2;Wt1lox/lox+Tamoxifen mice (n = 10). (C) Photomicrographs of HE-stained heart sections (left panels) and high-power photomicrographs (right panels) of HE-stained heart sections showing individual cardiomyocytes from Tie2-CreERT2;Wt1lox/lox+vehicle, Tie2-CreERT2+Tamoxifen, and Tie2-CreERT2;Wt1lox/lox+Tamoxifen mice. High-power photomicrographs of WGA-stained heart sections showing individual cardiomyocytes from (D) Tie2 -CreERT2;Wt1lox/lox+vehicle (n = 5), (E) Tie2-CreERT2+Tamoxifen (n = 6), and (F) Tie2-CreERT2;Wt1lox/lox+Tamoxifen mice (n = 6), and quantification of cardiomyocyte diameters based on measurements from the respective WGA-stained heart sections (G). (H) Representative photomicrographs of Trichrome-Masson-stained heart sections with demarcation of the infarcted area (blue staining). (I) Quantification of relative left ventricular infarct sizes from Tie2-CreERT2;Wt1lox/lox+vehicle (n = 6), Tie2-CreERT2+Tamoxifen (n = 6), and Tie2-CreERT2;Wt1lox/lox+Tamoxifen mice (n = 7). (J) Photomicrographs of Picrosirius Red stained cross sections and (K) quantification of cardiac fibrosis from Tie2-CreERT2;Wt1lox/lox+vehicle (n = 5), Tie2-CreERT2+Tamoxifen (n = 7), and Tie2-CreERT2;Wt1lox/lox+Tamoxifen mice (n = 7). Left-ventricular diastolic volume (L), left-ventricular systolic volume (M), ejection fraction (N), and fractional shortening (O) as echocardiographic parameters of Tie2-CreERT2;Wt1lox/lox+vehicle (n = 6), Tie2-CreERT2+Tamoxifen (n = 7), and Tie2-CreERT2;Wt1lox/lox+Tamoxifen mice (n = 8) 3 weeks after MI. Representative echocardiographic images for Tie2-CreERT2;Wt1lox/lox+vehicle (P), Tie2-CreERT2+Tamoxifen (Q), and Tie2-CreERT2;Wt1lox/lox+Tamoxifen (R) animals 3 weeks after MI. Data are the mean ± SEM. **p ˂ 0.01; ***p ˂ 0.001.
Figure 7
Figure 7
Expanded hypoxia, increased lymphocyte invasion, and less MDSCs in Tie2-CreERT2;Wt1lox/lox+Tamoxifen hearts after MI. (A) Pinomidazole/CD31 double-labelling of Tie2-CreERT2;Wt1lox/lox+vehicle (left panel), Tie2-CreERT2+Tamoxifen (middle panel), and Tie2-CreERT2;Wt1lox/lox+Tamoxifen (right panel) left cardiac ventricles 3 weeks after MI. Pimonidazole (red) marks hypoxic areas in the heart. CD31 (green) was used to visualize vessels. DAPI (blue) stains nuclei. (B) Quantification of the area fraction for both signals in hearts from Tie2 -CreERT2;Wt1lox/lox+vehicle controls (n = 3), Tie2-CreERT2+Tamoxifen (n = 3), and Tie2-CreERT2;Wt1lox/lox+Tamoxifen (n = 3) animals 3 weeks after MI. Photomicrographs of CD3 immunostained left ventricles 3 weeks after MI of (C) Tie2-CreERT2;Wt1lox/lox+vehicle, (D) Tie2-CreERT2+Tamoxifen, and (E) Tie2-CreERT2;Wt1lox/lox+Tamoxifen animals. (F) Quantification of CD3 signal area fractions of left ventricle sections from Tie2-CreERT2;Wt1lox/lox+vehicle controls (n = 4), Tie2-CreERT2+Tamoxifen (n = 4), and Tie2-CreERT2;Wt1lox/lox+Tamoxifen (n = 4) animals. Representative confocal images of CD11b (red) and Ly-6G (Gr-1) (green) double-labelling in the left-ventricular infarct zone from (G) Tie2-CreERT2;Wt1lox/lox+vehicle and (H) Tie2-CreERT2;Wt1lox/lox+Tamoxifen animals. DAPI (blue) served as counterstain. (I) Quantification of left-ventricular relative cell numbers positive for CD11b alone or double positive for CD11b and Ly-6G (Gr-1) of Tie2-CreERT2;Wt1lox/lox+vehicle controls (n = 4) and Tie2-CreERT2;Wt1lox/lox+Tamoxifen (n = 4) animals 3 weeks after MI. (J) Quantification of flow cytometry analysis of the fraction of CD45+CD11b+Ly-6G (Gr-1)+MDSCs from hearts of Tie2-CreERT2;Wt1lox/lox+vehicle controls (n = 4) and Tie2-CreERT2;Wt1lox/lox+Tamoxifen (n = 4) animals 3 weeks after MI. Representative flow cytometry data (K) of a Tie2-CreERT2;Wt1lox/lox+vehicle control heart and (L) a Tie2-CreERT2;Wt1lox/lox+Tamoxifen heart for MDSC quantification. Data are mean ± SEM. ***p ˂ 0.001.
Figure 8
Figure 8
Tie2-CreERT2-mediated WT1 loss impairs angiogenesis, reduces immunosuppressive mechanisms, and enhances lymphocyte invasion after MI. Quantitative RT-PCR analyses of markers of angiogenesis and immune function in the acute phase (A) and 3 weeks (B) after MI using Tie2-CreERT2;Wt1lox/lox+vehicle (n = 4) and Tie2-CreERT2;Wt1lox/lox+Tamoxifen (n = 4-5) heart tissues. Expression of each gene was normalized to the respective means of Gapdh, β-actin, and Rplp0 expression. Data are means ± SEM. *p ˂ 0.05; **p ˂ 0.01; ***p ˂ 0.001.
Figure 9
Figure 9
Higher apoptosis in Tie2-CreERT2;Wt1lox/lox+Tamoxifen hearts after MI. Photomicrographs of TUNEL immunostained left ventricles 3 weeks after MI in the infarct (A, C, D, E) border (F), and remote zone (H) of Tie2-CreERT2;Wt1lox/lox+vehicle, Tie2-CreERT2+Tamoxifen, and Tie2-CreERT2;Wt1lox/lox+Tamoxifen animals. Quantification of TUNEL signal area fractions in the infarct (B), border (G), and remote (I) zone of hearts from Tie2-CreERT2;Wt1lox/lox+vehicle controls (n = 4), Tie2-CreERT2+Tamoxifen (n = 4), and Tie2-CreERT2;Wt1lox/lox+Tamoxifen (n = 4) animals 3 weeks after MI. Representative confocal images of cardiac troponin (green) and TUNEL (red) double-labelling of the infarct zone from heart sections from Tie2-CreERT2;Wt1lox/lox+vehicle (C), Tie2-CreERT2+Tamoxifen (D), and Tie2-CreERT2;Wt1lox/lox+Tamoxifen (E) animals. DAPI (blue) served as counterstain of nuclei. White arrows indicate TUNEL positive cardiomyocytes, yellow arrows designate TUNEL positive vascular endothelial cells. Data are mean ± SEM. ***p ˂ 0.001.
Figure 10
Figure 10
WT1 binds and transcriptionally activates regulatory sequences of CD11b and Ly-6G, markers of myeloid derived suppressor cells. (A) Luciferase activity of reporter constructs carrying mouse CD11b promoter in the presence of WT1(-KTS) or WT1(+KTS) expression constructs. Transient transfections were performed using HEK293 cells (n = 12 each). The promoterless luciferase expression construct (pGl3basic) served as negative control. ΔWTB indicates reporter constructs with deletion of the predicted WT1-binding sites. (B, C) Chromatin immunoprecipitation (ChIP, n = 4) was performed using M15 mouse cell extracts and monoclonal and polyclonal antibodies against WT1 or anti-acetyl-histone H3 antibody. Normal rabbit serum served as negative control. Input DNA was used as a positive control for quantitative PCRs (B) or semiquantitative PCRs ((C), representative agarose gels) for the Cd11b promoter and respective 3′UTR sequences. (D) Luciferase activity of reporter constructs carrying mouse Ly-6G promoter in the presence of WT1(-KTS) or WT1(+KTS) expression constructs. Transient transfections were performed using HEK293 cells (n = 12 each). The promoterless luciferase expression construct (pGl3basic) served as negative control. ΔWTB indicates a reporter construct with deletion of the predicted WT1-binding site. For promoter-deletion constructs, the indicated WT1-binding site was removed from the promoter reporter construct. (E, F) Chromatin immunoprecipitation (ChIP, n = 4) was performed using M15 mouse cell extracts and monoclonal and polyclonal antibodies against WT1 or anti-acetyl-histone H3 antibody. Normal rabbit serum served as negative control. Input DNA was used as a positive control for quantitative PCRs (e) or semiquantitative PCRs ((f), representative agarose gels) for the Ly-6G promoter and respective 3′UTR sequences. Data are mean ± SEM. *p ˂ 0.05; **p ˂ 0.01; ***p ˂ 0.001.

Similar articles

References

    1. Roger VL. Epidemiology of heart failure. Circ Res. 2013;113:646–659. - PMC - PubMed
    1. Cahill TJ, Choudhury RP, Riley PR. Heart regeneration and repair after myocardial infarction: translational opportunities for novel therapeutics. Nat Rev Drug Discov. 2017;16:699–717. - PubMed
    1. González-Rosa JM, Mercader N. Cryoinjury as a myocardial infarction model for the study of cardiac regeneration in the zebrafish. Nat Protoc. 2012;7:782–788. - PubMed
    1. Poss KD, Wilson LG, Keating MT. Heart regeneration in zebrafish. Science. 2002;298:2188–2190. - PubMed
    1. Porrello ER, Mahmoud AI, Simpson E, Hill JA, Richardson JA, Olson EN. et al. Transient regenerative potential of the neonatal mouse heart. Science. 2011;331:1078–1080. - PMC - PubMed