. 2025 Jun 9;15(14):6719-6736.
doi: 10.7150/thno.111360. eCollection 2025.

OTUD1 inhibits osteoclast differentiation and osteoclastic bone loss through deubiquitinating and stabilizing PRDX1

Affiliations

OTUD1 inhibits osteoclast differentiation and osteoclastic bone loss through deubiquitinating and stabilizing PRDX1

Xiaoyu Sun et al. Theranostics. .

Abstract

Rationale: Bone homeostasis relies on a delicate equilibrium between bone formation by osteoblasts and bone resorption by osteoclasts. Disruption of this balance leads to various disorders, most notably osteoporosis. Deubiquitinating enzymes (DUBs), which cleave ubiquitin moieties from substrate proteins, play critical regulatory roles in bone pathophysiology. In this study, we explored the function of a DUB, ovarian tumor deubiquitinase 1 (OTUD1), in bone remodeling. Methods: We examined the femur bone of Otud1+/+ and Otud1-/- male mice using micro-CT analyses and histomorphometry. The potential functions and mechanisms of OTUD1 were explored in bone marrow-derived macrophages, RAW264.7 cells, and bone marrow stromal cells using RT-qPCR, western blotting and immunofluorescence. Additionally, we employed liquid chromatography-tandem mass spectrometry (LC-MS/MS) coupled with co-immunoprecipitation (Co-IP) to identify OTUD1-interacting proteins and substrates. Results: Our results demonstrated a significant downregulation of both the gene and protein level of OTUD1 during osteoclastogenesis. Furthermore, both whole-body knockout and myeloid-specific deficiency of OTUD1 resulted in reduced bone mass in male mice, driven by enhanced osteoclast differentiation. Mechanistically, OTUD1 maintained the stability of peroxiredoxin 1 (PRDX1) by reversing K48-linked ubiquitination, thereby mitigating mitochondrial dysfunction and suppressing osteoclast differentiation. Consistent with these results, mitochondria-targeted ubiquinone (MitoQ), a mitochondria-targeted antioxidant, effectively suppressed bone mass loss in OTUD1-deficient male mice. Conclusions: Our findings provided the first evidence that OTUD1 suppressed osteoclastogenesis by deubiquitinating PRDX1 and maintaining its stability, thereby offering a promising therapeutic approach for osteoclast-dependent bone diseases.

Keywords: Deubiquitination; Mitochondrial dysfunction; OTUD1; Osteoclast differentiation; PRDX1.


Conflict of interest statement

Competing Interests: The authors have declared that no competing interest exists.

Figures
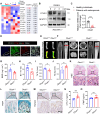
Figure 1
Figure 1
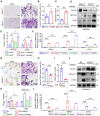
OTUD1 deficiency reduced femur bone mass in mice. (A) RT-qPCR array results revealed the mRNA levels of OTU family members in BMDMs challenged with or without RANKL (n = 4). (B) Representative immunoblot of OTUD1 in RAW264.7 after RANKL-induction (n = 3). (C) mRNA levels of Otud1 in the femoral bone of healthy individuals and patients with osteoporosis. (D) Immunofluorescence (IF) images of OTUD1 (green) and CTSK (red) in the femurs of healthy mice (n = 3, 50 μm). (E) Representative pseudo-color image of X-ray of femur in Otud1-/- and Otud1+/+ mice, used to analyze the distribution of bone mineralization. Blue, yellow, and red indicate high-density areas, and green indicates low-density areas (n = 6). (F-J) Representative micro-CT images of the distal trabecular bone of femurs from 8-week-old Otud1+/+ and Otud1-/- mice (F). (n = 6). Quantification analysis included BMD (G), bone volume/tissue volume ratio (BV/TV) (H), trabecular thickness (Tb. Th) (I), and trabecular separation (Tb. Sp) (J) (n = 6). (K) H&E staining of femurs from Otud1+/+ and Otud1-/- mice, with the boxed area in the first panel magnified below (n = 6, 100 μm). (L) Representative image of TRAP staining of distal trabecular and cortical bone in femurs from Otud1-/- and Otud1+/+ mice (n = 6, 100 μm). (M) Immunohistochemical staining of RUNX2 in the femurs of mice (n = 5, 100 μm). (N-O) ELISA measurement of CTX-1 (N) and PINP (O) levels in the serum of Otud1-/- and Otud1+/+ mice (n = 6). Data are presented as mean ± SEM. *p < 0.05, **p < 0.01, ***p < 0.001, ns: no significant.
Figure 2
Figure 2
OTUD1 from myeloid cells contributed to bone loss in mice. (A) Representative micro-CT images of the distal trabecular bone in femurs from Otud1+/+ mice receiving Otud1+/+ or Otud1-/- bone marrow (n = 6). (B-C) Quantitative analysis of BMD (B), Trabecular separation (Tb. Sp) (C) (n = 6). (D) H&E staining of femurs from Otud1+/+ mice receiving Otud1+/+ or Otud1-/- bone marrow, with the boxed area in the first panel magnified below (n = 6, 200 μm). (E) Representative image of TRAP staining of distal trabecular and cortical bone of femurs from Otud1+/+ mice receiving Otud1+/+ or Otud1-/- bone marrow, with the boxed area in the first panel magnified below (n = 6, 100 μm). (F) Immunohistochemical staining for RUNX2 in femurs, with the boxed area in the first panel magnified below (n = 6, 100 μm). (G) Quantitative analysis of TRAP+ osteoclasts in femurs (n = 6). (H) Quantitative analysis of immunohistochemical staining of femurs from Otud1+/+ mice receiving Otud1+/+ or Otud1-/- bone marrow (n = 6). (I-J) ELISA measurements of CTX-1 (I) and PINP (J) levels in the serum of Otud1+/+ mice receiving Otud1+/+ or Otud1-/- bone marrow (n = 6). Data are presented as mean ± SEM. *p < 0.05, **p < 0.01, ***p < 0.001, ns: no significant.
Figure 3
Figure 3
OTUD1 suppressed osteoclastogenesis and osteoclast differentiation in vitro. (A-C) Representative image of TRAP staining (A) and quantification analysis (B-C) of BMDMs from Otud1+/+ and Otud1-/- mice after 4 days of RANKL-induction (n = 4, 200 μm). (D-E) Representative immunoblot (D) and quantification (E) of Nfatc1 and c-Fos levels in BMDMs from Otud1+/+ and Otud1-/- mice after 4 days of RANKL-induction (n = 3). (F) Quantitative RT-qPCR analysis of Nfatc1, Mmp9 and c-fos mRNA levels in BMDMs from Otud1+/+ and Otud1-/- mice after 4 days of RANKL-induction (n = 3). (G-I) Representative image of TRAP staining (G) and quantification analysis (H-I) of OTUD1-overexpressing and control RAW264.7 cells after 4 days of RANKL-induction (n = 4, 200 μm). (J-K) Representative immunoblot (J) and quantification (K) of Nfatc1 and c-Fos levels in OTUD1-overexpressing and control RAW264.7 cells after 4 days of RANKL-induction (n = 3). (L) Quantitative RT-qPCR analysis of Nfatc1, Mmp9 and c-fos mRNA levels in OTUD1-overexpressing and control RAW264.7 cells after 4 days of RANKL-induction (n = 4). Data are presented as mean ± SEM. *p < 0.05, **p < 0.01, ***p < 0.001.
Figure 4
Figure 4
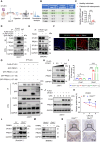
Identification of PRDX1 as a potential substrate of OTUD1. (A) Schematic illustration of the quantitative proteomic screen to identify proteins that bind to OTUD1. (B) Four potential substrates for deubiquitination of OTUD1 from liquid chromatography-tandem mass spectrometry (LC-MS/MS) analysis. (C) Prdx1 mRNA levels in the femoral bone of healthy individuals and patients with osteoporosis. (D-E) Co-immunoprecipitation (Co-IP) of OTUD1 and PRDX1 in HEK-293T cells (D) and BMDMs (E) (n = 3). (F) Immunofluorescent (IF) staining showing colocalization of OTUD1 and PRDX1 in healthy mice femur (n = 3, 50 μm). (G) Co-IP of OTUD1, WT-PRDX1, and mut-PRDX1 in HEK-293T cells co-transfected with GFP-wt-PRDX1, GFP-mut-PRDX1 and FLAG-OTUD1 overexpression plasmids. Exogenous OTUD1 was immunoprecipitated using an anti-FLAG antibody (n = 3). (H-I) Representative immunoblot (H) and RT-qPCR (I) of OTUD1 and PRDX1 in HEK-293T cells transfected with overexpression plasmids of FLAG-OTUD1 (n = 3). (J-K) Representative immunoblot for PRDX1 in control or OTUD1-overexpressing HEK-293T cells subjected to CHX pulse-chase assay (J) and quantification of PRDX1 (K). (L-M) Representative immunoblot of PRDX1 levels in RAW 264.7 cells with OTUD1 overexpression and BMDMs from Otud1-/- mice (n = 3). (N) Representative images of PRDX1 staining of trabecular bone surface in distal femur from Otud1+/+ and Otud1-/- mice (n = 6, 100µm). Data are presented as mean ± SEM. *p < 0.05, ***p < 0.001, ns: no significant.
Figure 5
Figure 5
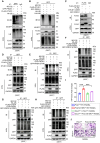
OTUD1 reversed K48-linked ubiquitination of PRDX1via C320 of OTUD1 and removed the K16 ubiquitination of PRDX1. (A) Results of ubiquitination assays confirming the ubiquitination of PRDX1 after overexpression of OTUD1 and PRDX1 for 24 h and treatment with MG132 (50 μM) for 6 h in HEK-293T cells (n = 3). (B) Immunoprecipitation of PRDX1 in 293T cells co-transfected with GFP-PRDX1, FLAG-OTUD1, and HA-Ub, HA-Ub-K48 (K48 only), and then challenged with 10 μM MG132 for 6 h. Ubiquitinated PRDX1 was detected by immunoblotting using an anti-HA antibody (n = 3). (C) Co-immunoprecipitation (Co-IP) of OTUD1 and PRDX1 in HEK-293T cells after overexpression of FLAG-OTUD1, FLAG-OTUD1C320S, and GFP-PRDX1 (n = 3). (D) Results of ubiquitination assays confirming the ubiquitination of PRDX1 after overexpression of FLAG-OTUD1, FLAG-OTUD1C320S, and GFP-PRDX1 for 24 h and treatment with MG132 (10 μM) for 6 h in HEK-293T cells (n = 3). (E-H) Immunoprecipitation of PRDX1 in HEK-293T cells co-transfected with FLAG-OTUD1, HA-Ub, GFP-PRDX1, GFP-PRDX1K7R, GFP-PRDX1K16R, GFP-PRDX1K120R, and GFP-PRDX1K136R overexpression plasmids. Exogenous ubiquitinated PRDX1 was detected by immunoblotting using a GFP-specific antibody to identify the active site of OTUD1 that regulates the ubiquitination of PRDX1 (n = 3). (I-J) RAW 264.7 cells were co-transfected with FLAG-OTUD1, GFP-PRDX1, and GFP-PRDX1K16R overexpression plasmids and stimulated with RANKL. ATP levels (I) and TRAP staining (J) of cells upon different treatment (n = 3, 200µm). Data are presented as mean ± SEM. ***p < 0.001.
Figure 6
Figure 6
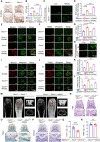
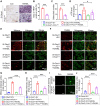
OTUD1 regulated oxidative stress-related mitochondrial dysfunction in osteoclastogenesis. (A) Representative image of 8-OHdG expression in femurs from Otud1+/+ and Otud1-/- mice (n = 6, 100 µm). (B) ATP content of BMDMs after different treatments (n = 4). (C, D) Representative DCFH-DA staining images (C) and quantitative analysis (D) of BMDMs after different treatments (n = 4, 100 μm). (E-F) Representative Mitosox and TMRM staining images of BMDMs after different treatments (n = 4, 100 μm). (G) ATP content of OTUD1-overexpressing and control RAW264.7 cells after different treatments (n = 6). (H) Representative DCFH-DA staining images of OTUD1-overexpressing and control RAW264.7 cells after different treatments (n = 4, 100 μm). (I-L) Representative Mitosox and TMRM staining images and quantitative analysis of OTUD1-overexpressing and control RAW264.7 cells after different treatments (n = 4, 100 μm). (M) Representative micro-CT images of the distal trabecular bone of femurs from Otud1+/+ mice receiving Otud1-/- bone marrow treated with or without MitoQ (n = 6). (N) H&E staining of femurs from Otud1+/+ mice receiving Otud1-/- bone marrow treated with or without MitoQ, with the boxed area in the first panel magnified below (n = 6, 100 μm). (O) Representative image of TRAP staining of distal trabecular and cortical bone of femurs from Otud1+/+ mice receiving Otud1-/- bone marrow treated with or without MitoQ, with the boxed area in the first panel magnified below (n = 6, 100 μm). (P) Immunohistochemical staining of RUNX2 in femurs from Otud1+/+ mice receiving Otud1-/- bone marrow treated with or without MitoQ, with the boxed area in the first panel magnified below (n = 6, 100 μm). (Q-R) ELISA measurements of CTX-1 (Q) and PINP (R) levels in the serum of Otud1+/+ mice receiving Otud1-/- bone marrow treated with or without MitoQ (n = 6). Data are presented as mean ± SEM. **p < 0.01, ***p< 0.001, ns: no significant.
Figure 7
Figure 7
PRDX1 rescued OTUD1 deficiency-induced bone mass loss and mitochondrial dysfunction. (A-C) Representative image of TRAP staining (A) and quantification analysis (B-C) of RAW264.7 cells transfected with or without Prdx1oe (or EV) and si-OTUD1 after RANKL-induction (n = 4, 200 μm). (D) ATP content of RAW264.7 cells transfected with Prdx1oe (or EV) and si-OTUD1 after RANKL-induction (n = 6). (E-H) Representative Mitosox staining images (E) and quantitative analysis (G) of RAW264.7 cells transfected with Prdx1oe (or EV) and si-OTUD1 after 4 days of RANKL-induction (n = 4, 100 μm). Representative TMRM staining images (F) and quantitative analysis (H) of RAW264.7 cells transfected with Prdx1oe (or EV) and si-OTUD1 after 4 days of RANKL-induction (n = 4, 100 μm). (I-J) Representative DCFH-DA staining images (I) and quantitative analysis (J) of RAW264.7 cells transfected with Prdx1oe (or EV) and si-OTUD1 after RANKL-induction (n = 4, 100 μm). Data are presented as mean ± SEM. *p < 0.05, ***p < 0.001.

References

    1. Veis DJ, O'Brien CA. Osteoclasts, master sculptors of bone. Annu Rev Pathol. 2023;18:257–81. - PubMed
    1. Xu H, Wang W, Liu X, Huang W, Zhu C, Xu Y. et al. Targeting strategies for bone diseases: signaling pathways and clinical studies. Signal Transduct Target Ther. 2023;8:202. - PMC - PubMed
    1. Yu B, Wang CY. Osteoporosis and periodontal diseases - An update on their association and mechanistic links. Periodontol 2000. 2022;89:99–113. - PMC - PubMed
    1. Liu J, Wu X, Lu J, Huang G, Dang L, Zhang H. et al. Exosomal transfer of osteoclast-derived miRNAs to chondrocytes contributes to osteoarthritis progression. Nat Aging. 2021;1:368–84. - PubMed
    1. Zheng J, Zhao J, Li C, Zhang F, Saiding Q, Zhang X. et al. Targeted protein fate modulating functional microunits promotes intervertebral fusion. Small Methods. 2024;8:e2301375. - PubMed

LinkOut - more resources