. 2025 Jun 12;15(14):7127-7153.
doi: 10.7150/thno.111198. eCollection 2025.

FAK signaling suppression by OCT4-ITGA6 mediates the effectively removal of residual pluripotent stem cells and enhances application safety

Affiliations

FAK signaling suppression by OCT4-ITGA6 mediates the effectively removal of residual pluripotent stem cells and enhances application safety

Wenpeng Song et al. Theranostics. .

Abstract

Rationale: Pluripotent stem cells (PSCs) serve as a critical source of seed cells for regenerative therapies due to their unlimited proliferative capacity and ability to differentiate into all three germ layers. Despite their potential, the risk of teratoma formation caused by residual PSCs within differentiated cell populations poses a significant barrier to clinical applications. This study aims to develop a novel strategy to selectively remove residual PSCs while preserving the safety and functionality of PSC-derived differentiated cells (iDCs). Methods: The calcium- and magnesium-free balanced salt solution (BSS(Ca-Mg-)) was employed to selectively target PSCs in a co-culture system comprising PSCs and four types of iDCs. The effect of BSS(Ca-Mg-) treatment on teratoma formation was evaluated in immunodeficient mice following cell transplantation. Comparative analysis and gene knockdown experiments were conducted to explore the molecular mechanisms underlying the differential response of PSCs and iDCs to BSS(Ca-Mg-), focusing on FAK signaling and its interaction with OCT4 and ITGA6. Results: The BSS(Ca-Mg-) treatment effectively induced the detachment of PSCs in the co-culture system without disrupting iDC adhesion. In vivo experiments confirmed that cells treated with BSS(Ca-Mg-) did not form teratomas upon implantation into immunodeficient mice. Mechanistic studies revealed that PSCs exhibit lower activation of FAK signaling compared to iDCs, contributing to their selective detachment. Additionally, OCT4 and ITGA6 were found to maintain each other's protein expression, forming a feedback loop that suppressed FAK signaling, while FAK suppression further enhanced OCT4 expression. Conclusions: The study presents a safe, effective, and cost-efficient method for the selective removal of residual PSCs. This approach enhances existing safety measures for iDC applications, improving the clinical feasibility of iDC-based cell therapies.

Keywords: Pluripotent stem cells; Teratoma; balanced salt solution; focal adhesion kinase; integrin.


Conflict of interest statement

Competing Interests: Author Jian Wang, Shixin Gong, Zongmin Jiang, Huiyuan Zhang, Lida Wu, and Yuchun Gu are employed by Allife Medicine Inc. The remaining authors declare that the research was conducted in the absence of any commercial or financial relationships that could be construed as a potential conflict of interest.

Figures
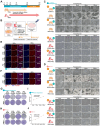
Figure 1
Figure 1
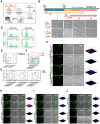
BSS (Ca-Mg-) treatment rapidly induces detachment of iPSCs but does not affect iMSCs. A-B. Schematic representation of the treatment protocol and evaluation criteria for iPSCs and iMSCs following BSS (Ca-Mg-) exposure; C-D. Light microscopy images showing the morphology of iPSCs and iMSCs after treatment with BSS (Ca-Mg-) at room temperature and 37 °C. Scale bars, 200 µm; E-F. Phalloidin staining illustrating the cytoskeletal structure of iPSCs and iMSCs after BSS (Ca-Mg-) treatment at room temperature (30 min) and 37 °C (15 min). Scale bars, 50 μm; G-H. Crystal violet staining indicates the presence of residual iPSCs and iMSCs after BSS (Ca-Mg-) treatment at room temperature and 37 °C; I-J. Trypan blue staining reveals the death rate of detached cells following BSS (Ca-Mg-) treatment at room temperature and 37 °C. Data for each point are presented as the mean ± SEM from three independent experiments (n = 3), and no statistical analysis was performed to assess differences between groups.
Figure 2
Figure 2
DPBS (Ca-Mg-) efficiently and selectively removes iPSCs from iPSCs/iDCs co-culture systems. A. Schematic illustration of the co-culture system setup, DPBS (Ca-Mg-) treatment, and evaluation criteria; B. Light microscopy images of the iPSCs/iMSCs co-culture (white arrows: iPSCs; blue arrows: iMSCs). Scale bars, 200 µm; C. Fluorescence images of the iPSCs/iMSCs co-culture before and after DPBS (Ca-Mg-) treatment (iPSCs express EGFP, iMSCs do not). Scale bars, 100 µm; D-E. Flow cytometry analysis of adherent cells before and after DPBS (Ca-Mg-) treatment (iPSCs express EGFP, iMSCs do not). The data are presented as the mean ± SEM from five biological replicates (n = 5). Statistical significance was determined using two-way ANOVA, with *p < 0.05; **p < 0.01; ***p < 0.001; F. Cell cycle analysis of adherent cells before and after DPBS (Ca-Mg-) treatment; The results from three independent experiments (n = 3) are presented as mean ± SEM. One-way ANOVA was used for comparisons between groups. No significance (ns) p > 0.05; *p < 0.05; **p < 0.01; ***p < 0.001; G. qPCR analysis of adherent cells, iPSCs, and iMSCs before and after DPBS (Ca-Mg-) treatment. The data from three independent experiments (n = 3) are expressed as mean ± SEM. Group comparisons were performed using one-way ANOVA. Statistical significance is indicated as follows: no significance (ns) p > 0.05, *p < 0.05, **p < 0.01, ***p < 0.001; H-J. Fluorescence images of iPSCs/iOBs, iPSCs/iFCs, and iPSCs/iEPCs co-culture systems before and after DPBS (Ca-Mg-) treatment (iPSCs express EGFP, while iOBs, iFCs, and iEPCs do not). Scale bars, 100 µm.
Figure 3
Figure 3
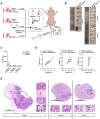
DPBS (Ca-Mg-) treated iPSCs/iMSCs co-culture system does not induce teratoma formation in vivo. A. Schematic and grouping of the in vivo teratoma formation experiment. B. Images of nude mice testes after injection with different cell groups (left testis: injected with cells; right testis: no injection; Group 1, n = 6; Group 2, n = 5; Group 3, n = 6). C. Testis weights of nude mice injected with different cell groups. Data are presented as mean ± SEM, but no statistical analysis was performed (Group 1, n = 6; Group 2, n = 5; Group 3, n = 6). DPBS (Ca-Mg-) treated iPSCs/iMSCs co-culture system does not induce teratoma formation in vivo. D. Length and width of teratomas formed in nude mice injected with different cell groups (Group 1, n = 6; Group 2, n = 5; Group 3, n = 6). E. HE staining results of the testis injected with iPSCs/iMSCs (left side) and DPBS (Ca-Mg-) treated iPSCs/iMSCs (left side), along with the right-side testis that did not receive cell injections. I. Immature neural tube (yellow arrow, ectoderm), immature nerve tissue (red arrow, ectoderm); II. Loose fibrous connective tissue (red arrow, mesoderm), blood vessels (yellow arrow, mesoderm); III. Immature cartilage tissue (yellow arrow, mesoderm); IV. Immature differentiated squamous epithelium (yellow arrow, ectoderm), bronchial mucosal epithelium (red arrow, endoderm); V-VIII. Spermatogenic cells (yellow arrow), Leydig cells (red arrow), sperm (black arrow).
Figure 4
Figure 4
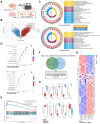
RNA-seq analysis of PSCs and iMSCs reveals differential gene expression. A. Schematic diagram showing the workflow for RNA-seq; B. Volcano plot displaying the distribution of differentially expressed genes (DEGs). Genes with a log2|FC| > 1 and adjusted p-value < 0.05 are considered significantly differentially expressed (upregulated genes are marked in red, downregulated genes in blue); C. Gene Ontology (GO) enrichment analysis for upregulated and downregulated DEGs, showing significantly enriched biological processes; D. KEGG pathway enrichment scatter plot. The X-axis represents the GeneRatio, and the Y-axis shows the KEGG pathways. The size of the points corresponds to the number of DEGs enriched in each pathway, and the color gradient (red to blue) represents the statistical significance (adjusted p-value), with redder colors indicating higher significance; E. Gene Set Enrichment Analysis (GSEA) of RNA-seq data, identifying enriched biological pathways. The X-axis represents the ranking of genes between iPSCs and iMSCs, while the Y-axis indicates the Enrichment Score (ES). The peak of the curve indicates where the gene set is most enriched, with higher ES signifying stronger enrichment; F. Venn diagram showing the overlap of genes enriched in two GSEA-identified pathways (KEGG_FOCAL_ADHESION and KEGG_ECM_RECEPTOR_INTERACTION). These genes play crucial roles in both pathways; G. Violin plot comparing the expression levels of common integrins in PSCs and iMSCs. The p-values from the Wilcoxon test are shown in the figure; H. Heatmap displaying the expression of pluripotency genes, MSC marker genes, and adhesion-related genes between PSCs and iMSCs.
Figure 5
Figure 5
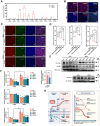
DPBS (Ca-Mg-) treatment rapidly modulates FAK signaling in iPSCs and iMSCs. A. qPCR analysis of the expression levels of common pluripotency and integrin genes in iPSCs and iMSCs. Data are presented as mean ± SEM from three independent experiments (n = 3), with statistical significance determined using Student's t-test (*p < 0.05; **p < 0.01; ***p < 0.001); B. Immunofluorescence images showing the expression of OCT4, SOX2, and ITGA6 in iPSCs and iMSCs. Scale bars, 100 µm; C-D. Immunofluorescence images and quantitative analysis of p-FAK and FAK in iPSCs and iMSCs before and after DPBS (Ca-Mg-) treatment. Quantification is based on five independent experiments (n = 5), with data presented as mean ± SEM and analyzed using one-way ANOVA, *p < 0.05; **p < 0.01; ***p < 0.001. Scale bars, 200 µm; E. Western blot showing the expression levels of p-FAK, FAK, and ITGA6 before and after DPBS (Ca-Mg-) treatment; F. Quantification of p-FAK, FAK, and ITGA6 expression. Statistical analysis for p-FAK, FAK, and p-FAK/FAK ratios was performed using two-way ANOVA (n = 3), while ITGA6 expression was analyzed using Student's t-test (n = 3). Data are presented as mean ± SEM, * compared with iPSCs, # compared with iMSCs, $ compared with iPSCs: 30min (*/#/$ p < 0.05; **/##/$$ p < 0.01; ***/###/$$$ p < 0.001); G. Schematic diagram illustrating the modulation of FAK signaling by DPBS (Ca-Mg-) treatment.
Figure 6
Figure 6
Inhibition of FAK signaling in iMSCs weakens their resistance to DPBS (Ca-Mg-) treatment. A. Schematic diagram illustrating the strategy for inhibiting FAK signaling in iMSCs using the PF-562271; B-C. Immunofluorescence images and quantitative analysis of p-FAK and FAK expression in iMSCs before and after FAKi treatment (n = 5). Data are presented as mean ± SEM, with statistical comparisons between groups performed using Student's t-test (*p < 0.05; **p < 0.01; ***p < 0.001). Scale bars, 100 µm; D-E. Western blot analysis and quantification of p-FAK and FAK expression in iMSCs before and after FAKi treatment (n = 3). Data are presented as mean ± SEM, with statistical comparisons performed using Student's t-test (*p < 0.05; **p < 0.01; ***p < 0.001); F. Bright-field images showing the morphology of iMSCs and FAKi-treated iMSCs before and after DPBS (Ca-Mg-) treatment. Scale bars, 200 µm; G. Phalloidin fluorescence images showing the cytoskeleton structure of iMSCs and FAKi-treated iMSCs before and after DPBS (Ca-Mg-) treatment. Scale bars, 100 µm; H. Crystal violet staining images of iMSCs and FAKi-treated iMSCs before and after DPBS (Ca-Mg-) treatment.
Figure 7
Figure 7
Knockdown of OCT4 in iPSCs enhances their resistance to DPBS (Ca-Mg-) treatment. A. Schematic diagram illustrating the knockdown of OCT4 in iPSCs using shOCT4; B. qPCR analysis showing the expression differences in common pluripotency genes and integrin genes between iPSCs and shOCT4-iPSCs. Data are derived from three independent experiments (n = 3) and are presented as mean ± SEM. Statistical analysis was performed using Student's t-test (*p < 0.05; **p < 0.01; ***p < 0.001); C. Immunofluorescence images of OCT4 and ITGA6 in iPSCs and shOCT4-iPSCs. Scale bars, 100 µm; D-E. Immunofluorescence images and quantification of p-FAK and FAK expression in iPSCs and shOCT4-iPSCs based on five independent experiments (n = 5). Data are presented as mean ± SEM, with group comparisons performed using Student's t-test (*p < 0.05; **p < 0.01; ***p < 0.001). Scale bars, 200 µm; F-G. Western blot analysis and quantification of p-FAK, FAK, and ITGA6 expression in iPSCs and shOCT4-iPSCs. Data are presented as mean ± SEM (n = 3), with component statistical comparisons performed using Student's t-test (*p < 0.05; **p < 0.01; ***p < 0.001); H. Bright-field images showing the morphology of iPSCs and shOCT4-iPSCs before and after DPBS (Ca-Mg-) treatment. Scale bars, 200 µm; I. The ChIP-seq peaks of OCT4 in iPSCs. Peaks represent regions with significant ChIP-seq enrichment, and the Y-axis shows ChIP-seq signal intensity (reads). X-axis represents genomic coordinates. The highlighted region corresponds to the binding site of OCT4 to the ITGA6 promoter region. For specific binding sites in this binding region, JASPAR was applied to predict the site; J. Schematic diagram showing the regulation of ITGA6 transcription and translation by OCT4.
Figure 8
Figure 8
Knockdown or blocking of ITGA6 in iPSCs enhances their resistance to DPBS (Ca-Mg-) treatment. A. Schematic diagram illustrating the knockdown or blocking of ITGA6 in iPSCs; B. Immunofluorescence images of OCT4 and ITGA6 in iPSCs and shITGA6-iPSCs. Scale bars, 200 µm; C. qPCR analysis of OCT4 and ITGA6 gene expression in iPSCs and shITGA6-iPSCs. Data from three independent experiments (n = 3) are presented as mean ± SEM, with statistical analysis performed using one-way ANOVA (*p < 0.05; **p < 0.01; ***p < 0.001); D-E. Western blot analysis and quantification of p-FAK, FAK, and ITGA6 expression in iPSCs and shITGA6-iPSCs. Data (n = 3) are presented as mean ± SEM, with component statistical comparisons performed using one-way ANOVA; F-G. Immunofluorescence images and quantification of p-FAK and FAK expression in iPSCs and shITGA6-iPSCs, based on five independent experiments (n = 5). Data are presented as mean ± SEM, and statistical comparison was performed using one-way ANOVA (***p < 0.001); H. Bright-field images showing iPSCs and shITGA6-iPSCs before and after DPBS (Ca-Mg-) treatment. Scale bars, 200 µm; I. Bright-field images showing iPSCs and ITGA6-blocked iPSCs before and after DPBS (Ca-Mg-) treatment. Scale bars, 200 µm; J-K. Immunofluorescence images and quantification of p-FAK and FAK expression in iPSCs and shITGA6-iPSCs, based on five independent experiments (n = 5). Data are presented as mean ± SEM, and statistical comparison was performed using Student's t-test (***p < 0.001).

Similar articles

References

    1. Yamanaka S. Pluripotent Stem Cell-Based Cell Therapy-Promise and Challenges. Cell stem cell. 2020;27:523–31. - PubMed
    1. Aboul-Soud MAM, Alzahrani AJ, Mahmoud A. Induced Pluripotent Stem Cells (iPSCs)-Roles in Regenerative Therapies, Disease Modelling and Drug Screening. Cells. 2021;10:2319. - PMC - PubMed
    1. Wang J, Sun S, Deng H. Chemical reprogramming for cell fate manipulation: Methods, applications, and perspectives. Cell stem cell. 2023;30:1130–47. - PubMed
    1. Thomson JA, Itskovitz-Eldor J, Shapiro SS, Waknitz MA, Swiergiel JJ, Marshall VS. et al. Embryonic stem cell lines derived from human blastocysts. Science (New York, NY) 1998;282:1145–7. - PubMed
    1. Hoang DM, Pham PT, Bach TQ, Ngo ATL, Nguyen QT, Phan TTK. et al. Stem cell-based therapy for human diseases. Signal transduction and targeted therapy. 2022;7:272. - PMC - PubMed

Substances

LinkOut - more resources