. 2025 Jul 22;10(7):e0069025.
doi: 10.1128/msystems.00690-25. Epub 2025 Jun 30.

Minimization of proteome reallocation explains metabolic transition in hierarchical utilization of carbon sources

Affiliations

Minimization of proteome reallocation explains metabolic transition in hierarchical utilization of carbon sources

Zhihao Liu et al. mSystems. .

Abstract

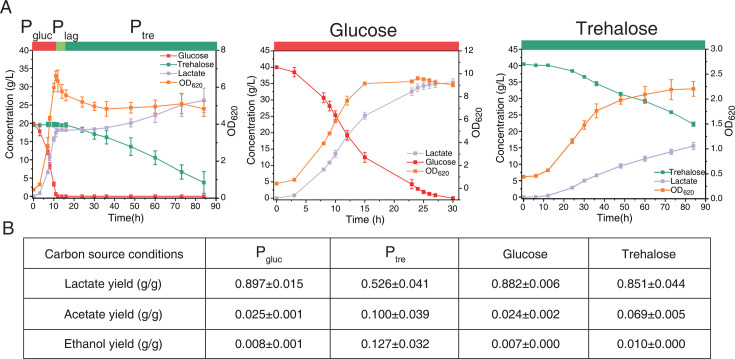
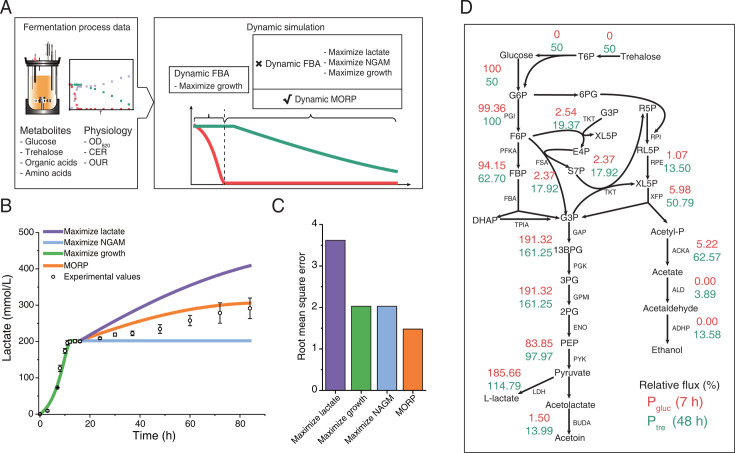
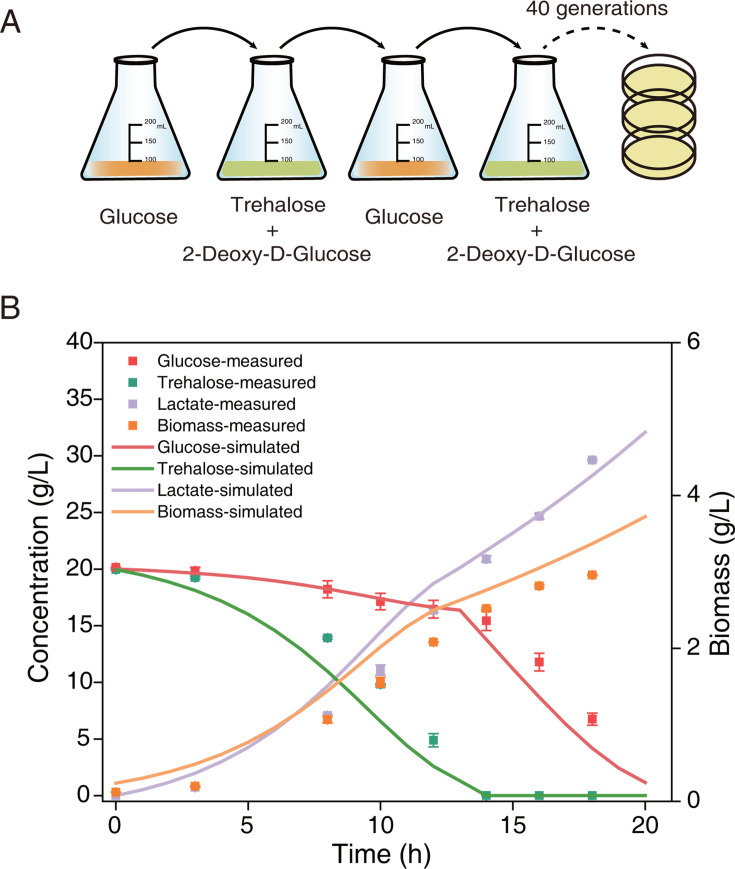
Cells choose between alternative pathways in metabolic networks under diverse environmental conditions, but the principles governing the choice are insufficiently understood, especially in response to dynamically changing conditions. Here, we observed that the lactic acid bacterium Bacillus coagulans displayed homolactic fermentation on glucose or trehalose as the sole carbon source but transitioned from homolactic to heterolactic fermentation during the hierarchical utilization of glucose and trehalose when growing on the mixture. We simulated the observation by dynamic minimization of reallocation of the proteome (dMORP) using an enzyme-constrained genome-scale metabolic model, which coincided with our omics data. Moreover, we evolved strains to co-utilize mixed carbon sources and repress the choice of heterolactic fermentation, and the dynamics after co-utilization of carbon sources were also captured by dMORP. Altogether, the findings suggest that upon environmental changes, bacteria tend to minimize proteome reallocation and accordingly adjust metabolism, and dMORP would be useful in simulating cellular dynamics.IMPORTANCERedundancy in metabolic networks empowers cells to choose between distinct metabolic strategies under changing environments. However, what drives the cellular choice remains poorly understood. We hypothesized that in response to rapid environmental changes, cells might minimize reallocation of the proteome and accordingly adjust metabolism. We found that this hypothesis could interpret a metabolic transition in the lactic acid bacterium Bacillus coagulans during the hierarchical utilization of glucose and trehalose, which was validated using systems biology approaches. Furthermore, we presented a framework with the objective function of minimizing proteome allocation, allowing for the simulation and understanding of cellular responses to dynamic perturbations.

Keywords: enzyme constraint; metabolic model; metabolic transition; mixed carbon sources.


Conflict of interest statement

The authors declare no conflict of interest.

Figures

Fig 1
Fig 1
Fermentation on various carbon sources in a 5 L bioreactor by B. coagulans. (A) Fermentation processes on glucose and trehalose as the mixed carbon sources (left), sole glucose (middle), and sole trehalose (right). Data in the plots are shown with mean ± s.d. of three biological replicates. (B) Yields of products under various phases and conditions. The yields for Pgluc and single glucose conditions are based on glucose, and those for Ptre and single trehalose conditions are based on trehalose. Data in the table are shown with mean ± s.d. of three biological replicates.
Fig 2
Fig 2
Simulation of batch fermentation under mixed carbon sources by eciBcoa620. (A) Simulation of the fermentation process. In the dFBA simulation of Pgluc, the growth rate was maximized. To simulate Ptre, various objective functions could be adopted within the dFBA framework. Additionally, we developed an approach to dynamically minimize the proteome reallocation with the enzyme-constrained models. The red and green lines in the schematic diagram represent the concentration changes of glucose and trehalose, respectively. (B) Simulation of lactate production using different objective functions. The lactate production profile for maximizing growth overlaps with that for maximizing NGAM in the trehalose phase. Minimization of proteome reallocation predicted the lactate production in Ptre better than the others, including maximizing lactate, NGAM, and growth. Data in the plot are shown with mean ± s.d. of three biological replicates. (C) Root mean square errors of the different objective functions in predicting Ptre. Root mean square error quantifies the difference between the predicted and experimental concentrations of detected products, including lactate, acetate, pyruvate, acetoin, and ethanol. (D) Comparison of the relative fluxes of the central carbon metabolism between Pgluc (represented by 7 h) and Ptre (represented by 48 h). Relative flux is calculated as the percentage of the absolute flux of each reaction to the substrate uptake flux. Note that one unit of trehalose uptake flux was converted to two units of glucose uptake flux. T6P, trehalose 6-phosphate; G6P, glucose 6-phosphate; F6P, fructose 6-phosphate; FBP, fructose 1,6-bisphosphate; DHAP, dihydroxyacetone phosphate; G3P, glyceraldehyde 3-phosphate; 13BPG, glycerate 1,3-bisphosphate; 3PG, 3-phosphoglycerate; 2PG, 2-phospho-D-glycerate; PEP, phosphoenolpyruvate; 6PG, gluconate 6-phosphate; E4P, erythrose 4-phosphate; S7P, sedoheptulose 7-phosphate; R5P, ribose 5-phosphate; RL5P, ribulose 5-phosphate; XL5P, xylulose 5-phosphate; Acetyl-P, acetyl phosphate; PGI, glucose-6-phosphate isomerase; PKFA, 6-phosphofructokinase; FBA, fructose-1,6-bisphosphate aldolase; GAP, glyceraldehyde-3-phosphate dehydrogenase; PGK, phosphoglycerate kinase; GPMI, phosphoglycerate mutase; ENO, enolase; PYK, pyruvate kinase; LDH, L-lactate dehydrogenase; RPI, ribose 5-phosphate isomerase; RPE, ribulose-phosphate 3-epimerase; XFP, phosphoketolase; FSA, fructose-6-phosphate aldolase; TKT, transketolase; BUDA, acetolactate decarboxylase; ACKA, acetate kinase; ALD, aldehyde dehydrogenase; and ADHP, alcohol dehydrogenase.
Fig 3
Fig 3
Fluxes of the CCM reactions in the fermentation process predicted by eciBcoa620. The metabolic flux distributions of the CCM at 7 14, and 48 h. These three time points represent Pgluc, Plag, and Ptre, respectively. At 7 h, the objective function was to maximize growth, while at 14 and 48 h, it was to minimize the proteome reallocation.
Fig 4
Fig 4
Comparison of simulated enzyme usage and measured mRNA and protein levels. Taking the PGI reaction as an example, the log2FC value represents the change in enzyme usage, mRNA, or protein level relative to the 7 h point. The enzyme usage was predicted by different objective functions. The mRNA and protein levels represent average values of biological triplicates from measured transcriptomics and proteomics data.
Fig 5
Fig 5
Adaptive laboratory evolution and fermentation process of the evolved strain. (A) Brief diagram of the adaptive laboratory evolution experiment. The addition of 2-deoxy-D-glucose to trehalose aimed at efficiently utilizing trehalose in the absence of glucose, with the intention of eliminating the catabolite repression effect. After 40 generations, growth and lactate production were basically stable. The strains with notably improved lactate production were selected for subsequent shake flask validation and 5 L bioreactor experiments. (B) Fermentation with mixed carbon sources in a 5 L bioreactor by the evolved strain Ev3. Simulations were performed for the fermentation process, in which dFBA with maximization of growth was performed in the phase of simultaneous utilization of glucose and trehalose, and dMORP was performed after trehalose depletion. Data are shown with mean ± s.d. of three biological replicates.

Similar articles

References

    1. Vander Heiden MG, Cantley LC, Thompson CB. 2009. Understanding the Warburg effect: the metabolic requirements of cell proliferation. Science 324:1029–1033. doi: 10.1126/science.1160809 - DOI - PMC - PubMed
    1. Shen Y, Dinh HV, Cruz ER, Chen Z, Bartman CR, Xiao T, Call CM, Ryseck R-P, Pratas J, Weilandt D, Baron H, Subramanian A, Fatma Z, Wu Z-Y, Dwaraknath S, Hendry JI, Tran VG, Yang L, Yoshikuni Y, Zhao H, Maranas CD, Wühr M, Rabinowitz JD. 2024. Mitochondrial ATP generation is more proteome efficient than glycolysis. Nat Chem Biol 20:1123–1132. doi: 10.1038/s41589-024-01571-y - DOI - PMC - PubMed
    1. Pfeiffer T, Schuster S, Bonhoeffer S. 2001. Cooperation and competition in the evolution of ATP-producing pathways. Science 292:504–507. doi: 10.1126/science.1058079 - DOI - PubMed
    1. Molenaar D, van Berlo R, de Ridder D, Teusink B. 2009. Shifts in growth strategies reflect tradeoffs in cellular economics. Mol Syst Biol 5:323. doi: 10.1038/msb.2009.82 - DOI - PMC - PubMed
    1. Flamholz A, Noor E, Bar-Even A, Liebermeister W, Milo R. 2013. Glycolytic strategy as a tradeoff between energy yield and protein cost. Proc Natl Acad Sci USA 110:10039–10044. doi: 10.1073/pnas.1215283110 - DOI - PMC - PubMed

LinkOut - more resources