. 2025 Sep 2;31(17):3754-3770.
doi: 10.1158/1078-0432.CCR-24-3083.

B7-H3 CAR T Cells Are Effective against Ependymomas but Limited by Tumor Size and Immune Response

Affiliations

B7-H3 CAR T Cells Are Effective against Ependymomas but Limited by Tumor Size and Immune Response

Sanya Mehta et al. Clin Cancer Res. .

Abstract

Purpose: Targeted treatments are desperately needed for ependymomas. Chimeric antigen receptor (CAR) T cells have immense potential to transform patient outcomes. However, CAR T-cell therapy for ependymomas has been largely understudied. In this study, we explore the potential of targeting B7 homolog 3 (B7-H3/CD276) with CAR T cells to treat pediatric ependymomas.

Experimental design: We profiled B7-H3 protein expression in 44 pediatric ependymoma samples by IHC. We generated second-generation human B7-H3.CAR T cells and examined their anti-ependymoma activity in six in vitro and two in vivo xenograft models. We validated findings using HER2-targeted CAR T cells. In addition, we used murine B7-H3.CAR T cells to evaluate in vivo antitumor activity in a fully syngeneic supratentorial ependymoma model.

Results: The majority of clinical ependymoma samples (29/44) stained positive for B7-H3, indicating high but heterogeneous expression across patients. In vitro, human B7-H3.CAR T cells had potent anti-ependymoma cytolytic activity, expansion, and persistence, which was inversely correlated with the upregulation of B7-H3 on CAR T cells. We found that CAR T cells favor type 2 cytokines phenotypes after repeated exposure to ependymoma cell lines, which may be driven by C-C motif chemokine ligand 2 secretion by ependymomas. In vivo, there was potent and significant antitumor activity in human xenograft ependymoma models. However, response durability was limited and significantly correlated with the degree of tumor burden. In the syngeneic setting, murine B7-H3.CAR T-cell efficacy against ependymomas was limited and did not extend survival.

Conclusions: Our results support ongoing clinical evaluation of B7-H3.CAR T cells for ependymomas and provide model systems for further studying determinants of anti-ependymoma CAR T-cell treatment efficacy and resistance.


Conflict of interest statement

G. Krenciute reports grants from the National Institute of Neurological Disorders and Stroke and the NCI during the conduct of the study. No disclosures were reported by the other authors.

Figures
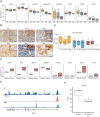
Figure 1.
Figure 1.
Expression of key target antigens in pediatric ependymoma. A, B7-H3, HER2, GD2, CD70, EphA2, GPC2, GPC3, and IL13Ra2 gene expression in primary pediatric ST (n = 43), PF (n = 88), and spinal (SP; n = 4) ependymomas. B, Representative IHC images of primary ST, PF, and SP ependymomas stained for B7-H3. Scale bar, 50 μm. C,H scores of pediatric ependymoma samples (n = 44). The red line indicates matched primary and relapsed samples from the same patient. D, Murine Cd276 (B7-h3), Her2, B4galnt1, Cd70, Epha2, Gpc2, Gpc3, and IL13Ra2 expression in mouse IUE–derived ZRfus1 tumors and matched normal brain. E, Binding profiles of ZRfus1, H3K27ac CUT&RUN, and ATAC sequencing shown at the B7-h3 loci of ZRfus1 cells. F, Differential B7-h3 gene expression between nontargeting control and ZFTA-RELA KO tumors across three different cell passages of dissociated tumor cells.
Figure 2.
Figure 2.
Profiling of B7-H3 and HER2 in ZFTA fusion–driven ependymoma (EPN) xenograft models. A, Representative flow cytometry plots of B7-H3 surface expression on ependymoma cell lines (1425, EP1, L46SJ, CPITT, ST1, and ST2). B, Cell surface antigen quantification of B7-H3 on ependymoma cell lines measured by flow cytometry antigen density quantification assay (n = 3 biological replicates, mean with SEM). C, Cell surface antigen quantification of B7-H3 on several pediatric brain tumors [ependymomas (n = 6), MBs (n = 5), DIPGs (n = 5), and HGG (n = 1)] measured by flow cytometry antigen density quantification assay (dots represent averages of 2–3 technical repeats, unpaired t tests). D, Comparison of B7-H3 and HER2 antigen density (n = 3 technical replicates, multiple paired t tests).
Figure 3.
Figure 3.
B7-H3.CAR T cells sustain proliferative capacity while killing ependymoma cells. A, Twenty four–hour MTS cytotoxicity assays with CAR T cells and ependymoma cell lines at E/T ratios of 2.5:1 and 0.16:1 (n = 3–4 healthy donors, mean with SEM, paired t tests). B and C, B7-H3.CAR and B7-H3.Δ T cells were cocultured with ependymoma cells at a 2:1 E/T ratio in the presence of 5 ng/mL IL-15. T cells were counted and restimulated with fresh ependymoma cells every 7 days until T cells stopped expanding or stopped killing ependymoma cells. B, Fold expansion and (C) total number of T-cell stimulations are shown. B7-H3.CAR and B7-H3.Δ T cells from the same donor are color-coded (n = 4–5 healthy donors, mean with SEM, paired t tests).
Figure 4.
Figure 4.
CAR T cells become type 2 polarized during long-term challenge with ependymoma (EPN) cells. B7-H3.CAR and B7-H3.Δ T cells were repetitively stimulated with ependymoma cells as described for Fig. 3B and C. Coculture supernatants were harvested 24 hours after each stimulation, and multiplexed cytokine analysis was used to measure cytokine and chemokine production after stimulations one through four. A and B, Cytokine production by B7-H3.CAR T cells in the first versus fourth stimulation with ependymoma cells quantified for (A) type 1 and (B) type 2 cytokines. A, Fold change from 0.5 to 1.5 is indicated by the gray boxes (n = 3 healthy donors, ratio paired t tests or Wilcoxon signed-rank tests). C, CCL2 secretion by ependymoma cells and T cells after 24 hours in culture (n = 3 healthy donors). D, Heatmap of CCL2 concentrations in coculture supernatants 24 hours after stimulations one through six (n = 3 healthy donors, mean).
Figure 5.
Figure 5.
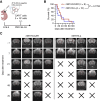
Evaluation of antitumor efficacy of B7-H3– and HER2-targeted CAR T cells. A, Experimental scheme: 1 × 10⁶ 1425 cells were implanted intracranially (i.c.) into the cortex of NSG mice on D0, followed by a single intracranial dose of PBS (no treatment) or 2 × 10⁶ B7-H3.CAR or B7-H3.Δ T cells following proof of tumor engraftment by MRI (D23–65). B, Kaplan–Meier survival curve (n = 10 for no treatment, n = 17 for B7-H3.CAR and B7-H3.Δ, two-tailed log-rank Mantel–Cox tests). Experiments were conducted in three independent cohorts of mice. C, Experimental scheme: 1 × 10⁶ PFASJ1 cells were implanted intracranially into the cortex of NSG mice on D0, followed by a single intracranial dose of 2 × 10⁶ B7-H3.CAR or B7-H3.Δ T cells following proof of tumor engraftment by MRI (D51). D, Kaplan–Meier survival curve (n = 9 for B7-H3.CAR and n = 8 for B7-H3.Δ, two-tailed log-rank Mantel–Cox test). E, Experimental scheme: 1 × 10⁶ 1425 cells were implanted intracranially into the cortex of NSG mice on D0, followed by a single intracranial dose 2 × 10⁶ HER2.CAR or HER2.Δ T cells following proof of tumor engraftment by MRI (D106). F, Kaplan–Meier survival curve (n = 12 for HER2.CAR and n = 15 for HER2.Δ, two-tailed log-rank Mantel–Cox test). G, Linear correlation of tumor volumes before treatment vs. survival of mice who succumbed to tumor after B7-H3.CAR (n = 7) and HER2.CAR (n = 12) T-cell treatment. Tumor volumes were measured by MRI 1–6 days before CAR T-cell injection.
Figure 6.
Figure 6.
Murine B7-H3.CAR T cells have a limited anti-ependymoma response in the immune-competent setting. A, Experimental scheme: IUE was performed on gestating pups at E16.5. On PND 38–53, following proof of tumor formation by MRI, a single dose of 3 × 10⁶ murine B7-H3.CAR or B7-H3.Δ T cells was administered intracranially. B, Kaplan–Meier survival curve (n = 9 for B7-H3.CAR and n = 10 for B7-H3.Δ, two-tailed log-rank Mantel–Cox test). C, Representative axial brain MRI images from four murine B7-H3.CAR– and B7-H3.Δ–treated mice at the specified time points. [A, Created in BioRender. Mehta, S. (2025) https://BioRender.com/u3d0l3e.]

References

    1. Saleh AH, Samuel N, Juraschka K, Saleh MH, Taylor MD, Fehlings MG. The biology of ependymomas and emerging novel therapies. Nat Rev Cancer 2022;22:208–22. - PubMed
    1. Merchant TE, Li C, Xiong X, Kun LE, Boop FA, Sanford RA. Conformal radiotherapy after surgery for paediatric ependymoma: a prospective study. Lancet Oncol 2009;10:258–66. - PMC - PubMed
    1. Rudà R, Bruno F, Pellerino A, Soffietti R. Ependymoma: evaluation and management updates. Curr Oncol Rep 2022;24:985–93. - PMC - PubMed
    1. Morrall M, Reed-Berendt R, Moss K, Stocks H, Houston AL, Siddell P, et al. Neurocognitive, academic and functional outcomes in survivors of infant ependymoma (UKCCSG CNS 9204). Childs Nerv Syst 2019;35:411–20. - PubMed
    1. Ritzmann TA, Rogers HA, Paine SML, Storer LCD, Jacques TS, Chapman RJ, et al. A retrospective analysis of recurrent pediatric ependymoma reveals extremely poor survival and ineffectiveness of current treatments across central nervous system locations and molecular subgroups. Pediatr Blood Cancer 2020;67:e28426. - PubMed

MeSH terms