

Disparities in Human Papillomavirus-Associated Cancer Incidence by Appalachian Residence
- PMID: 40587129
- PMCID: PMC12210082
- DOI: 10.1001/jamanetworkopen.2025.18242
Disparities in Human Papillomavirus-Associated Cancer Incidence by Appalachian Residence
Abstract
Importance: Poor socioeconomic conditions and corresponding health disparities have historically characterized the Appalachian region of the US. Low uptake of the human papillomavirus (HPV) vaccine and high rates of cervical cancer have been observed in the region; however, a comprehensive assessment of HPV-associated cancer in Appalachia has not been performed.
Objective: To compare the burden of HPV-associated cancer incidence between the Appalachian and non-Appalachian regions of the US.
Design, setting, and participants: This cross-sectional study of HPV-associated cancer incidence rates and trends used the US Cancer Statistics Incidence Analytic Database, covering 99% of the US population and 100% of the Appalachian region. Participants were individuals with an HPV-associated cancer diagnosis reported to a US cancer registry between January 1, 2004, and December 31, 2021. Human papillomavirus-associated cancers include squamous cell carcinomas of the oropharynx, anus, vulva, vagina or penis, or cervical carcinoma. Statistical analysis was performed in December 2024.
Exposures: Age, sex, race and ethnicity, county of residence, urbanicity, and stage at diagnosis.
Main outcomes and measures: Estimated HPV-associated cancer incidence rates for 2017 to 2021 and annual incidence rate trends between 2004 and 2021. Calculated incidence rate ratios (IRRs) and differences in average annual percentage change by Appalachian residence. Additional comparisons were made between Appalachian regions.
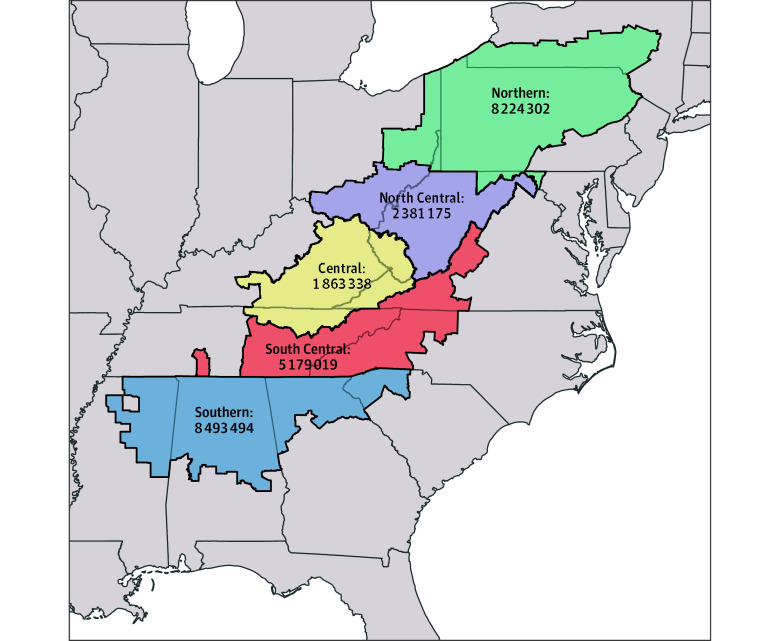
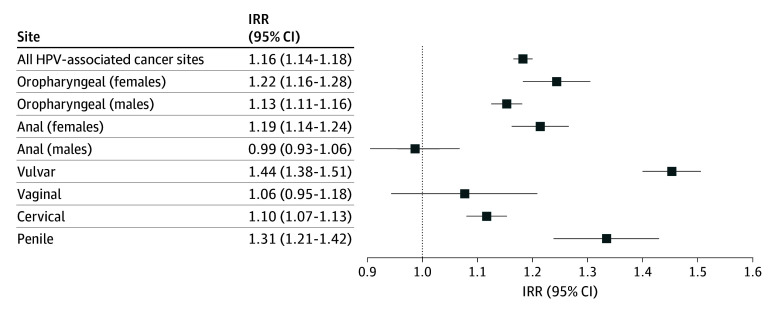
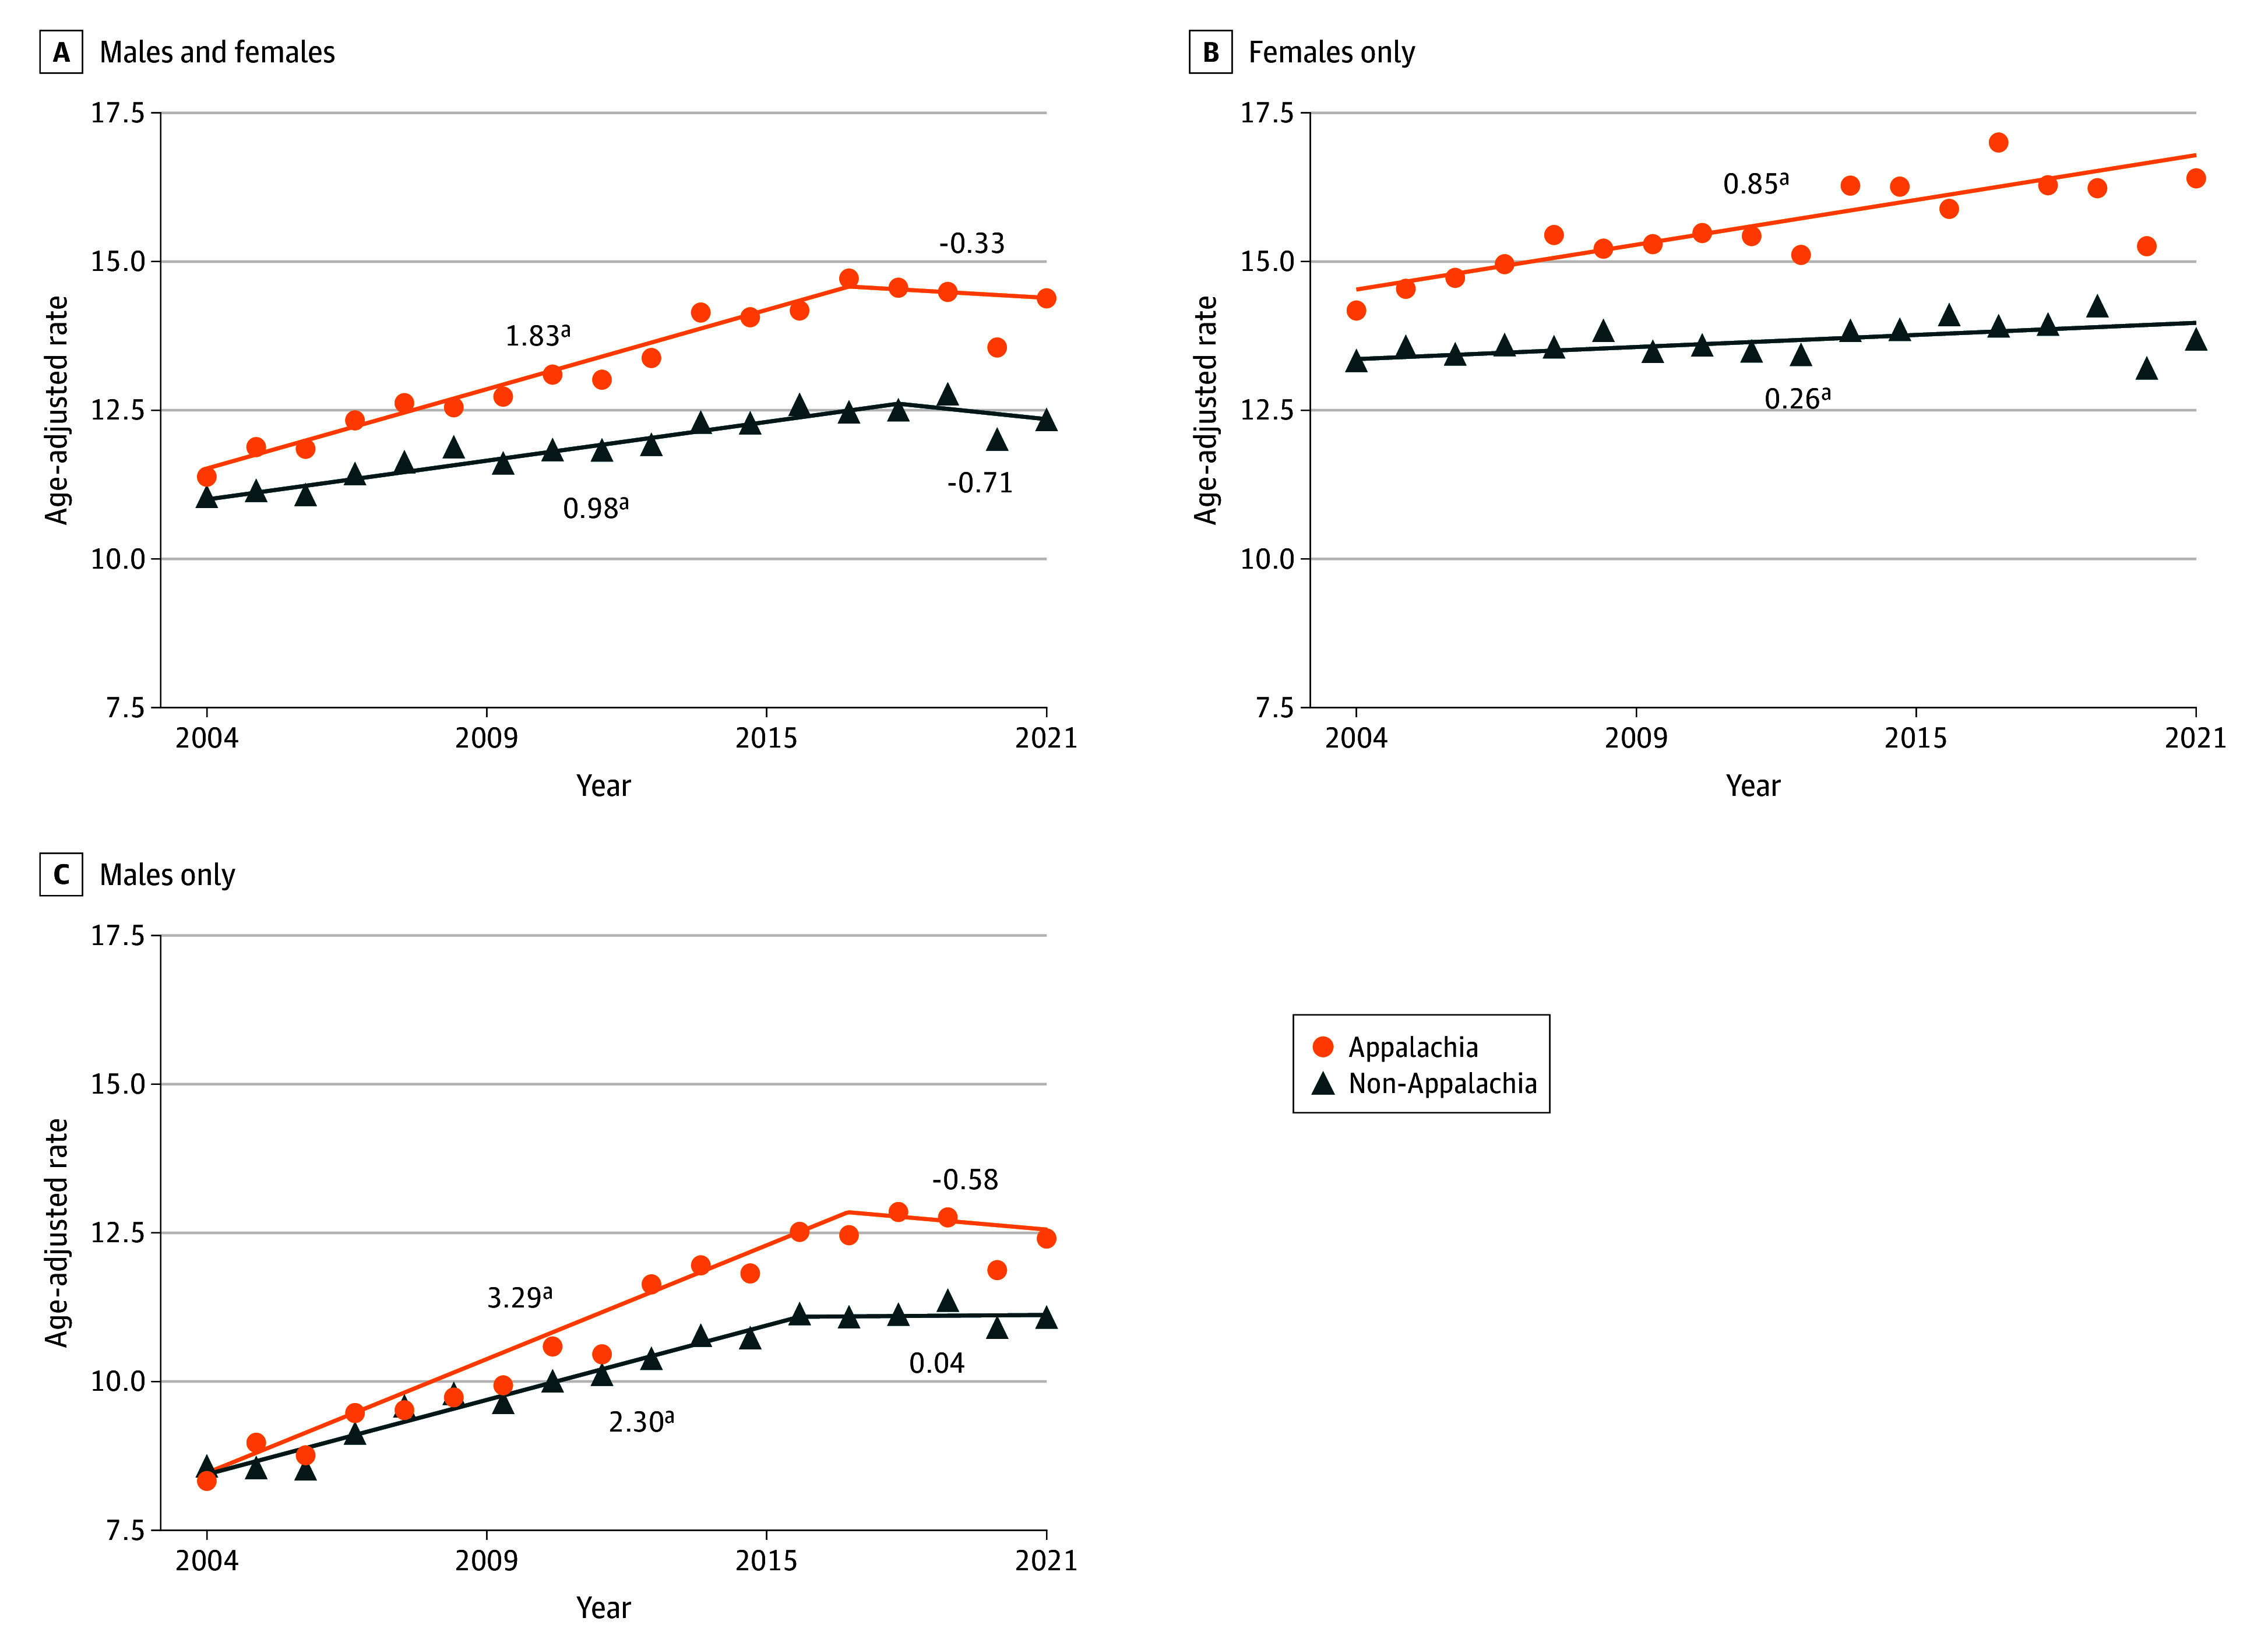
Results: From 2017 to 2021, there were 23 649 cases of HPV-associated cancer diagnosed among Appalachian residents (12 929 females [54.7%]). The overall HPV-associated cancer incidence was 16% higher among Appalachian residents than non-Appalachian residents (IRR, 1.16; 95% CI, 1.14-1.18). Higher site-specific rates among Appalachian residents were noted for all HPV-associated cancer sites, except vaginal cancer and male anal cancer, with the greatest disparity occurring for vulvar cancer (IRR, 1.44; 95% CI, 1.38-1.51). Human papillomavirus-associated cancer incidence increased significantly faster in Appalachia vs non-Appalachia between 2004 and 2021 (average annual percentage change, 1.3% per year [95% CI, 1.0%-1.6% per year]; vs 0.7% per year [95% CI, 0.4%-1.0% per year]; P = .004), with the most marked trend difference occurring for penile cancer (2.1% faster per year in Appalachia; P = .003). Within Appalachia, the highest HPV-associated incidence rates per 100 000 persons were observed in the North Central (16.9 [95% CI, 16.2-17.6]) and Central (16.9 [95% CI, 16.1-17.7]) subregions.
Conclusions and relevance: This cross-sectional study of HPV-associated cancer incidence found disproportionately high HPV-associated cancer rates among Appalachian residents compared with non-Appalachian residents. These findings highlight the need for targeted efforts to improve HPV vaccine uptake and encourage adherence to evidence-based screening guidelines for HPV-associated cancers in Appalachia.
Conflict of interest statement
Figures
References
-
- Appalachian Regional Commission. Accessed March 15, 2024. https://www.arc.gov/
Publication types
MeSH terms
Grants and funding
LinkOut - more resources
Full Text Sources
Medical
