. 2025 Jun 30:14:RP104461.
doi: 10.7554/eLife.104461.

Tissue-specific responses to TFAM and mtDNA copy number manipulation in prematurely ageing mice

Affiliations

Tissue-specific responses to TFAM and mtDNA copy number manipulation in prematurely ageing mice

Laura Sophie Kremer et al. Elife. .

Abstract

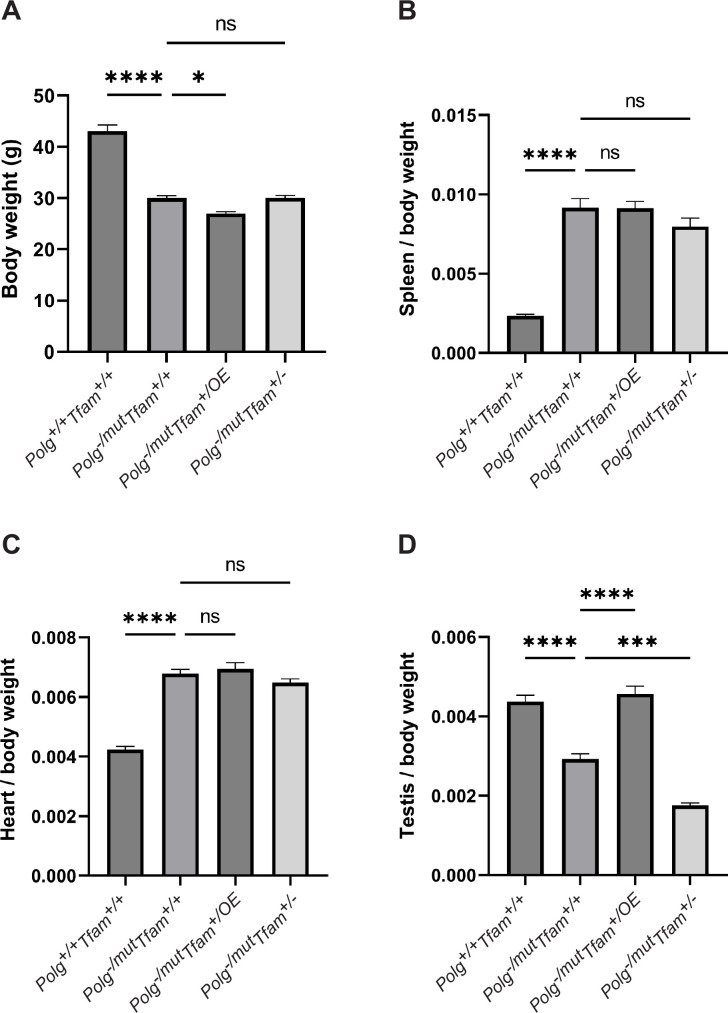
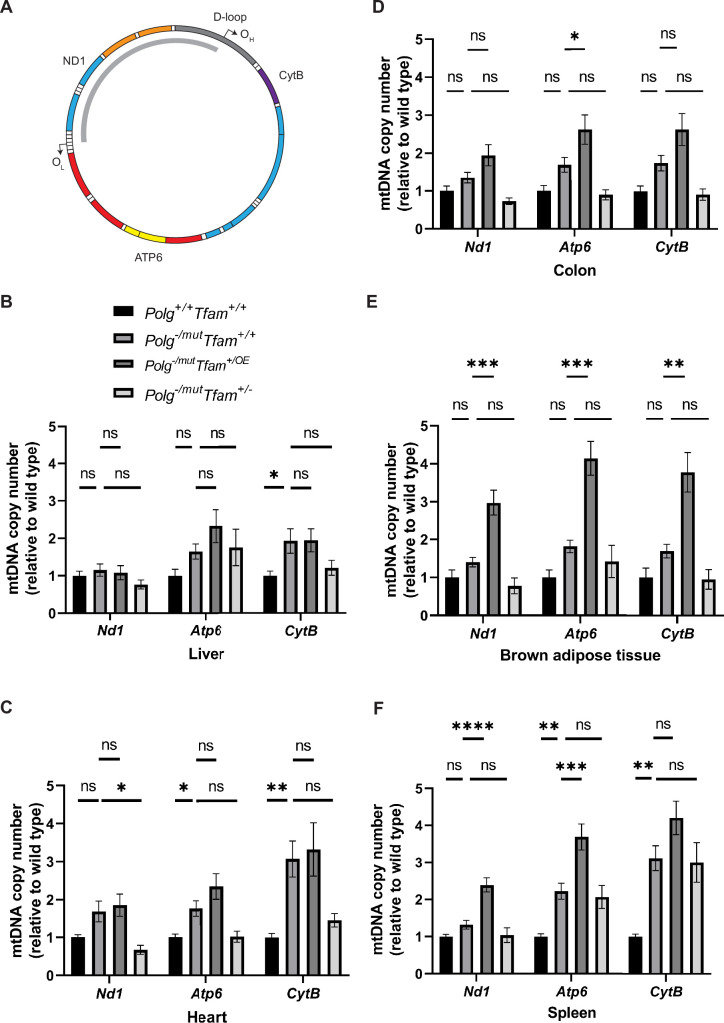
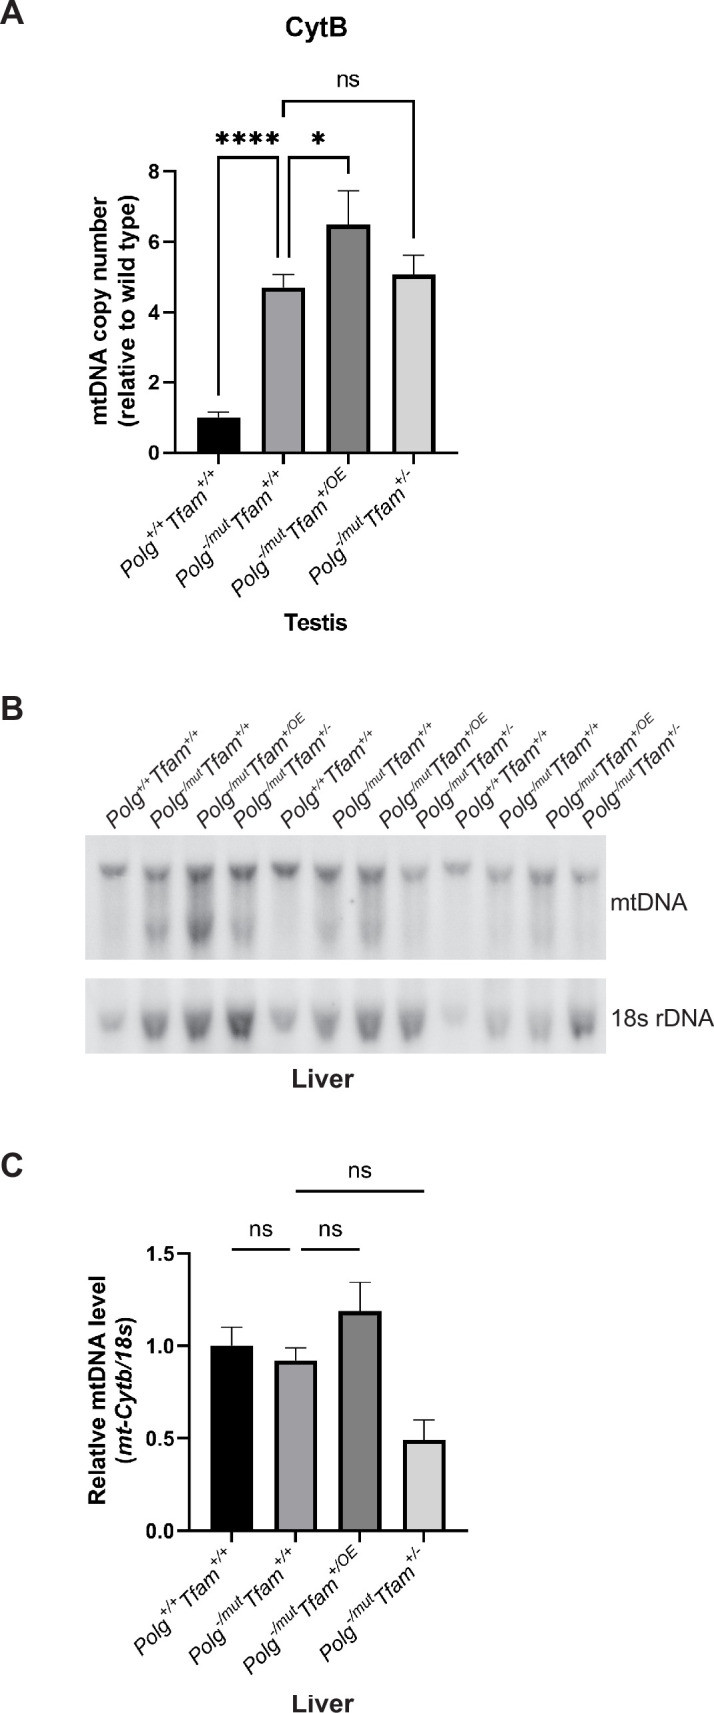
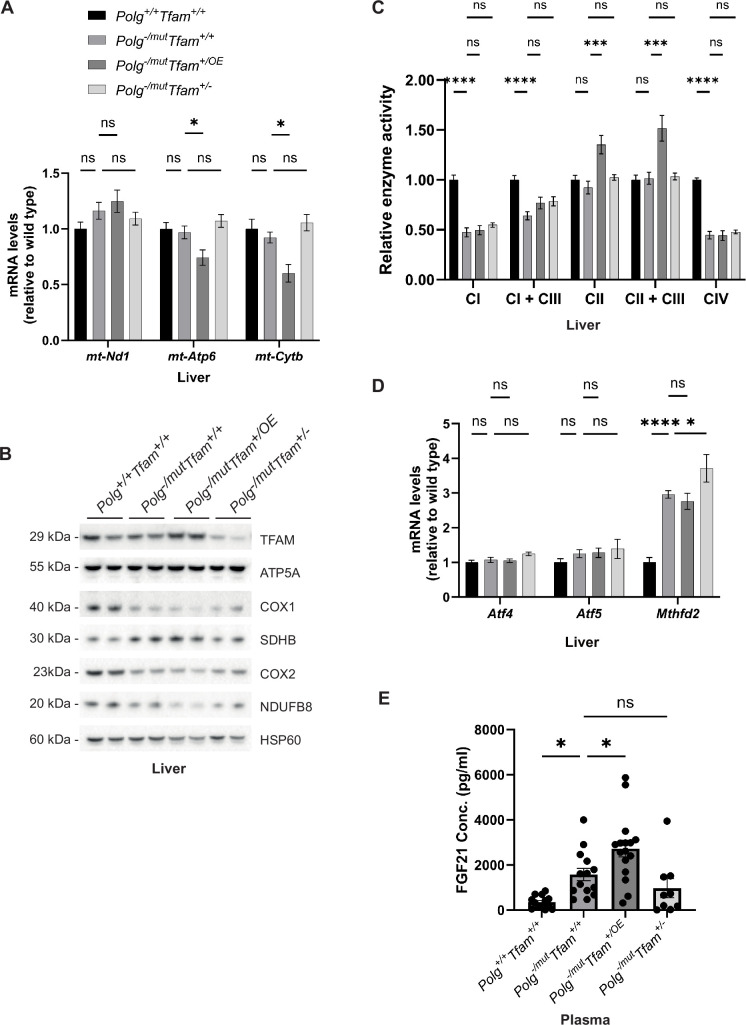
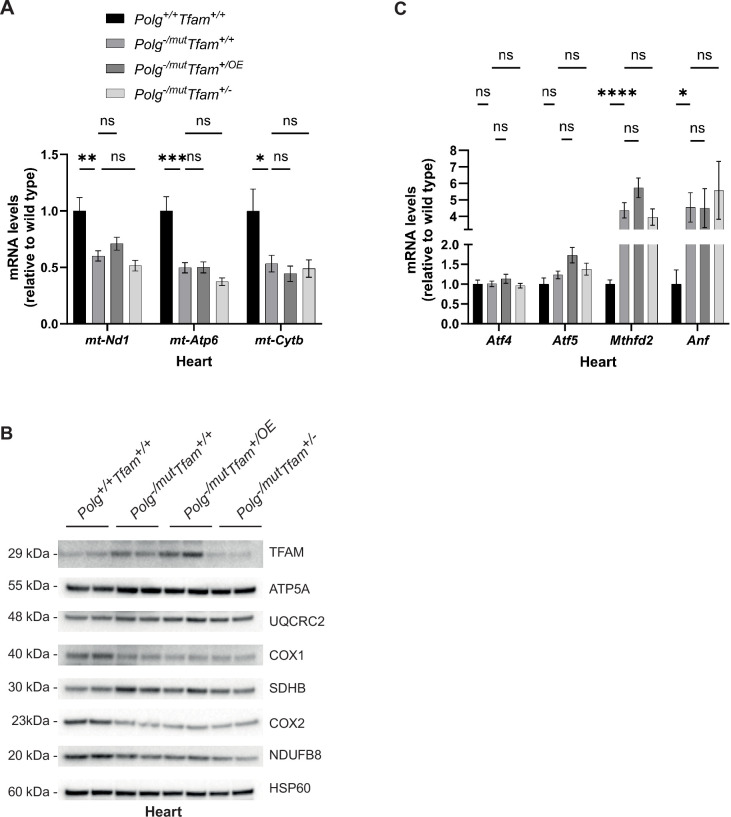
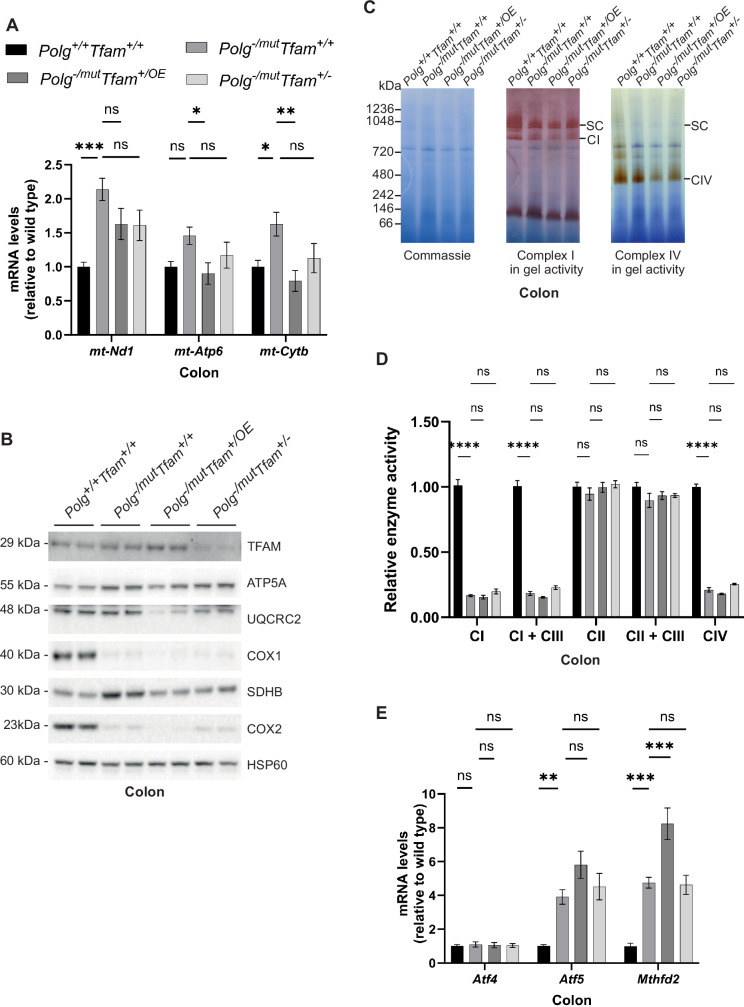
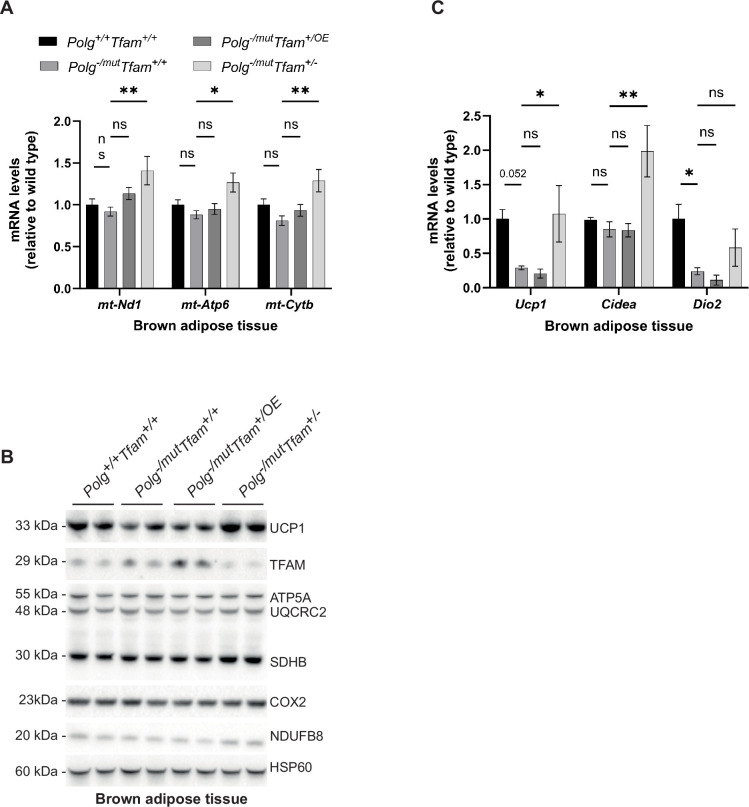
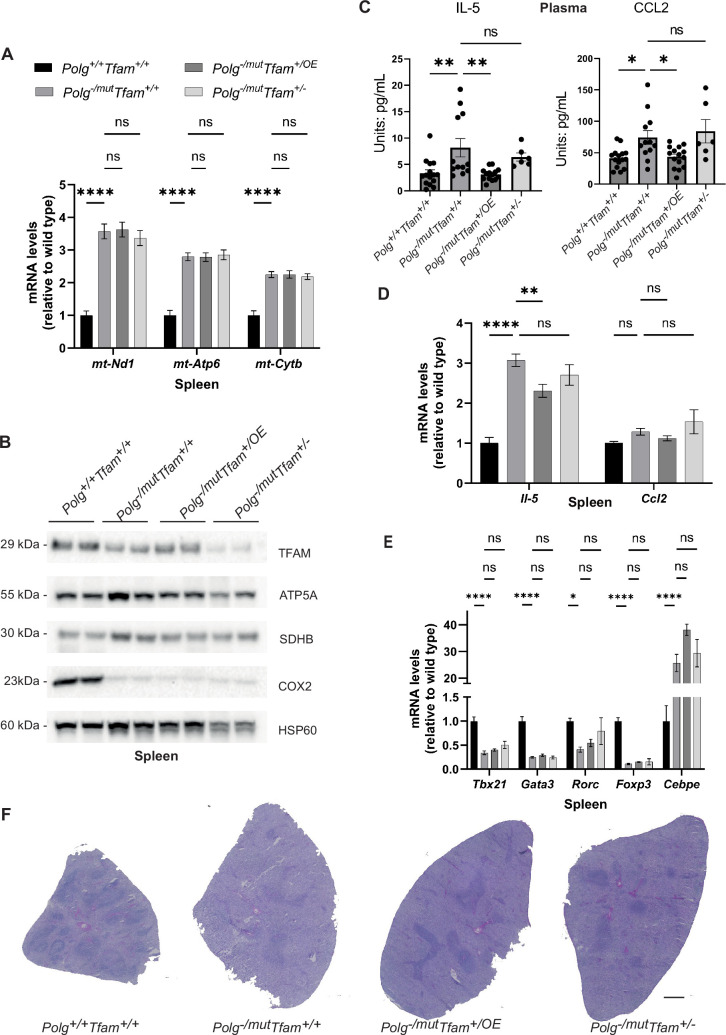
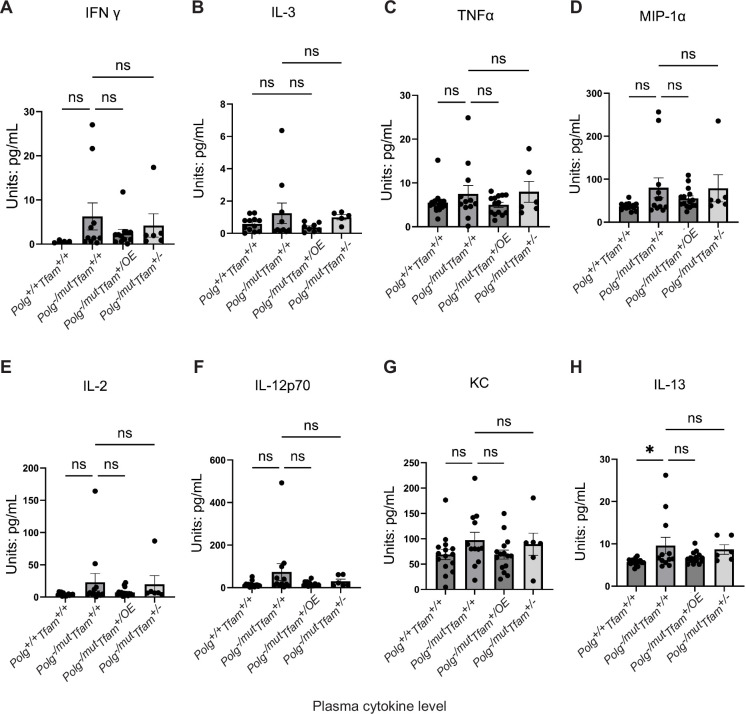
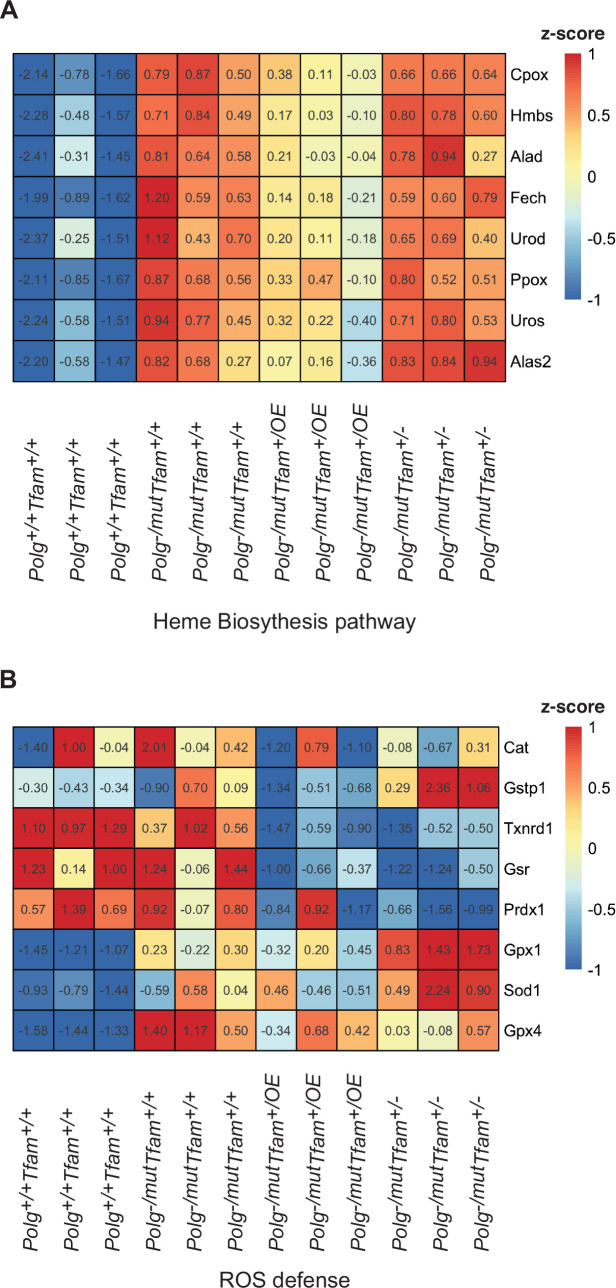
Somatic mitochondrial DNA (mtDNA) mutations are implicated as important drivers of ageing and age-related diseases. Their pathological effect can be counteracted by increasing the absolute amount of wild-type mtDNA via moderately upregulating TFAM, a protein important for mtDNA packaging and expression. However, strong TFAM overexpression can also have detrimental effects as it results in mtDNA hypercompaction and subsequent impairment of mtDNA gene expression. Here, we have experimentally addressed the propensity of moderate TFAM modulation to improve the premature ageing phenotypes of mtDNA mutator mice, carrying random mtDNA mutations. Surprisingly, we detect tissue-specific endogenous compensatory mechanisms acting in mtDNA mutator mice, which largely affect the outcome of TFAM modulation. Accordingly, moderate overexpression of TFAM can have negative and beneficial effects in different tissues of mtDNA mutator mice. We see a similar behavior for TFAM reduction, which improves brown adipocyte tissue homeostasis, while other tissues are unaffected. Our findings highlight that the regulation of mtDNA copy number and gene expression is complex and causes tissue-specific effects that should be considered when modulating TFAM levels. Additionally, we suggest that TFAM is not the sole determinant of mtDNA copy number in situations where oxidative phosphorylation (OXPHOS) is compromised, but other important players must be involved.

Keywords: biochemistry; chemical biology; genetics; genomics; mitochondrial DNA; mouse; mtDNA copy number; mtDNA mutations; tissue specificity.


Conflict of interest statement

LK, GG, GR, RF, MM, RW, ÁV, CK No competing interests declared, NL is the inventor of the C5024T mutant mouse licensed to the pharmaceutical industry by the Max Planck Society, and is a scientific founder of Pretzel Therapeutics Inc and owns stock in this company

Figures

Figure 1.
Figure 1.. Mitochondrial transcription factor A (TFAM) modulation does not rescue the decreased body weight or the increased spleen/body weight and heart/body weight ratio.
(A) Body weight in g. (B) Spleen to body weight ratio (g/g). (C) Heart to body weight ratio (g/g). (D) Testis to body weight ratio (g/g). n≥7. Data are represented as mean ± SEM; *p<0.05; **p<0.01; ***p<0.001; ns: non-significant.
Figure 1—figure supplement 1.
Figure 1—figure supplement 1.. Mating strategy to generate mitochondrial DNA (mtDNA) mutator mice in combination with the Tfam+/OE or Tfam+/- alleles.
Figure 2.
Figure 2.. Modulation of mitochondrial transcription factor A (TFAM) expression affects mitochondrial DNA (mtDNA) copy number in a tissue-specific manner.
(A) Schematic of the mtDNA highlighting the position of the probes used for mtDNA copy number analysis by qPCR. The deleted mtDNA region is indicated with a gray arc. (B–F) Relative mtDNA copy number quantification (Nd1/18 S, Atp6/18 S, Cytb/18 S) in (B) liver, (C) heart, (D) colon, (E) brown adipose tissue, and (F) spleen. n≥5. Data are represented as mean ± SEM; *p<0.05; **p<0.01; ***p<0.001; ns: non-significant.
Figure 2—figure supplement 1.
Figure 2—figure supplement 1.. Quantification of mitochondrial DNA (mtDNA) levels by qPCR in testis and by Southern blot analysis in liver.
(A) Relative mtDNA copy number quantification (Cytb/18 S) by qPCR in testis. n≥5. Data are represented as mean ± SEM; *p<0.05; **p<0.01; ***p<0.001; ns: non-significant. (B) Southern blot analysis of SacI-digested DNA derived from the liver. mtDNA was quantified by radiolabeling with a specific probe against Cytochrome b (Cytb), nuclear DNA was probed with a specific probe against 18 S rDNA. (C) Relative Southern blot quantification (mtDNA/18 S rDNA); ns: non-significant.
Figure 3.
Figure 3.. Moderate mitochondrial transcription factor A (TFAM) overexpression negatively impacts mitochondrial DNA (mtDNA) gene expression and tissue physiology in liver and correlates with increased fibroblast growth factor 21 (FGF21) levels.
(A) Relative expression levels of mtDNA-encoded transcripts (Nd1-actin, Atp6-actin, Cytb-actin) measured by RT-qPCR in liver. n≥7. Data are represented as mean ± SEM; *p<0.05; **p<0.01; ***p<0.001; ns: non-significant. (B) Western blot analysis of steady-state levels of mitochondrial proteins in liver. (C) Relative enzyme activities of oxidative phosphorylation (OXPHOS) complexes measured by spectrophotometry in liver mitochondria. n≥6 Data are represented as means ± SEM; *p<0.05; **p<0.01; **p<0.01; ***p<0.001; ns: non-significant. (D) Relative expression levels of mitochondrial stress markers (Atf4-actin, Atf5-actin, Mthfd2-actin) measured by RT-qPCR in liver. n≥7. Data are represented as means ± SEM; *p<0.05; **p<0.01; ***p<0.001, ns: non-significant (E) Quantification of FGF21 levels in plasma measured by ELISA. n ≥ 9. Data are represented as means ± SEM; *p<0.05; **p<0.01; ***p<0.001; ns: non-significant.
Figure 4.
Figure 4.. Alteration of mitochondrial transcription factor A (TFAM) expression does not affect the heart phenotype of mitochondrial DNA (mtDNA) mutator mice.
(A) Relative expression levels of mtDNA-encoded transcripts (Nd1-actin, Atp6-actin, Cytb-actin) measured by RT-qPCR in heart. n ≥ 7. Data are represented as mean ± SEM; *p<0.05; **p<0.01; ***p<0.001; ns: non-significant. (B) Western blot analysis of steady-state levels of mitochondrial proteins in heart. (C) Relative expression levels of mitochondrial stress markers (Atf4-actin, Atf5-actin, Mthfd2-actin, Nppa-actin) measured by RT-qPCR in heart. n ≥ 7. Data are represented as mean ± SEM; *p<0.05; **p<0.01; ***p<0.001; ns: non-significant.
Figure 5.
Figure 5.. Increased mitochondrial transcription factor A (TFAM) levels do not rescue the reduced oxidative phosphorylation (OXPHOS) function in the colon of mitochondrial DNA (mtDNA) mutator mice.
(A) Relative expression levels of mtDNA-encoded transcripts (Nd1-actin, Atp6-actin, Cytb-actin) measured by RT-qPCR in colon. n≥7. Data are represented as mean ± SEM; *p<0.05; **p<0.01; ***p<0.001; ns: non-significant. (B) Western blot analysis of steady-state levels of mitochondrial proteins in colon. (C) BN-PAGE and in-gel activities of complex I and complex IV activities in mitochondrial protein extracts from mouse colon. Coomassie staining of the gel is shown to indicate equal loading. SC, Supercomplexes. (D) Relative enzyme activities of OXPHOS complexes measured by spectrophotometry in colon mitochondria. n≥3. Data are represented as mean ± SEM; *p<0.05; **p<0.01; ***p<0.001; ns: non-significant. (E) Relative expression levels of mitochondrial stress markers (Atf4-actin, Atf5-actin, Mthfd2-actin) measured by RT-qPCR in colon. n≥9. Data are represented as mean ± SEM; *p<0.05; **p<0.01; ***p<0.001; ns: non-significant.
Figure 6.
Figure 6.. Reduction of mitochondrial transcription factor A (TFAM) levels in brown adipose tissue has beneficial effects.
(A) Relative expression levels of mitochondrial DNA (mtDNA)-encoded transcripts (Nd1-actin, Atp6-actin, Cytb-actin) measured by RT-qPCR in brown adipose tissue (BAT). n≥5. Data are represented as mean ± SEM; *p<0.05; **p<0.01; ***p<0.001; ns: non-significant. (B) Western blot analysis of steady-state levels of UCP1 and mitochondrial proteins in BAT. (C) Relative expression levels of brown adipose stress markers (Ucp1-actin, Cidea-actin, Dio2-actin) measured by RT-qPCR in BAT. n≥5. Data are represented as mean ± SEM; *p<0.05; **p<0.01; ***p<0.001; ns: non-significant.
Figure 7.
Figure 7.. Mitochondrial transcription factor A (TFAM) overexpression restores IL-5 and Chemokine Ligand 2 (CCL2) cytokine levels in the spleen of mitochondrial DNA (mtDNA) mutator mice.
(A) Relative expression levels of mtDNA-encoded transcripts (Nd1-actin, Atp6-actin, Cytb-actin) measured by RT-qPCR in spleen. n≥5. Data are represented as mean ± SEM; *p<0.05; **p<0.01; ***p<0.001; ns: non-significant. (B) Western blot analysis of steady-state levels of mitochondrial proteins in spleen. (C) Quantification of IL-5 and CCL2 cytokine levels in plasma measured by the Mouse Cytokine/Chemokine 44-Plex Discovery Assay. n≥6. Data are represented as mean ± SEM; *p<0.05; **p<0.01; ***p<0.001; ns: non-significant. (D) Quantification of Il-5 and Ccl2 cytokine transcript levels in spleen measured by RT-qPCR. n≥10. Data are represented as mean ± SEM; *p<0.05; **p<0.01; ***p<0.001; ns: non-significant. (E) Relative expression levels of immune cell markers (Tbx21-actin, Gata3-actin, Rorc-actin, Foxp3-actin, Cebpe-actin) for analyzing immune cell populations measured by RT-qPCR in spleen. n≥5. Data are represented as mean ± SEM; *p<0.05; **p<0.01; ***p<0.001; ns: non-significant. (F) H&E staining of spleen sections. Scale bar: 500 µm.
Figure 7—figure supplement 1.
Figure 7—figure supplement 1.. Cytokine quantification in plasma measured by the Mouse Cytokine/Chemokine 44-Plex Discovery Assay.
(A) Interferon Gamma (IFNγ). (B) Interleukin 3 (IL-3). (C) Tumor Necrosis Factor Alpha (TNFα). (D) Macrophage Inflammatory Protein-1 Alpha (MIP-1α). (E) Interleukin 2 (IL-2). (F) Interleukin 12p70 (IL-12p70). (G) C-X-C Motif Chemokine Ligand 1 (KC). (H) Interleukin 13 (IL-13). n≥6. Data are represented as mean ± SEM; *p<0.05; **p<0.01; ***p<0.001; ns: non-significant.
Figure 7—figure supplement 2.
Figure 7—figure supplement 2.. Differential expression analysis of quantitative proteomic data from the spleen.
(A) Heatmap of proteins involved in the heme biosynthesis pathway. (B) Heatmap of proteins involved in reactive oxygen species (ROS) defense. Color indicates the z-score.

Update of

  • doi: 10.1101/2024.11.14.623694
  • doi: 10.7554/eLife.104461.1
  • doi: 10.7554/eLife.104461.2

Similar articles

References

    1. Ahlqvist KJ, Leoncini S, Pecorelli A, Wortmann SB, Ahola S, Forsström S, Guerranti R, De Felice C, Smeitink J, Ciccoli L, Hämäläinen RH, Suomalainen A. MtDNA mutagenesis impairs elimination of mitochondria during erythroid maturation leading to enhanced erythrocyte destruction. Nature Communications. 2015;6:1–11. doi: 10.1038/ncomms7494. - DOI - PubMed
    1. Alp PR, Newsholme EA, Zammit VA. Activities of citrate synthase and NAD+-linked and NADP+-linked isocitrate dehydrogenase in muscle from vertebrates and invertebrates. The Biochemical Journal. 1976;154:689–700. doi: 10.1042/bj1540689. - DOI - PMC - PubMed
    1. Ameur A, Stewart JB, Freyer C, Hagström E, Ingman M, Larsson N-G, Gyllensten U. Ultra-deep sequencing of mouse mitochondrial DNA: mutational patterns and their origins. PLOS Genetics. 2011;7:e1002028. doi: 10.1371/journal.pgen.1002028. - DOI - PMC - PubMed
    1. Bailey LJ, Cluett TJ, Reyes A, Prolla TA, Poulton J, Leeuwenburgh C, Holt IJ. Mice expressing an error-prone DNA polymerase in mitochondria display elevated replication pausing and chromosomal breakage at fragile sites of mitochondrial DNA. Nucleic Acids Research. 2009;37:2327–2335. doi: 10.1093/nar/gkp091. - DOI - PMC - PubMed
    1. Balducci L. Epidemiology of anemia in the elderly: information on diagnostic evaluation. Journal of the American Geriatrics Society. 2003;51:S2–S9. doi: 10.1046/j.1532-5415.51.3s.4.x. - DOI - PubMed

LinkOut - more resources