. 2025 Sep 1;199(1):kiaf289.
doi: 10.1093/plphys/kiaf289.

Light-regulated dual-targeting of NUCLEAR CONTROL OF PEP ACTIVITY establishes photomorphogenesis via interorganellar communication

Affiliations

Light-regulated dual-targeting of NUCLEAR CONTROL OF PEP ACTIVITY establishes photomorphogenesis via interorganellar communication

Jae-Hyung Lee et al. Plant Physiol. .

Abstract

Interorganellar communication is essential for maintaining cellular and organellar functions and adapting to dynamic environmental changes in eukaryotic cells. In angiosperms, light initiates photomorphogenesis, a developmental program characterized by chloroplast biogenesis and inhibition of hypocotyl elongation, through photoreceptors such as the red-/far-red-sensing phytochromes and their downstream signaling pathways. However, the mechanisms underlying nucleus-chloroplast crosstalk during photomorphogenesis remain elusive. Here, we show that light-regulated dual-targeting of NUCLEAR CONTROL OF PEP ACTIVITY (NCP) mediates bidirectional communication between the nucleus and chloroplasts via alternative promoter selection and retrograde translocation. Light promotes transcription from an upstream canonical transcription start site, producing a long NCP (NCP-L) isoform containing an N-terminal chloroplast transit peptide that directs chloroplast localization. In contrast, darkness or low red light conditions favor transcription from a downstream alternative start site, producing a shorter cytoplasmic isoform (NCP-S) that is rapidly degraded via the 26S proteasome. This light-regulated alternative transcription initiation depends on PHYTOCHROME-INTERACTING FACTORS (PIFs), key repressors of photomorphogenesis. Upon chloroplast import, NCP-L is processed into its mature form (NCPm), which promotes assembly and nucleoid localization of the plastid-encoded RNA polymerase (PEP) complex to initiate chloroplast biogenesis. Notably, NCP's nuclear function requires its prior localization to chloroplasts, supporting a model in which NCP mediates chloroplast-to-nucleus retrograde signaling. Consistent with this, NCP promotes stromule formation in Arabidopsis (Arabidopsis thaliana) hypocotyls, linking chloroplast dynamics to phytochrome-dependent nuclear pathways that restrict hypocotyl elongation. Our findings uncover an interorganellar communication mechanism in which light-dependent alternative promoter usage and retrotranslocation regulate photomorphogenesis, integrating nuclear and plastid signals to coordinate organ-specific developmental programs.


Conflict of interest statement

Conflict of interest statement. None declared.

Figures

Figure 1.
Figure 1.
Light regulates alternative TSSs in NCP via a PIF-dependent manner. A) Effect of light intensity on use of NCP alternative promoters. Col-0 plants were grown for 4 d under 70 μmol m−2 s−1 red light (R70), 20 μmol m−2 s−1 red light (R20), or true-dark conditions for 4 d before extracting total RNA from whole seedlings. The TSSs by 5′ RACE analysis were designated TSS1 (upper arrowhead) and TSS2 (lower arrowhead). PP2A was used as an internal control. B) Quantification of longer and shorter NCP transcripts. Quantification was performed using 5′ RACE-PCR in A). DNA blots on the 3 5′ RACE-PCR from biological triplicate samples were used for quantification. Blue and orange boxes indicate percentage of quantified band for the longer (NCP-L) and shorter (NCP-S) NCP transcripts, respectively. Error bars indicate Sd of the 3 biological replicates. C) Effect of PIF mutations on the alternative promoter usage in NCP. Col-0, pif1, pif3, and pifq plants were grown for 4 d under true-dark conditions before extracting total RNA from whole seedlings. Each transcription start site identified by 5′ RACE-PCR was marked as TSS1 (blue arrowhead) and TSS2 (orange arrowhead). PP2A was used as an internal control. D) Quantification of longer and shorter NCP transcripts in PIF-defective mutants. Quantification was performed using 3 independent 5′ RACE-PCR described in C). Blue and orange boxes indicate percentage of quantified band for the longer and shorter NCP transcripts, respectively. Error bars indicate Sd of the 3 biological replicates.
Figure 2.
Figure 2.
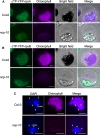
NCP-L and NCP-S protein isoforms show different subcellular localization. A) Distinct localization of NCP-L and NCP-S protein isoforms. The UBQ10pro:NCP-L-CFP-GUS and UBQ10pro:NCP-S-CFP-GUS fusion constructs were expressed transiently in N. benthamiana leaves. Fluorescence microscopy images of epidermal cells were visualized. DAPI was used to stain nuclei. Arrows indicate chloroplasts. Asterisks denote stromules. Plus signs (+) indicate nuclear signals. Arrowheads indicate cytoplasmic signals. Chlorophyll, autofluorescence. Scale bars, 20 μm. B) Subcellular localization of NCP-L and NCP-S isoforms in Arabidopsis mesophyll protoplasts. The same constructs used in A) were expressed transiently in Arabidopsis protoplasts and visualized by fluorescence microscopy. Arrows indicate CFP-GUS signals from chloroplasts. Arrowhead denotes cytoplasmic signals. Scale bars, 20 μm.
Figure 3.
Figure 3.
The NCP-L isoform is responsible for chloroplast biogenesis and hypocotyl elongation. A) The ncp-10 albino phenotype is rescued by expressing the wild-type NCP-L isoform (NCPpro:NCP-HA-His) and NCP-L with the 2nd ATG mutated NCP 2nd ATGm-HA-His. Col-0, ncp-10, NCPpro:NCP-HA-His/ncp-10, and NCPpro:NCP 2nd ATGm-HA-His/ncp-10 seedlings were grown under 20 μmol m−2 s−1 R light for 4 d. Scale bars, 1 mm. B) Transcript levels of PEP-dependent genes in NCP 2nd ATGm-HA-His ncp-10 plants. Seedlings were grown in 20 μmol m−2 s−1 R light for 4 d before harvesting whole seedlings for RNA extraction. Transcript levels were examined using RT-qPCR. Different letters denote statistically significant differences in the transcript levels (ANOVA, Tukey's honestly significant difference (HSD), P ≤ 0.001). Error bars represent the Sd of 3 biological replicates. C) The ncp-10 tall hypocotyl phenotype is rescued by expressing the wild-type NCP-L isoform (NCPpro:NCP-HA-His) and NCP-L with the 2nd ATG mutated NCP 2nd ATGm-HA-His. Col-0, ncp-10, NCPpro:NCP-HA-His/ncp-10, and NCPpro:NCP 2nd ATGm-HA-His/ncp-10 seedlings were grown under 50 μmol m−2s−1 R light for 4 d. Scale bars, 5 mm. D) Box-and-whisker plots showing hypocotyl measurements of the seedlings in C). Boxes indicate the 25th to 75th percentiles with median values shown as horizontal lines; whisker extends to the minimum and maximum values. No outliers are detected. Sample size (n): Col-0 (30), ncp-10 (31), NCP-HA-His/ncp-10 #30-3 (31), NCP-HA-His-ncp-10 #44-1 (32), NCP 2nd ATGm-HA-His/ncp-10 #22-8 (32), and NCP 2nd ATGm-HA-His/ncp-10 #15-1 (29). Different letters represent significant differences (P ≤ 0.001, 1-way ANOVA with posthoc Tukey's HSD test).
Figure 4.
Figure 4.
The NCP-S fails to rescue tall-and-albino phenotypes of ncp-10. A) The NCP-S fails to rescue the ncp-10 albino phenotype. Col-0, ncp-10, UBQ10pro:NCP-L-HA-His/ncp-10, and UBQ10pro:NCP-S-HA-His/ncp-10 seedlings were grown under 20 μmol m−2 s−1 R light condition for 4 d. Scale bars, 1 mm. B) Expression of NCP-S does not complement the tall hypocotyl phenotype of the ncp-10 mutant. Col-0, ncp-10, UBQ10pro:NCP-L-HA-His/ncp-10, and UBQ10pro:NCP-S-HA-His/ncp-10 seedlings were grown under 50 μmol m−2s−1 R light for 4 d. Scare bars, 5 mm. C) Box-and-whisker plots showing hypocotyl measurements of the seedlings in B). Boxes indicate the 25th to 75th percentiles with median values shown as horizontal lines; whisker extends to the minimum and maximum values. No outliers are detected. Sample size (n): Col-0 (37), ncp-10 (30), NCP-L-HA-His/ncp-10 #26-10 (35), NCP-L-HA-His/ncp-10 #28-5 (32), NCP-S-HA-His/ncp-10 #15-12 (31), and NCP-S-HA-His/ncp-10 #20-13 (35). Different letters represent significant differences (P ≤ 0.001, 1-way ANOVA with posthoc Tukey's HSD test).
Figure 5.
Figure 5.
The NCP-S isoform is degraded via the 26S proteasome-dependent pathway. A) 26S proteasome-dependent degradation of NCP-S protein. Three-day-old WL or dark-grown NCPpro:NCP-HA-His/ncp-10 seedlings were incubated without and with 50 μm MG132 and MG112 for 24 h under the same light conditions before extracting total proteins. An anti-HA antibody was used to detect NCP-HA-His protein isoforms. Actin was detected similarly as the loading control. In vitro translated (IVT) NCP full-length (FL) and N-terminal truncation fragments fused with HA-His were used as molecular size controls (black arrowheads). NCP-S-HA-His was marked as an orange arrowhead (left upper). Blue arrowhead (left lower) denotes NCPm-HA-His. B) Quantifications from 3 independent blots of NCPpro:NCP-HA-His/ncp-10 seedling samples shown in A) were averaged. Blue and orange boxes indicate the percentage of quantified bands for NCPm-HA-His and NCP-S-HA-His protein isoforms, respectively. Error bars indicate Sd. C) Transcript levels of NCP-HA-His transgene. Col-0, UBQ10pro:NCP-L-HA-His/ncp-10, and UBQ10pro:NCP-S-HA-His/ncp-10 seedlings were grown under 50 μmol m−2 s−1 R light condition for 4 d and harvested for total RNA extraction. Transcript levels were examined using RT-qPCR. Different letters denote statistically significant differences in the transcript levels (ANOVA, Tukey's HSD, P ≤ 0.001). Error bars represent the Sd of 3 biological replicates. Nd, not detectable. D) NCP-S degradation by 26S proteasome. Three-day-old Col-0, UBQ10pro:NCP-L-HA-His/ncp-10, and UBQ10pro:NCP-S-HA-His/ncp-10 seedlings were incubated without and with 50 μm MG132 for 24 h before extracting total proteins from whole seedlings. Anti-HA antibody was used to detect NCPm-HA-His and NCP-S-HA-His proteins. Actin was used as a loading control. Numbers indicate the relative protein level normalized to the actin level.
Figure 6.
Figure 6.
Condensed localization of rpoA and rpoB in nucleoids is impaired in ncp-10. A and B) Impaired localization pattern of rpoA and rpoB in ncp-10 protoplast. The coding sequence of N-terminal chloroplast transit peptide (cTP) of RBCS1A was transcriptionally fused to 5′ end of YFP-rpoA and YFP-rpoB coding sequences under the control of CaMV 35S promoter. The cTP-YFP-rpoA A) and cTP-YFP-rpoB B) constructs were expressed transiently in Arabidopsis protoplasts, and the chloroplasts were visualized by fluorescence microscopy. Scale bars, 10 μm. C) Nucleoids were visualized by DAPI in Col-0 and ncp-10 protoplasts. Arrows indicate nucleoids. Empty arrowhead indicates the nucleus. Chlorophyll, autofluorescence. Scale bars, 20 μm.
Figure 7.
Figure 7.
NCP requires its prior chloroplast localization to rescue the tall hypocotyl phenotype of ncp-10. A) Defect of nuclear accumulation of NCPΔ48 is restored by fusing the chloroplast transit peptide (cTP) of RBCS1A. The UBQ10pro:NCP-L-CFP-GUS, UBQ10pro:NCPΔ48-CFP-GUS, and UBQ10pro:cTP-NCPΔ48-CFP-GUS fusion constructs were expressed transiently in N. benthamiana leaves. The nucleus and chloroplasts were visualized by fluorescence microscopy. Arrows indicate chloroplasts. Asterisks and plus signs (+) denote stromules and the nucleus, respectively. Arrowheads indicate signals from the cytoplasm. Chlorophyll, autofluorescence. Scale bars, 10 μm. B) Fusing the chloroplast transit peptide (cTP) of RBCS1A with NCPΔ48 rescues the tall hypocotyl phenotype of the ncp-10. Col-0, ncp-10, NCP-L-HA-His/ncp-10 #28-5, UBQ10pro:NCPΔ48-HA-His/ncp-10, and UBQ10pro:cTP-NCPΔ48-HA-His/ncp-10 seedlings were grown under 50 μmol m−2s−1 R light for 4 d. Scare bars, 5 mm. Box-and-whisker plots showing hypocotyl measurements of the seedlings grown under 1 μmol m−2s−1 R light C) and 50 μmol m−2s−1 R light D). Boxes indicate the 25th to 75th percentiles with median values shown as horizontal lines; whisker extends to the minimum and maximum values. No outliers are detected. Sample size for C and D) (n): Col-0 (25, 32), ncp-10 (21, 27), NCP-L-HA-His/ncp-10 #28-5 (24, 30), NCPΔ48-HA-His/ncp-10 #13-7 (19, 30), NCPΔ48-HA-His/ncp-10 #29-4 (23, 30), cTP-NCPΔ48-HA-His/ncp-10 #10-5 (24, 32), and cTP-NCPΔ48-HA-His/ncp-10 #16-2 (24, 31). Different letters represent significant differences (P ≤ 0.001, 1-way ANOVA with posthoc Tukey's HSD test).
Figure 8.
Figure 8.
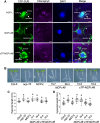
NCP sends the signal back to the nucleus potentially via stromules in Arabidopsis hypocotyl. A) NCP-mediated stromule induction in Arabidopsis hypocotyl. The UBQ10pro:cTP-CFP/Col-0 and UBQ10pro:NCP-CFP/Col-0 plants were grown for 4 d under 50 μmol m−2 s−1 red light (R50). Fluorescence microscopy images of hypocotyl cells were visualized. DAPI was used for staining nuclei. Arrows and asterisks indicate chloroplasts and stromules, respectively. Plus signs (+) denote signals from the nucleus. Chlorophyll, autofluorescence. Scale bars, 10 μm. B) Expressing NCP-CFP exhibits enhanced stromule induction. Seedling growth conditions are as described in A). Fluorescence microscopy images of hypocotyl cells were visualized. Arrows indicate stromules. Scale bars, 10 μm. C) Quantification of stromules from experiments described in A) and B) reveals an enhanced frequency of stromules in NCP-CFP-expressing plants compared with the cTP-CFP control plants. Three biological replicates, each consisting of 11 seedlings, were averaged. Bars indicate Sd. **Indicates a statistically significant difference (Student's t-test, P < 0.01).
Figure 9.
Figure 9.
Nucleus–chloroplast interorganellar communication via an NCP-mediated signaling cascade. Light triggers chloroplast differentiation by controlling PIF-dependent alternative promoter usage in NCP, producing chloroplast-targeted NCP-L. Upon cleavage of transit peptide and additional proteolytic processing, the NCPm promotes PEP assembly on nucleoids to initiate chloroplast biogenesis. NCPm translocates to the nucleus, potentially through direct connections via stromules. We propose that NCPm sends the signal back to the nucleus to maintain PHY signaling, thereby inhibiting hypocotyl growth during photomorphogenesis.

Similar articles

References

    1. Alfonso-Gonzalez C, Hilgers V. (Alternative) transcription start sites as regulators of RNA processing. Trends Cell Biol. 2024:34(12):1018–1028. 10.1016/j.tcb.2024.02.010 - DOI - PubMed
    1. Archibald JM. Endosymbiosis and eukaryotic cell evolution. Curr Biol. 2015:25(19):R911–R921. 10.1016/j.cub.2015.07.055 - DOI - PubMed
    1. Ayoubi TAY, Van De Ven WJM. Regulation of gene expression by alternative promoters. FASEB J. 1996:10(4):453–460. 10.1096/fasebj.10.4.8647344 - DOI - PubMed
    1. Börner T, Aleynikova AY, Zubo YO, Kusnetsov VV. Chloroplast RNA polymerases: role in chloroplast biogenesis. Biochim Biophys Acta. 2015:1847(9):761–769. 10.1016/j.bbabio.2015.02.004 - DOI - PubMed
    1. Brunkard JO, Runkel AM, Zambryski P. Visualizing stromule frequency with fluorescence microscopy. J Vis Exp. 2016:(117):e54692. 10.3791/54692 - DOI - PMC - PubMed

MeSH terms

Substances