Comparative Study
. 2025 Jun 30;21(6):e1013317.
doi: 10.1371/journal.ppat.1013317. eCollection 2025 Jun.

Resolving the APN controversy in PEDV infection: Comparative kinetic characterization through single-virus tracking

Affiliations
Comparative Study

Resolving the APN controversy in PEDV infection: Comparative kinetic characterization through single-virus tracking

Da An et al. PLoS Pathog. .

Abstract

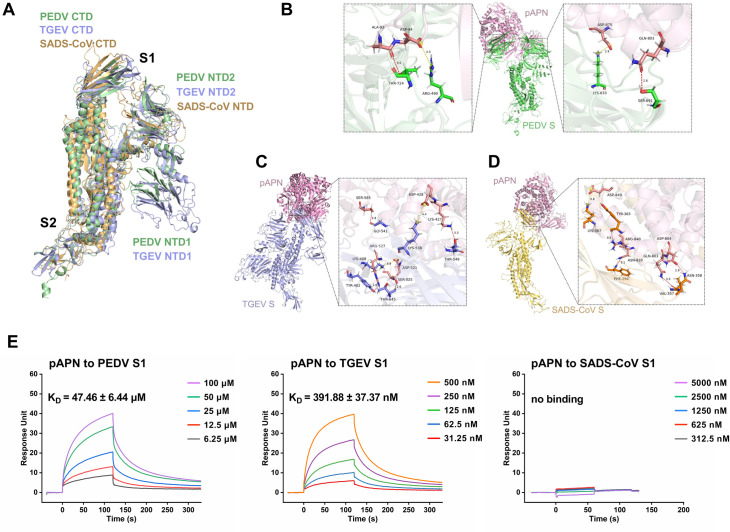
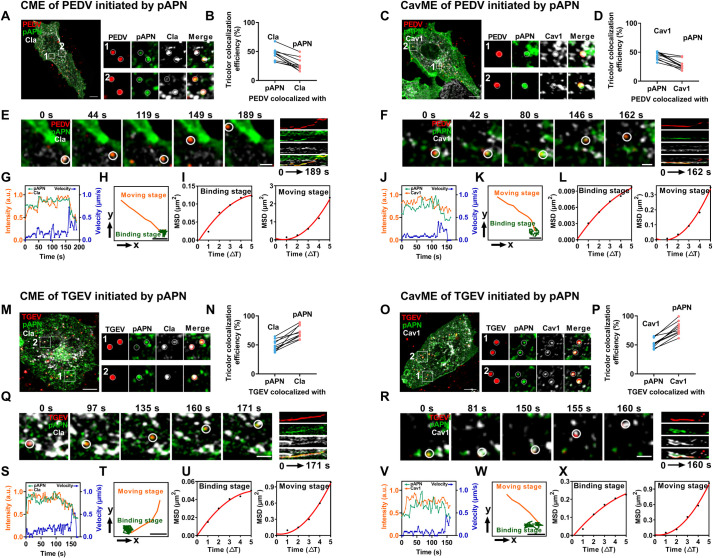
Aminopeptidase N (APN) plays multiple roles in various physiological processes, with its function as a viral receptor in several coronaviruses being one of the most prominent. However, the role of porcine APN (pAPN) in porcine epidemic diarrhea virus (PEDV) has remained controversial. Single-virus tracking enables a more comprehensive dynamic dissection of pAPN utilization during virus entry. In this study, a comparative analysis of pAPN usage by PEDV, transmissible gastroenteritis virus (TGEV), and swine acute diarrhea syndrome coronavirus (SADS-CoV) provides more precise and quantitative insights into pAPN's specific role in PEDV entry. Here, we used molecular docking and surface plasmon resonance (SPR) to demonstrate that pAPN binds to PEDV, with lower affinity than to TGEV. However, pAPN facilitates PEDV replication through internalization only in susceptible cells, not in non-susceptible cells. Using single-virus tracking, we observed that pAPN triggers PEDV internalization via clathrin- and caveolae-mediated endocytosis, resembling a receptor-mediated process. pAPN participates in 35% of PEDV internalization events, but mediates 80% of TGEV internalization, with pAPN-mediated PEDV internalization occurring approximately 60 s slower than TGEV. The dynamic differences in the internalization of PEDV and TGEV mediated by pAPN primarily arise during the binding stage prior to the initiation of accelerated directional movement, whereas their durations of movement are comparable. Additionally, we found that the internalization dynamics of porcine deltacoronavirus (PDCoV), which also uses pAPN as a receptor, are similar to those of TGEV. These findings resolve the controversy surrounding pAPN's role in PEDV entry, and highlight the dynamic differences in PEDV, TGEV, PDCoV, and SADS-CoV internalization via pAPN at single-virus level, providing a novel theoretical basis for the potential receptor evaluation from kinetic perspective, which could significantly contribute to the development of strategies against future PEDV outbreaks.


Conflict of interest statement

The authors have declared that no competing interests exist.

Figures

Fig 1
Fig 1. Binding affinity of pAPN with the S proteins of PEDV, TGEV, and SADS-CoV revealed by docking structure and SPR.
(A) Structural alignment of the S proteins from PEDV, TGEV and SADS-CoV. (B) Docking structure and atomic details illustrating the interaction between PEDV S protein (green) and pAPN (pink). (C) Docking structure and atomic details illustrating the interaction between TGEV S protein (purple) and pAPN (pink). (D) Docking structure and atomic details illustrating the interaction between SADS-CoV S protein (yellow) and pAPN (pink). Contacting residues are represented as sticks, with hydrogen bonds shown as red lines and salt bridges as yellow lines. (E) Binding affinities of pAPN to the S1 proteins of PEDV, TGEV, and SADS-CoV measured by SPR.
Fig 2
Fig 2. The role of pAPN in the infection of PEDV, TGEV and SADS-CoV.
(A) Effect of pAPN on PEDV, TGEV, and SADS-CoV infection in IPI-2I-APN-/- cells and IPECs. Cells were infected with PEDV, TGEV and SADS-CoV (MOI = 0.1) in the presence of 5 μg/mL trypsin. The N proteins of PEDV, TGEV and SADS-CoV were stained using IFA at 24 hpi. Scale bar, 50 μm. (B) Mean intensity of the N protein from (A) was quantified (n = 5 cells; mean ± SD). (C) IPI-2I-APN-/- cells re-expressing pAPN were infected with PEDV, TGEV and SADS-CoV (MOI = 0.1), and relative viral RNA levels were quantified by RT-qPCR at 24 hpi (n = 3 independent experiments; mean ± SD). (D) Western blotting of N proteins in IPI-2I-APN-/- cells re-expressing pAPN after infection with PEDV, TGEV and SADS-CoV (MOI = 0.1) at 24 hpi. (E) Relative density of the N proteins from (D) (n = 3 independent experiments; mean ± SD). Non-transfected infected cells served as controls in all independent experiments. Two-tailed P-values were calculated by unpaired Student’s t test. P < 0.05 was considered significant (ns P ≥ 0.05, *P < 0.05, **P < 0.01, ***P < 0.001, ****P < 0.0001).
Fig 3
Fig 3. pAPN promotes PEDV and TGEV internalization rather than attachment.
(A-F) The roles of pAPN in the attachment (0 mpi) and internalization (60 mpi) of PEDV, TGEV, and SADS-CoV were assessed using RT-qPCR (n = 4 experiments; mean ± SD). Control represents the viral RNA levels in cells without pAPN transfection. (G and H) Colocalization fluorescence imaging of DiD-PEDV, DiD-TGEV and DiD-SADS-CoV with pAPN during the attachment and internalization stages. Scale bar, 10 µm. (I) Colocalization analysis of DiD-PEDV, DiD-TGEV and DiD-SADS-CoV with pAPN in (G and H) (three experiments; n = 5 cells; mean ± SD). (J and K) The number of particles of the three viruses per cell during the attachment and internalization stages. Two-tailed P-values were calculated using an unpaired Student’s t test. P < 0.05 was considered significant (ns P ≥ 0.05, *P < 0.05, **P < 0.01, ***P < 0.001, ****P < 0.0001).
Fig 4
Fig 4. pAPN mediates PEDV and TGEV internalization via CME and CavME.
(A-D) Colocalization images and triple-color colocalization ratio of PEDV, pAPN and Cla/Cav1 at 60 mpi. Scale bar, 10 µm. (E and F) Time-lapse images and kymographs (DiD-PEDV: red; pAPN: green; Cla/Cav1: white) showing PEDV internalization via CME and CavME initiated by pAPN. Scale bar, 2 µm. (G) Fluorescence intensities (green and orange lines) and velocities (blue line) of the circled PEDV in (E). (H) Trajectories of the circled PEDV in (E), showing the binding stage (green) and moving stage (orange). Scale bar, 2 µm. (I) MSD plots of the circled PEDV during the binding stage and moving stage in (E). (J) Fluorescence intensities (green and orange lines) and velocities (blue line) of the circled PEDV in (F). (K) Trajectories of the circled PEDV in (F), showing the binding stage (green) and moving stage (orange). Scale bar, 2 µm. (L) MSD plots of the circled PEDV during the binding stage and moving stage in (F). (M-P) Colocalization images and triple-color colocalization ratio of TGEV, pAPN and Cla/Cav1 at 60 mpi. Scale bar, 10 µm. (Q and R) Time-lapse images and kymographs (DiD-TGEV: red; pAPN: green; Cla/Cav1: white) showing TGEV internalization via CME and CavME initiated by pAPN. Scale bar, 2 µm. (S) Fluorescence intensities (green and orange lines) and velocities (blue line) of the circled TGEV in (Q). (T) Trajectories of the circled TGEV in (Q), showing the binding stage (green) and moving stage (orange). Scale bar, 2 µm. (U) MSD plots of the circled TGEV during the binding stage and moving stage in (Q). (V) Fluorescence intensities (green and orange lines) and velocities (blue line) of the circled TGEV in (R). (W) Trajectories of the circled TGEV in (R), showing the binding stage (green) and moving stage (orange). Scale bar, 2 µm. (X) MSD plots of the circled TGEV during the binding stage and moving stage in (R).
Fig 5
Fig 5. Dynamics of PEDV, TGEV, and SADS-CoV internalization.
(A) Time-lapse images and kymographs of PEDV internalization mediated by pAPN. (B) pAPN fluorescence intensities (green line) and velocities (orange line) of the circled PEDV in (A). (C) Trajectories of the circled PEDV in (A), showing the binding stage (blue) and moving stage (red). (D and E) MSD plots of the circled PEDV during the binding stage and the moving stage in (A). (F) Time-lapse images and kymographs of TGEV internalization mediated by pAPN. (G) pAPN fluorescence intensities (green line) and velocities (orange line) of the circled TGEV in (F). (H) Trajectories of the circled TGEV in (F), showing the binding stage (blue) and moving stage (red). (I and J) MSD plots of the circled TGEV during the binding stage and the moving stage in (F). (K) Time-lapse images and kymographs of SADS-CoV internalization. (L) pAPN fluorescence intensities (green line) and velocities (orange line) of the circled SADS-CoV in (K). (M) Trajectories of the circled SADS-CoV in (K), showing the binding stage (blue) and moving stage (red). (N and O) MSD plots of the circled SADS-CoV during the binding stage and the moving stage in (K). Scale bar, 2 µm.
Fig 6
Fig 6. Duration and proportion of internalization events mediated by pAPN.
(A) Internalization durations of PEDV (n = 15), TGEV (n = 16) and PDCoV (n = 15) mediated by pAPN. (B) Binding durations of PEDV, TGEV and PDCoV mediated by pAPN. (C) Moving durations of PEDV, TGEV, and PDCoV mediated by pAPN. (D-G) Proportion of pAPN-dependent (PEDV: n = 15; TGEV: n = 16; PDCoV: n = 15; SADS-CoV: n = 0) and pAPN-independent (PEDV: n = 28; TGEV: n = 4; PDCoV: n = 5; SADS-CoV: n = 10) internalization events. Two-tailed P-values were calculated by unpaired Student’s t test. P < 0.05 was considered significant.
Fig 7
Fig 7. Schematic of PEDV, TGEV and SADS-CoV entry mediated by pAPN. pAPN plays distinct roles in the entry of PEDV, TGEV and SADS-CoV. (A) Initially, PEDV and TGEV but not SADS-CoV, recruit pAPN after adhesion to the cell surface via attachment receptors. (B) After binding, pAPN mediates more efficient TGEV internalization compared to PEDV. (C) Finally, PEDV, TGEV and SADS-CoV undergo fusion in the late endosomes/lysosomes after intracellular trafficking. The image was created using the website https://app.biorender.com/.

Similar articles

References

    1. Mina-Osorio P. The moonlighting enzyme CD13: old and new functions to target. Trends Mol Med. 2008;14(8):361–71. doi: 10.1016/j.molmed.2008.06.003 - DOI - PMC - PubMed
    1. Delmas B, Gelfi J, L’Haridon R, Vogel, Sjöström H, Norén LH, et al. Aminopeptidase N is a major receptor for the enteropathogenic coronavirus TGEV. Nature. 1992;357(6377):417–20. doi: 10.1038/357417a0 - DOI - PMC - PubMed
    1. Li Z, Tomlinson AC, Wong AH, Zhou D, Desforges M, Talbot PJ, et al. The human coronavirus HCoV-229E S-protein structure and receptor binding. Elife. 2019;8:e51230. doi: 10.7554/eLife.51230 - DOI - PMC - PubMed
    1. Tresnan DB, Levis R, Holmes KV. Feline aminopeptidase N serves as a receptor for feline, canine, porcine, and human coronaviruses in serogroup I. J Virol. 1996;70(12):8669–74. doi: 10.1128/JVI.70.12.8669-8674.1996 - DOI - PMC - PubMed
    1. Li W, Hulswit RJG, Kenney SP, Widjaja I, Jung K, Alhamo MA, et al. Broad receptor engagement of an emerging global coronavirus may potentiate its diverse cross-species transmissibility. Proc Natl Acad Sci U S A. 2018;115(22):E5135–43. doi: 10.1073/pnas.1802879115 - DOI - PMC - PubMed

Publication types

MeSH terms

Supplementary concepts

LinkOut - more resources