

Flipping the switch on some of the slowest mutating genomes: Direct measurements of plant mitochondrial and plastid mutation rates in msh1 mutants
- PMID: 40587584
- PMCID: PMC12225983
- DOI: 10.1371/journal.pgen.1011764
Flipping the switch on some of the slowest mutating genomes: Direct measurements of plant mitochondrial and plastid mutation rates in msh1 mutants
Abstract
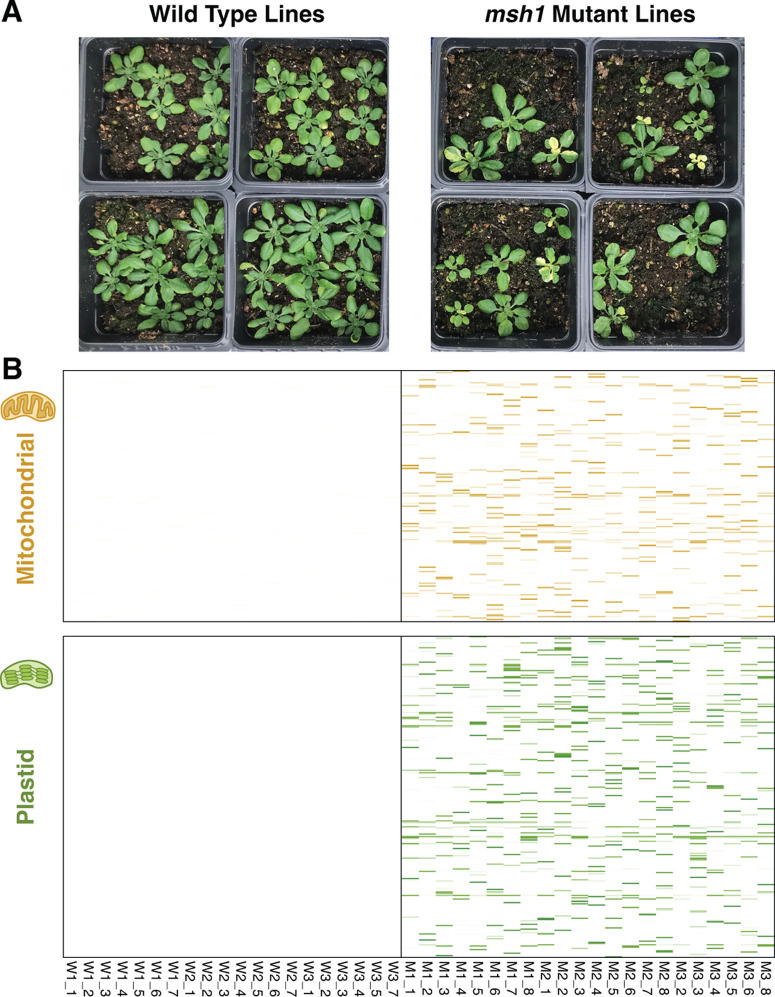
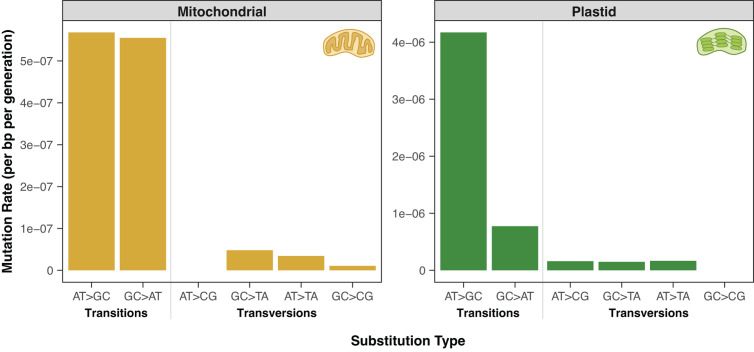
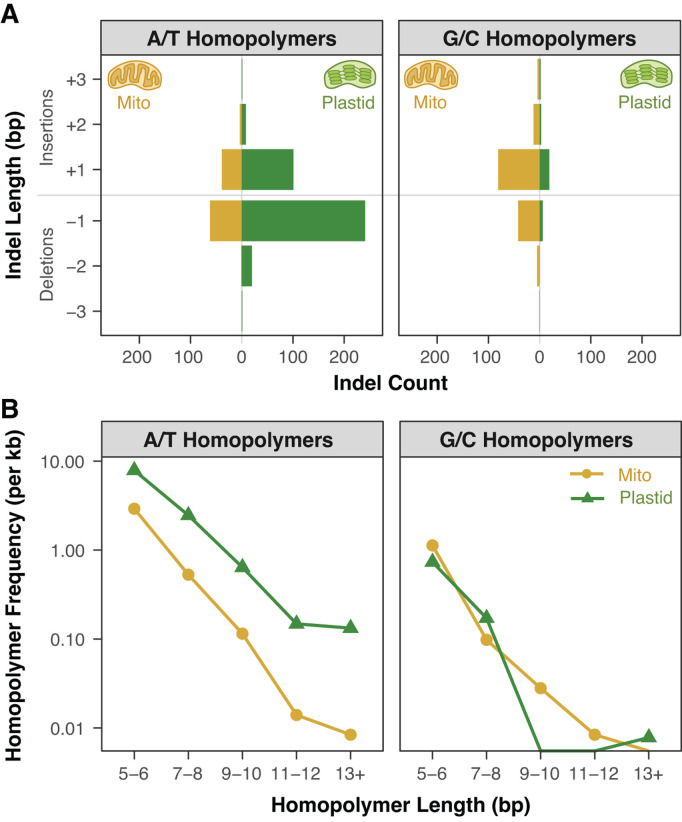
Plant mitochondrial and plastid genomes have exceptionally slow rates of sequence evolution, and recent work has identified an unusual member of the MutS gene family ("plant MSH1") as being instrumental in preventing point mutations in these genomes. However, the effects of disrupting MSH1-mediated DNA repair on "germline" mutation rates have not been quantified. Here, we used Arabidopsis thaliana mutation accumulation (MA) lines to measure mutation rates in msh1 mutants and matched wild type (WT) controls. We detected 124 single nucleotide variants (SNVs: 49 mitochondrial and 75 plastid) and 668 small insertions and deletions (indels: 258 mitochondrial and 410 plastid) in msh1 MA lines at a heteroplasmic frequency of ≥ 20%. In striking contrast, we did not find any organelle mutations in the WT MA lines above this threshold, and reanalysis of data from a much larger WT MA experiment also failed to detect any variants. The observed number of SNVs in the msh1 MA lines corresponds to estimated mutation rates of 6.1 × 10⁻⁷ and 3.2 × 10⁻⁶ per bp per generation in mitochondrial and plastid genomes, respectively. These rates exceed those of species known to have very high mitochondrial mutation rates (e.g., nematodes and fruit flies) by an order of magnitude or more and are on par with estimated rates in humans despite the generation times of A. thaliana being nearly 100-fold shorter. Therefore, disruption of a single plant-specific genetic factor in A. thaliana is sufficient to erase or even reverse the enormous difference in organelle mutation rates between plants and animals.
Copyright: © 2025 Broz et al. This is an open access article distributed under the terms of the Creative Commons Attribution License, which permits unrestricted use, distribution, and reproduction in any medium, provided the original author and source are credited.
Conflict of interest statement
The authors have declared that no competing interests exist.
Figures
Update of
-
Flipping the switch on some of the slowest mutating genomes: Direct measurements of plant mitochondrial and plastid mutation rates in msh1 mutants.bioRxiv [Preprint]. 2025 Jan 11:2025.01.08.631957. doi: 10.1101/2025.01.08.631957. bioRxiv. 2025. Update in: PLoS Genet. 2025 Jun 30;21(6):e1011764. doi: 10.1371/journal.pgen.1011764. PMID: 39829752 Free PMC article. Updated. Preprint.
Similar articles
-
Flipping the switch on some of the slowest mutating genomes: Direct measurements of plant mitochondrial and plastid mutation rates in msh1 mutants.bioRxiv [Preprint]. 2025 Jan 11:2025.01.08.631957. doi: 10.1101/2025.01.08.631957. bioRxiv. 2025. Update in: PLoS Genet. 2025 Jun 30;21(6):e1011764. doi: 10.1371/journal.pgen.1011764. PMID: 39829752 Free PMC article. Updated. Preprint.
-
MSH1 is required for maintenance of the low mutation rates in plant mitochondrial and plastid genomes.Proc Natl Acad Sci U S A. 2020 Jul 14;117(28):16448-16455. doi: 10.1073/pnas.2001998117. Epub 2020 Jun 29. Proc Natl Acad Sci U S A. 2020. PMID: 32601224 Free PMC article.
-
A rapid and systematic review of the clinical effectiveness and cost-effectiveness of paclitaxel, docetaxel, gemcitabine and vinorelbine in non-small-cell lung cancer.Health Technol Assess. 2001;5(32):1-195. doi: 10.3310/hta5320. Health Technol Assess. 2001. PMID: 12065068
-
Systemic pharmacological treatments for chronic plaque psoriasis: a network meta-analysis.Cochrane Database Syst Rev. 2021 Apr 19;4(4):CD011535. doi: 10.1002/14651858.CD011535.pub4. Cochrane Database Syst Rev. 2021. Update in: Cochrane Database Syst Rev. 2022 May 23;5:CD011535. doi: 10.1002/14651858.CD011535.pub5. PMID: 33871055 Free PMC article. Updated.
-
Expansion of the MutS gene family in plants.Plant Cell. 2025 Jul 1;37(7):koae277. doi: 10.1093/plcell/koae277. Plant Cell. 2025. PMID: 39692564 Free PMC article.
References
-
- Sturtevant AH. Essays on evolution. I. On the effects of selection on mutation rate. Q Rev Biol. 1937;12:464.
MeSH terms
Substances
Grants and funding
LinkOut - more resources
Full Text Sources
