. 2025 Jun 30;10(1):206.
doi: 10.1038/s41392-025-02290-z.

Tailoring a novel colorectal cancer stem cell-targeted therapy by inhibiting the SMYD3/c-MYC axis

Affiliations

Tailoring a novel colorectal cancer stem cell-targeted therapy by inhibiting the SMYD3/c-MYC axis

Martina Lepore Signorile et al. Signal Transduct Target Ther. .

Abstract

Cancer stem cells (CSCs) are responsible for colorectal cancer (CRC) chemoresistance, recurrence, and metastasis. Therefore, identifying molecular stemness targets that are involved in tumor growth is crucial for effective treatment. Here, we performed an extensive in vitro and in vivo molecular and functional characterization, revealing the pivotal role of the lysine methyltransferase SET and MYND Domain Containing 3 (SMYD3) in colorectal cancer stem cell (CRC-SC) biology. Specifically, we showed that SMYD3 interacts with and methylates c-MYC at K158 and K163, thereby modulating its transcriptional activity, which is implicated in stemness and colorectal malignancy. Our in vitro data suggest that SMYD3 pharmacological inhibition or its stable genetic ablation affects the clonogenic and self-renewal potential of patient-derived CRC-SCs and organoids by altering their molecular signature. Moreover, we found that SMYD3 stable knock-out or pharmacological inhibition drastically reduces CRC tumorigenicity in vivo and CRC-SC metastatic potential. Overall, our findings identify SMYD3 as a promising therapeutic target acting directly on c-MYC, with potential implications for countering CRC-SC proliferation and metastatic dissemination.


Conflict of interest statement

Competing interests: Italian patent application. Filing date 13.10.2022. Patent applicant: ISTITUTO DI RICOVERO E CURA A CARATTERE SCIENTIFICO “SAVERIO DE BELLIS”. Name of inventors: Alberto Del Rio and Cristiano Simone. Application number: IT202200021138. All other authors declare no competing interests.

Figures

Fig. 1
Fig. 1
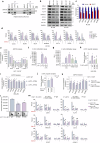
Analysis of SMYD3 involvement in cancer stemness and other cancer features in CRC models. a In vitro binding assay between HIS-SMYD3 and untagged recombinant c-MYC protein. GST-HSP90 C-terminal (616–736) was used as a positive control. b Upper panel: scheme showing the four FLAG c-MYC (WT + M1-M3) fusion proteins used in this study. Lower panel: in vitro binding assay between HIS-SMYD3 and recombinant FLAG c-MYC fragments. c Upper panel: Scheme showing the position of the purified P14, P14ext1, and P14ext2 peptides, which are located in the c-MYC transactivation domain (TAD). Lower panel: in vitro competition assay. HIS-SMYD3 bound to histidine beads was incubated with untagged c-MYC recombinant protein in the presence of escalating doses (0, 1, 5, 25, 125 µM) of the purified P14, P14ext1, and P14ext2 peptides. Bound proteins were visualized by immunoblot using anti-c-MYC and anti-HIS antibodies. d Co-immunoprecipitation assay of endogenous SMYD3 and c-MYC in HCT-116 CRC cells. eh Tumorsphere formation assay of WT and SMYD3-KO HCT-116 cells: tumorsphere brightfield imaging (e, scale bar: 500 μm), number (f, day 8), area (g), and diameter (h) at day 3 to 8. i Area (left panel) and brightfield imaging (right panel, scale bar: 500 μm) of replated WT and SMYD3-KO HCT-116 tumorspheres. j Results of the Gene Ontology (GO) enrichment analysis of differentially expressed (DE) genes in SMYD3-KO vs WT HCT-116 cells. *p < 0.05 SMYD3-KO vs WT parental cells. HIS-PD= His-Pull down. Where applicable, data are expressed as means ± SD of 3 independent experiments
Fig. 2
Fig. 2
Effect of SMYD3 pharmacological inhibition on CRC stemness. a Tumorsphere formation assay of WT and SMYD3-KO HCT-116 tumorspheres treated or not with EM127 (5 μM) for 72 h. Where indicated, SMYD3 expression was reconstituted in SMYD3-KO tumorspheres with a GFP-SMYD3 construct. Scale bar: 500 μm. bf Tumorsphere formation assay of WT HCT-116 tumorspheres treated or not with EM127 (5 μM) for 72 h. Tumorsphere brightfield imaging and live and dead staining (green: live cells; red: dead cells) (b, scale bar: 200 μm), number (c), area (d), diameter (e), and relative intensity of red fluorescence (f). g Results of the Gene Ontology (GO) enrichment analysis of differentially expressed (DE) genes in EM127-treated (5 μM for 24 h) vs untreated WT HCT-116 cells. h ddPCR analysis of stemness-related c-MYC target genes in WT and SMYD3-KO HCT-116 tumorspheres treated or not with EM127 (5 μM) for 24 h. Where indicated, SMYD3 expression was reconstituted in SMYD3-KO tumorspheres with a GFP-SMYD3 construct. i Immunoblot analysis of stemness-related c-MYC target gene products and Cleaved PARP in WT and SMYD3-KO HCT-116 tumorspheres treated or not with EM127 (5 μM) for 48 h. Where indicated, SMYD3 expression was reconstituted in SMYD3-KO tumorspheres with a GFP-SMYD3 construct. GAPDH was used as a loading control. *p < 0.05 EM127-treated vs untreated. #p < 0.05 SMYD3-KO vs WT parental tumorspheres. Δp < 0.05 SMYD3-KO tumorspheres transfected with the GFP-SMYD3 construct vs untransfected SMYD3-KO tumorspheres. Where applicable, data are expressed as means ± SD of 3 independent experiments
Fig. 3
Fig. 3
Molecular and functional characterization of SMYD3-dependent c-MYC methylation in CRC stemness. a Co-immunoprecipitation assay of endogenous SMYD3 and c-MYC in patient-derived CRC-SCs. b Immunoblot analysis of c-MYC stemness-related target gene products in patient-derived CRC-SCs treated or not with BCI-121 (100 μM) or EM127 (10 μM) for 48 h. c Real-time PCR analysis of c-MYC target genes in patient-derived CRC-SCs treated or not with EM127 (10 μM) for 24 h. d Chromatin immunoprecipitation (ChIP) assay of patient-derived CRC-SCs treated or not with EM127 (10 μM) for 24 h. Chromatin was pulled down with anti-SMYD3, anti-c-MYC, or anti-H3K27Ac antibodies, as indicated. Quantification was done using the % input method. *p < 0.05 EM127-treated vs untreated. e ddPCR analysis of c-MYC stemness-related target genes in WT HCT-116 cells cultured in the presence of P14 (125 μM), P14ext1 (125 μM), or P14ext2 (50 μM) for 24 h. f In vitro methylation assay showing c-MYC methylation by SMYD3. Histone H4 (1-27) was used as a SMYD3 control substrate. *p < 0.05 vs SAM. g In vitro methylation assay of mutagenized c-MYC. Histone H4 (1-27) was used as a SMYD3 control substrate. *p < 0.05 vs SAM; #p < 0.05 vs WT c-MYC. h Bar plot of the relative c-MYC luciferase reporter activity in HEK-293 cells transiently transfected with WT c-MYC, mutant c-MYC_K158A, or mutant c-MYC_K163A constructs. *p < 0.05 vs empty vector; #p < 0.05 vs WT c-MYC. i ddPCR analysis of c-MYC stemness-related target genes in HEK-293 cells transiently transfected with mutant c-MYC_K158A or c-MYC_K163A vs WT c-MYC constructs. *p < 0.05 vs WT c-MYC. j Bar plot of the relative c-MYC luciferase reporter activity in c-MYC_K158A or c-MYC_K163A knock-in vs WT HCT-116 cells. *p < 0.05 vs WT HCT-116 cells. k ddPCR analysis of c-MYC target genes in c-MYC_K158A or c-MYC_K163A knock-in vs WT HCT-116 cells. *p < 0.05 vs WT HCT-116 cells. l Tumorsphere formation assay of WT, c-MYC_K158A, and c-MYC_K163A HCT-116 cells. *p < 0.05 vs WT HCT-116 cells. Scale bar: 200 μm. m ChIP assay of WT, c-MYC_K158A, and c-MYC_K163A HCT-116 cells treated or not with EM127 (5 μM) for 24 h. Chromatin was pulled down with anti-c-MYC or anti-c-MYC_K158/K163Me antibodies. Quantification was done using the % input method. *p < 0.05 EM127-treated vs untreated, #p < 0.05 mutant c-MYC knock-in cells vs WT parental cells. a, d, m Anti-IgGs were used as negative controls. SAM = S-Adenosine-Methionine. Where applicable, data are expressed as means ± SD of 3 independent experiments
Fig. 4
Fig. 4
Consensus molecular subtype (CMS) classification and gene set enrichment analysis (GSEA) hallmark pathways in patient-derived CRC-SCs. a Distribution of CMS groups in patient-derived CRC-SCs overexpressing SMYD3 (high-SMYD3) (n = 7) and not overexpressing SMYD3 (low-SMYD3) (n = 7). b GSEA results of the hallmark pathway in EM127-treated (5 μM for 24 h) vs untreated patient-derived CRC-SCs. The graphs represent the main hallmarks (y-axis) identified as significantly enriched in the high-SMYD3 and low-SMYD3 groups. The false discovery rate (FDR) Q value is also reported. c, d Dot plots of the top 20 ranked terms obtained from the Gene Ontology (GO) enrichment analysis (c) and the REACTOME analysis (d) of the MYC TARGETS V1 hallmark per the GSEA described in b. “Count” indicates the number of genes enriched in a GO term. “Gene ratio” indicates the percentage of enriched genes in the given GO term. e CancerMine (http://bionlp.bcgsc.ca/cancermine) classification of the c-MYC-downregulated and -upregulated targets identified as oncogenes (blue rectangles) or tumor suppressors (orange rectangle) in CRC
Fig. 5
Fig. 5
SMYD3 as a potential therapeutic target in CRC-SCs. a Quantification of cell viability by CellTiter-Glo in patient-derived CRC-SCs (#C108 and #C109) treated or not with EM127 (10 μM) for 72 h. b Quantification of cell death by Trypan blue staining in patient-derived CRC-SCs (#C108 and #C109) treated or not with EM127 (10 μM) for 72 h. c Invasive ability of growth factor-starved patient-derived CRC-SCs (#C108 and #C109) placed in the inner chamber of transwell plates and treated or not with EM127 (10 μM) for 16 h. Invading cells were fixed and counted under a fluorescence microscope. Scale bar: 200 μm. d Colony-forming ability of patient-derived CRC-SCs (#C108 and #C109) seeded onto double-layer soft agar and treated or not with EM127 (10 μM) for 72 h. Data represent the area of the evaluated colonies during four weeks. e Flow cytometry analysis (left panel) and corresponding bar plot representation (right panel) of Ki67 expression in patient-derived CRC-SCs (#C108 and #C109) treated or not with EM127 (10 μM) for 72 h. f Flow cytometry analysis (left panel) and corresponding bar plot representation (right panel) of annexin V staining in patient-derived CRC-SCs (#C108 and #C109) treated or not with EM127 (10 μM) for 72 h. The graph summarizes the percentage of apoptotic cells (early + late). g Immunoblot analysis of Cleaved PARP, Cleaved Caspase 3, and c-MYC K158/K163Me levels in patient-derived CRC-SCs (#C108 and #C109) treated or not with EM127 (10 μM) for 72 h. GAPDH was used as a loading control. hn Characterization of PDTOs treated or not with EM127 (10 μM) for 72 h. PDTO brightfield imaging and live and dead staining (green: live cells; red: dead cells) (h, scale bar: 200 μm), number (i), area (j), relative intensity of red fluorescence (k), hematoxylin and eosin (H&E) staining (l, scale bar: 50 μm), TUNEL staining (green) with nuclei counterstained with DAPI (blue) (m, scale bar: 50 μm), and ddPCR analysis for stemness-related c-MYC target genes (n). *p < 0.05 EM127-treated vs untreated. Where applicable, data are expressed as means ± SD of 3 independent experiments
Fig. 6
Fig. 6
In vivo studies to tailor a novel therapeutic approach based on SMYD3 inhibition. a Schematic illustration of the establishment of WT and SMYD3-KO HCT-116 cell xenograft mice. Analysis of tumors explanted from mice treated as depicted in a. bd Tumor volume over time (b), hematoxylin and eosin (H&E) and Ki67 immunohistochemical staining (left panel) and bar plot summarizing the mean percentage of Ki67-positive cells (right panel) (c, scale bar: 100 μm), and immunoblot analysis of Cleaved PARP and Cleaved Caspase 3 levels (GAPDH was used as a loading control) (d). e Schematic illustration of the establishment of WT HCT-116 cell xenograft mice and EM127 treatment. As soon as the tumors reached a measurable size, mice were treated with daily intraperitoneal injections of EM127 (10 mg/kg) or the vehicle alone for 12 days and then sacrificed. fh Analysis of tumors explanted from mice treated as depicted in e. Tumor volume over time (f), hematoxylin and eosin (H&E) and Ki67 immunohistochemical staining (left panel, scale bar: 100 μm) and bar plot summarizing the mean percentage of Ki67-positive cells (right panel) (g), and immunoblot analysis of Cleaved PARP and Cleaved Caspase 3 levels (GAPDH was used as a loading control) (h). i Schematic illustration of the establishment of AOM/DSS mice and EM127 treatment. After three cycles of DSS, mice were treated with daily intraperitoneal injections of EM127 (10 mg/kg) or the vehicle alone for 12 days and then sacrificed. jl Analysis of tumors explanted from mice treated as depicted in i. Examination of explanted tissues showing tumor formation (j), average tumor number (k), and hematoxylin and eosin (H&E) and TUNEL staining (green) with nuclei counterstained with DAPI (blue) of colon sections (l, scale bar: 50 μm). AOM azoxymethane, DSS dextran sodium sulfate, IP intraperitoneal. b, c *p < 0.05 SMYD3-KO vs WT parental cells; f, g, k *p < 0.05 treated vs untreated. Where applicable, data are expressed as means ± SD of 3 independent experiments
Fig. 7
Fig. 7
In vivo studies to address the potential of targeting SMYD3 in CRC preclinical metastatic mice models. a ddPCR analysis of EMT genes in SMYD3-KO vs WT HCT-116 tumorspheres. Data are expressed as means ± SD of 3 independent experiments. b Schematic illustration of the establishment of WT_luc and SMYD3-KO_luc HCT-116 cell xenograft mice. c, d Analysis of bioluminescence signal emission in whole animals treated as depicted in b. Bioluminescence imaging (BLI) average radiance measured over time (c) and images of bioluminescence emission by IVIS taken once a week for four weeks, with the intensity of photon emission being represented as a pseudo-color image (a representative scale bar is shown on the right) (d). e Representative necroscopy of mice treated as depicted in b showing numerous tumor masses (yellow circles). f Hematoxylin and eosin (H&E) and Ki67 immunohistochemical staining (left panel, scale bar: 100 μm) and bar plot summarizing the mean ± SD percentage of Ki67-positive cells (each dot represents one mouse, right panel) of tumors explanted from mice treated as depicted in b. *p < 0.05 SMYD3-KO vs WT parental cells
Fig. 8
Fig. 8
In vivo studies to address the potential of targeting SMYD3 in patient-derived CRC-SC metastatic mice models. a Schematic illustration of the establishment of patient-derived CRC-SC xenograft mice and EM127 treatment. Starting from day 1 after cell inoculation, mice were treated with daily intraperitoneal injections of EM127 (10 mg/kg) or the vehicle alone for seven days and sacrificed after six further weeks. be Analysis of tumors explanted from mice treated as depicted in a. Representative necroscopy showing numerous tumor masses (b), hematoxylin and eosin (H&E) staining with calcium salts visible in the red circle and TUNEL staining (c, scale bar: 50 μm), immunoblot analysis of Cleaved PARP and c-MYC K158/K163Me levels (GAPDH was used as a loading control) (d), and ddPCR analysis of stemness-related c-MYC target genes (e). f Schematic illustration of the establishment of patient-derived CRC-SC xenograft mice and EM127 treatment. Thirty days after cell inoculation, mice were treated with daily intraperitoneal injections of EM127 (10 mg/kg) or the vehicle alone for 12 days and then sacrificed. gj Analysis of tumors explanted from mice treated as depicted in f. Representative necroscopy showing numerous tumor masses (g), hematoxylin and eosin (H&E) staining with calcium salts visible in the red circle and TUNEL staining (h, scale bar: 50 μm), immunoblot analysis of Cleaved PARP and c-MYC K158/K163Me levels (GAPDH was used as a loading control) (i), and ddPCR analysis of stemness-related c-MYC target genes (j). k, l Representative immunohistochemical analysis of c-MYC K158/K163Me levels in normal and cancer tissues from CRC patients (k, scale bar: 100 μm) and in normal tissue, primary tumor, and liver metastasis from metastatic CRC patients (l, scale bar: 100 μm). The TNM staging is indicated in parenthesis for each sample. *p < 0.05 EM127-treated vs untreated. Where applicable, data are expressed as means ± SD of 3 independent experiments
Fig. 9
Fig. 9
Targeting SMYD3 in patient-derived CRC-SCs to circumvent c-MYC mediated 5-FU chemoresistance. a Quantification of cell viability by CellTiter-Glo in patient-derived CRC-SCs pre-treated or not with EM127 (10 μM) for 48 h and then treated or not with 5-FU (10 μM) for 24 h. b Quantification of cell death by Trypan blue staining in patient-derived CRC-SCs treated as described in a. c Migratory ability of growth factor-starved patient-derived CRC-SCs placed in the inner chamber of transwell plates and treated or not with EM127 (10 μM) and/or 5-FU (10 μM) for 16 h. Migrating cells were fixed and counted under a fluorescence microscope. Scale bar: 100 μm. d Bar plot representation of the flow cytometry analysis of Ki67 expression in patient-derived CRC-SCs treated as described in a. e Bar plot representation of the flow cytometry analysis of annexin V staining in patient-derived CRC-SCs treated as described in a. The graph summarizes the percentage of apoptotic cells (early + late). fh Analysis of tumors explanted from WT HCT-116 cell xenograft mice treated with EM127 (10 mg/kg daily) and/or 5-FU (25 mg/kg every 3 days) or the vehicle alone for 12 days. Tumor volume (data are expressed as means ± SD, each dot represents one mouse) (f), representative images (g), and hematoxylin and eosin (H&E) staining (h, scale bar: 100 μm). ik Analysis of tumors explanted from patient-derived CRC-SC xenograft mice treated with EM127 (10 mg/kg daily) and/or 5-FU (25 mg/kg every 3 days) or the vehicle alone for 12 days. Tumor volume (data are expressed as means ± SD, each dot represents one mouse) (i), representative images (j), and hematoxylin and eosin (H&E) staining (k, scale bar: 200 μm). *p < 0.05 treated vs untreated; #p < 0.05 combined treatment vs corresponding single treatments. Where applicable, data are expressed as means ± SD of 3 independent experiments

References

    1. Deo, S. V. S., Sharma, J. & Kumar, S. GLOBOCAN 2020 Report on Global Cancer Burden: Challenges and Opportunities for Surgical Oncologists. Ann. Surg. Oncol.29, 6497–6500 (2022). - PubMed
    1. Zeineddine, F. A. et al. Survival improvement for patients with metastatic colorectal cancer over twenty years. NPJ Precis Oncol.7, 16 (2023). - PMC - PubMed
    1. Yang, Y. et al. Small-molecule drugs of colorectal cancer: Current status and future directions. Biochim Biophys. Acta Mol. Basis Dis.1870, 166880 (2024). - PubMed
    1. Reuvers, T. G. A., Kanaar, R. & Nonnekens, J. DNA damage-inducing anticancer therapies: from global to precision damage. Cancers (Basel)12, 2098 (2020). - PMC - PubMed
    1. Sanese, P. et al. The novel SMYD3 inhibitor EM127 impairs DNA repair response to chemotherapy-induced DNA damage and reverses cancer chemoresistance. J. Exp. Clin. Cancer Res43, 151 (2024). - PMC - PubMed

MeSH terms

Substances

LinkOut - more resources