. 2025 Jul;57(7):1754-1765.
doi: 10.1038/s41588-025-02239-6. Epub 2025 Jun 30.

Disruption of TAD hierarchy promotes LTR co-option in cancer

Affiliations

Disruption of TAD hierarchy promotes LTR co-option in cancer

Elissa W P Wong et al. Nat Genet. 2025 Jul.

Abstract

Transposable elements (TEs) are abundant in the human genome, and they provide the source for genetic and functional diversity. Previous studies have suggested that TEs are repressed by DNA methylation and chromatin modifications. Here through integrating transcriptome and 3D genome architecture studies, we showed that haploinsufficient loss of NIPBL selectively activates alternative promoters (altPs) at the long terminal repeats (LTRs) of the TE subclasses. This activation occurs through the reorganization of topologically associating domain (TAD) hierarchical structures and the recruitment of proximal enhancers. These observations indicate that TAD hierarchy restricts transcriptional activation of LTRs that already possess open chromatin features. Perturbation of hierarchical chromatin topology can lead to co-option of LTRs as functional altPs, driving aberrant transcriptional activation of oncogenes. These data uncovered a new layer of regulatory mechanisms of TE expression and posit TAD hierarchy dysregulation as a new mechanism for altP-mediated oncogene activation and transcriptional diversity in cancer.


Conflict of interest statement

Competing interests: Y.C. reports other support from Oric Pharmaceuticals and grants from Foghorn outside the submitted work. P.C. reports personal fees from Deciphera and Ningbo NewBay, grants and institutional support from Deciphera, Pfizer/Array and Ningbo NewBay, and personal fees from Zai Lab and Novartis outside the submitted work. The other authors declare no competing interests.

Figures

Fig. 1
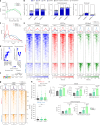
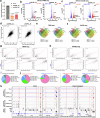
Fig. 1. Haploinsufficient loss of NIPBL leads to altP activation in intron and distal intergenic regions.
a, Volcano plots of differentially regulated genes (FDR < 0.05) by whole transcriptome analysis of shRNA-mediated NIPBL perturbation in 501mel melanoma cells. Upregulated genes (red, log2(FC) > 1), downregulated genes (blue, log2(FC) < −1) and genes of interest (green). n = 2 biological replicates. b, Volcano plots of significantly altered TSSs (CTSSs, FDR < 0.1, log2(FC) > 1) by CAGE-seq under NIPBL perturbation conditions as in a. n = 2 biological replicates. c, Two-sided Spearman correlation of transcriptome changes (log2(FC)) of annotated transcripts between whole transcriptome analysis by poly-A RNA-seq and CTSS analysis by CAGE-seq under NIPBL perturbation conditions (P < 1 × 10−16 for both shNIPBL conditions). d, Genomic annotation of all CTSSs by CAGE-seq under control condition. Percentage of each genomic feature is indicated. e, Distribution of genomic features of significantly (FDR < 0.1) upregulated (log2(FC) > 1) and downregulated (log2(FC) < −1) CTSSs with shRNA-mediated NIPBL downregulation. f, Representative examples of CAGE-seq and RNA-seq profiles of significantly upregulated CTSSs in intron and distal intergenic regions with NIPBL downregulation. Normalized CAGE-seq (blue, plus strand; red, minus strand) and RNA-seq profiles from two independent experiments are shown. Sashimi plots from one representative RNA-seq experiment depicted new spliced transcripts initiated from respective CTSSs, shaded in pink. The presence of repetitive elements is indicated by the ‘repeatmasker’ track from the UCSC genome browser (hg19 (GRCh37) genomic version). Enlarged genomic regions are shown in the dashed inset. FC, fold change; FDR, false discovery rate; Up, upregulated; Down, downregulated. Source data
Fig. 2
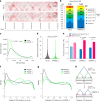
Fig. 2. Loss of NIPBL induced altP usage arising from LTR repetitive elements characterized by open chromatin characteristics.
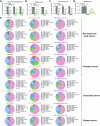
a, Bimodal distribution of promoter width showing sharp and broad promoters at baseline (black), and the promoter width of differentially regulated CTSSs by shNIPBL perturbation in melanoma cells, demonstrating a preference for broad promoters (green). Gray dashed line depicted the cutoff at 16 bp that separated sharp and broad promoters based on the distance between CAGE tags for each clustered CTSS with TPM > 0.5. b, Distribution of significantly upregulated CTSSs by shNIPBL at repetitive versus nonrepetitive elements in intron, distal intergenic and promoter regions. c, CpG compositions of significantly upregulated, downregulated and all CTSSs by shNIPBL_1. d, Characterization of 15 chromatin states by ChromHMM (left) and enrichment of different chromatin states over genome distribution for RefSeq TSS and differentially regulated CTSS (right) under NIPBL perturbation conditions. e, Density plots of genome-wide distribution of indicated histone modification marks by CUT&RUN, centered on differentially upregulated and downregulated CTSSs by shNIPBL_1. Data from one representative biological replicate (n = 2) are shown. f, HOMER de novo motif analysis of significantly changed CTSSs at nonpromoters demonstrated significant enrichment of the MITF motif by shNIPBL in melanoma cells. g, Density plots of genome-wide distribution of MITF by ChIP–seq centered on differentially upregulated and downregulated CTSSs by shNIPBL, demonstrating an increase in MITF binding at upregulated CTSSs. Data from one representative biological replicate (n = 2) are shown. h, Box and whiskers plots with boundaries extended from 25th to 75th percentile, line showing median and whiskers showing 10th to 90th percentile of MITF binding by ChIP–seq read counts at differentially upregulated (top) and downregulated (bottom) CTSSs by shNIPBL in melanoma cells. Each dot represented the quantification of MITF binding at one differentially regulated CTSS locus. ****P < 0.0001, matched one-way ANOVA, Dunnett’s multiple comparisons test. n = 2 biological replicates. NS, not significant. i, Quantification of MITF binding by ChIP–qPCR at representative altP in intron and distal intergenic regions under NIPBL perturbation conditions in melanoma cells. Data indicated the mean ± s.d. n = 3–4 biological replicates. *P < 0.05, **P < 0.01, ***P < 0.001 and ****P < 0.0001, ordinary one-way ANOVA, Dunnett’s multiple comparisons test. ANOVA, analysis of variance. Source data
Fig. 3
Fig. 3. NIPBL partial loss leads to a decrease in hierarchical TAD structures and preferentially affects CTSSs residing in high-level hierarchical TADs.
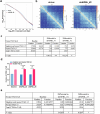
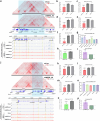
a, Representative hierarchical TAD structures by Hi-C contact maps (10 kb resolution) under control and NIPBL perturbation conditions in melanoma cells. TADs are organized as singletons (navy blue arrows) or hierarchical structures characterized by nested sub-TADs (green arrows) and nested inside meta-TADs (light blue arrows). NIPBL downregulation weakened TAD structures and preferential loss of outermost TADs (light blue arrows) of hierarchical TADs. n = 2 biological replicates. bd, The effects on hierarchical TAD structures by partial loss of NIPBL in melanoma cells, including on the number of various levels of hierarchical TAD structures by OnTAD (b), size distribution (c) and TAD boundary/insulation scores (d). ****P < 0.0001, Mann–Whitney two-tailed unpaired nonparametric t test. e, Comparison of fraction of baseline CTSS versus differentially regulated CTSSs by shNIPBL_1 and shNIPBL_2 in hierarchical and nonhierarchical TADs defined under control condition (≥ level 3 versus ≤ level 2 and singleton). *P < 0.05, **P < 0.01, two-tailed chi-square test. Number of CTSS in each category is in Extended Data Fig. 7. f,g, Relative CTSS distance to nearest TAD boundaries defined in shLuc condition (f) and in shNIPBL condition (g). The relative CTSS distance to TAD boundaries was calculated as the distance of CTSS to the nearest TAD boundary divided by the size of the respective TAD defined in the shLuc and shNIPBL conditions. h, Schematics illustrating the change in location of CTSSs relative to TAD structure changes with NIPBL perturbation. diff. CTSS, differential CTSS. Source data
Fig. 4
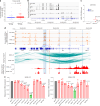
Fig. 4. Examples of promiscuous gene activation (ALKATI, ULK4 from intron 31) through reorganization of hierarchical TADs and retargeting of enhancers to altP in proximity.
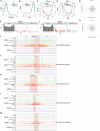
a,c, Hi-C map of hierarchical TADs of selective genomic regions, ALKATI (a) and ULK4 (c) in control (top, shLuc) and NIPBL perturbation (bottom, shNIPBL_2) conditions in melanoma cells. Gray bars below each Hi-C map denote computationally annotated TADs. ALKATI and ULK4 are located in a nested TAD comprising multiple sub-TADs. NIPBL loss leads to splitting (gray bars) and loss of hierarchy of outer TADs (blue circles), with relative preservation of sub-TADs (green circles). Genomic regions of ALKATI and ULK4 intron 31 altP were shaded in blue. b,d, OnTAD hierarchical domain changes of selective genomic regions, ALKATI (b) and ULK4 (d) in control (shLuc) and NIPBL perturbation (shNIPBL_2) conditions. The hierarchical domains are color-coded similarly to Fig. 3b, demonstrating the split of the top outer level of the hierarchical TADs (blue bar). Bottom illustration: B, TAD boundary; C, TAD center. e,f, Representative normalized 4C-seq profiles under control and NIPBL perturbation conditions, using ALKATI (e) and intron 31 of ULK4 (f) as viewpoints (shaded in pink), demonstrating enhanced interaction profile close to the viewpoint (arrows) and diminished long-range interaction (arrowheads) with NIPBL downregulation. Normalized average 4C-seq signal was binned with either a 25 kb window (ALKATI locus) or a 10 kb window (ULK4 intron 31 locus) with a 1 kb shift to calculate differential and log2(FC) in interaction (shNIPBL_2 signal—shLuc signal) and statistical significance by two-tailed paired t test. Respective chromatin states by ChromHMM, defined in Fig. 2d at the corresponding genomic regions, were also shown. gj, Zoomed-in regions from normalized 4C-seq profile under control and NIPBL perturbation conditions, demonstrating proximal contacts gain surrounding ALKATI (g) and ULK4 intron 31 (i) altPs with NIPBL perturbation. CRISPRi of the indicated genomic regions (blue, g,i) confirmed engagement of neighboring proximal H3K27ac-enriched peaks as retargeted enhancers for the transcriptional activation of ALKATI (h) and ULK4 from intron 31 (j). Data indicated the mean ± s.d. (n = 3–4 biological replicates). *P < 0.05, **P < 0.01, ***P < 0.001, ****P < 0.0001, ordinary one-way ANOVA, Dunnett’s multiple comparisons test. Source data
Fig. 5
Fig. 5. NIPBL perturbation contributes to transcriptional activation of ALKATI from the altP through engagement of proximal H3K27ac-enriched enhancers in melanoma.
a, Evaluation of NIPBL functional perturbation by FunSeq2 of TCGA melanoma cases with high and low ALKATI expression. Fifty cases from each of the high and low ALKATI-expressing TCGA–SKCM cases were used to calculate the composite FunSeq2 score of NIPBL. Scatter dot plot with box representing the mean and whiskers representing the s.d. *P < 0.05, two-tailed unpaired t test. b, Representative RNA-seq profiles of the ALK locus, demonstrating the expression of ALKATI in SKMEL-23 and SKMEL-1128, but not in COLO800 and A375 melanoma cell lines. c, Comparison of NIPBL TPM in ALKATI-expressing and nonexpressing melanoma cell lines. d, Normalized ChIP–seq profiles of H3K27ac (top) demonstrating putative proximal enhancers (blue shade) surrounding the ALKATI altP (pink shade); H3K27ac HiChIP arcs with hotspot analysis (bottom) using the ALKATI altP in intron 19 (pink shade) as virtual viewpoint confirmed the proximal enhancer interactions (blue shades) with the ALKATI altP. e, CRISPRi of the indicated proximal H3K27ac-enriched putative enhancer regions indicated in d led to a reduction of ALKATI mRNA expression, confirming their contribution as enhancers. Data indicated the mean ± s.d. (n = 4 biological replicates). *P < 0.05, **P < 0.01, ****P < 0.0001, ordinary one-way ANOVA, Dunnett’s multiple comparisons test. Source data
Extended Data Fig. 1
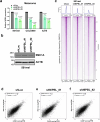
Extended Data Fig. 1. Efficiency of NIPBL downregulation by dox-inducible shRNAs and their effect on cohesin complex chromatin distribution.
a, Relative NIPBL mRNA levels by dox-inducible shRNA-mediated downregulation (shNIPBL_1 and shNIPBL_2) in various melanoma cell lines, 501mel, COLO800 and A375. Error bars are mean ± sd, n = 4 biological replicates. ***P < 0.001, ****P < 0.0001, ordinary one-way ANOVA, Dunnett’s multiple comparisons test. b, Immunoblots of SMC1A and loading control actin (ACTB) in whole cell lysate with shNIPBL knockdown. c, Representative density plots of normalized genome-wide ChIP–seq profile of SMC1A, demonstrating partial loss of NIPBL resulted in the reduction of the cohesin complex core subunit, SMC1A, on chromatin in 501mel cells. Data from one representative biological replicate (n = 3) are shown. df, Two-sided Spearman correlation of annotated transcripts’ expression between whole transcriptome analysis by poly-A RNA-seq and CTSS analysis by CAGE-seq under shLuc (control; d), shNIPBL_1 (e) and shNIPBL_2 (f) NIPBL perturbation conditions. Source data
Extended Data Fig. 2
Extended Data Fig. 2. Loss of NIPBL leads to altP activation in intron and distal intergenic regions.
a, Relative NIPBL mRNA levels by dox-inducible shRNA-mediated downregulation (shNIPBL_4 and shNIPBL_5) in 501mel melanoma cells. Error bars are mean ± sd, n = 4 biological replicates. ****P < 0.0001, ordinary one-way ANOVA, Dunnett’s multiple comparisons test. b, Volcano plots of differentially regulated genes (FDR < 0.05) by whole transcriptome analysis of shRNA-mediated NIPBL perturbation. Upregulated genes (red, log2(fold change) > 1), downregulated genes (blue, log2(fold change) < −1) and genes of interest (green). n = 2 biological replicates. c, Volcano plots of significantly altered TSSs (CTSSs, FDR < 0.1, log2(fold change) > 1) by CAGE-seq under NIPBL perturbation conditions as in a. n = 2 biological replicates. d, Two-sided Spearman correlation of transcriptome changes (log2(fold change)) of annotated transcripts between whole transcriptome analysis by poly-A RNA-seq and CTSS analysis by CAGE-seq under NIPBL perturbation conditions (P < 1 × 10−16 for both shNIPBL conditions). e,f, Venn diagram showed overlapping upregulated/downregulated genes (e) and CTSSs (f) among the 4 hairpins and a highly significant overlap between shNIPBL_1, shNIPBL_4 or shNIPBL_5 with shNIPBL_2 (e,f). Hypergeometric tests were performed to examine the significance of overlapping differentially expressed genes (RNA-seq) or CTSSs (CAGE-seq) in comparison to genomic background. log2(fold change) of upregulated/downregulated genes (g) and CTSSs (h) by shNIPBL_1, shNIPBL_4 or shNIPBL_5 was highly correlated with shNIPBL_2. i, Genomic annotation of all CTSSs by CAGE-seq under control condition. Percentage of each genomic feature is indicated. j, Distribution of genomic features of significantly (FDR < 0.1) upregulated (log2(fold change) > 1) and downregulated (log2(fold change) < −1) CTSSs with shRNA-mediated NIPBL downregulation. k, Representative examples of CAGE-seq and RNA-seq profiles of significantly upregulated CTSSs in intron and distal intergenic regions with NIPBL downregulation. Normalized CAGE-seq (blue, plus strand; red, minus strand) and RNA-seq profiles from two independent experiments are shown. New spliced transcripts initiated from respective CTSSs are shaded in pink. The presence of repetitive elements is indicated by the ‘repeatmasker’ track from the UCSC genome browser (hg19 (GRCh37) genomic version). Enlarged genomic regions are shown in dotted inset. Source data
Extended Data Fig. 3
Extended Data Fig. 3. The impact of NIPBL downregulation by dox-inducible shRNA on CTSS by CAGE-seq in various cancer cell lines.
ad, Efficiency of NIPBL downregulation by doxycycline-inducible shRNA in non-small cell lung cancer (KRAS-mutant: A549 and H358; ALK-fusion-positive: H2228; a), prostate cancer (AR-positive: VCAP and 22RV1; b), colorectal cancer (C106, HCT116, and SW620; c) and breast cancer (ER-positive, HER2-negative: CAMA-1; d) cell lines. Error bars are mean ± sd, n = 3 biological replicates, **P < 0.01, ***P < 0.001, ****P < 0.0001, two-tailed unpaired t test. e, Genomic annotation of all, significantly (FDR < 0.1) upregulated (log2(fold change) > 1) and downregulated (log2(fold change) < −1) CTSS by CAGE-seq with shNIPBL_2-mediated NIPBL downregulation in indicated cell lines. Percentage of each genomic feature is indicated. Source data
Extended Data Fig. 4
Extended Data Fig. 4. Characteristics and distribution of TEs and subclasses in differentially regulated CTSSs by NIPBL downregulation.
a, The number and corresponding percentage of CTSSs with promoter width lower or equal to 16 bp (sharp promoter) or higher than 16 bp (broad promoter) in baseline and shNIPBL perturbation. P value by two-tailed chi-square test. b,c, Distribution of LTR families (b) and subtypes (c) for baseline and upregulated CTSSs by shNIPBL_1 and shNIPBL_2. d, Distribution of significantly upregulated CTSSs by shNIPBL_4 and shNIPBL_5 at repetitive vs. non-repetitive elements in intron, distal intergenic and promoter regions. e,f, Distribution of LTR families (e) and subtypes (f) for baseline and upregulated CTSSs by shNIPBL_4 and shNIPBL_5. g, CpG and C/G composition in baseline CTSSs and differentially regulated CTSSs by shNIPBL_1. h, CpG compositions of significantly upregulated, downregulated and all CTSSs by shNIPBL_2. Source data
Extended Data Fig. 5
Extended Data Fig. 5. Global DNA methylation analysis by enzymatic methyl sequencing (EM-seq).
a,b, Representative distribution plots of DNA methylation sequencing coverage (a) and global DNA methylation levels (b) with NIPBL perturbation (shNIPBL_1 and shNIPBL_2) and control (shLuc). n = 2 biological replicates. c,d, Representative DNA methylation density plots under shLuc condition for baseline CTSSs and differentially regulated CTSSs by shNIPBL_1 (c) and shNIPBL_2 (d) perturbations. e,f, Histogram of CpG methylated regions under shLuc condition for baseline CTSSs and differentially regulated CTSSs by shNIPBL_1 (e) and shNIPBL_2 (f). g,h, Scatter plots showing differential methylation β vs. log2(fold change) of CTSS in shNIPBL_1 (g) and shNIPBL_2 (h) conditions. im, Representative DNA methylation profiles by EM-seq of significantly upregulated CTSSs in ALK intron 19 altP region (i), ULK4 (intron 31; j), LINC01387 (intron 2; k), between SYN3 and LINC01640 (intergenic regions; l) and between TAS2R39 and TAS2R40 (intergenic regions; m). Coverage (Cov) and methylation conversion (methyl) tracks were shown. Source data
Extended Data Fig. 6
Extended Data Fig. 6. MITF binding at activated altPs in intron and distal intergenic regions by NIPBL perturbation in melanoma cells.
a, MITF-binding motif (highlighted in orange) at representative activated altP often embedded within LTR sequence (highlighted in green). b, Fraction of baseline or shNIPBL-differentially increased/decreased MITF ChIP–seq peaks that were localized within LTR, LINE and SINE repetitive elements in the genome. E, exponents of 10. P value by two-sided proportion test. c, Normalized CAGE-seq, MITF ChIP–seq and H3K4me3 CUT&RUN profiles with NIPBL perturbation at representative activated altPs (shaded in pink). d, H3K4me3 enrichment by ChIP–qPCR with NIPBL perturbations at selective activated altPs. Data indicated the mean ± s.d. (n = 3–4 biological replicates). *P < 0.05, **P < 0.01, ordinary one-way ANOVA, Dunnett’s multiple comparisons test. Source data
Extended Data Fig. 7
Extended Data Fig. 7. NIPBL downregulation leads to alterations in long-range interaction frequency and chromatin architecture.
a, Hi-C contact probability plot showing the average contact frequency of valid paired-end reads as a function of genomic distance with NIPBL perturbation. Genomic distance between valid cis read pairs was calculated and the distribution of log10 read pair genomic distance was plotted. b, Hi-C contact map (at 100 kb resolution) of a representative region (chr8) with NIPBL downregulation (shNIPBL_2, right) vs. control (shLuc, left), demonstrating finer segregation in compartments after NIPBL downregulation. c, Number of baseline CTSSs versus differentially regulated CTSSs by shNIPBL_1 and shNIPBL_2 in hierarchical and non-hierarchical TADs defined under control condition (≥ level 3 vs. ≤ level 2 and singleton). de, Fraction (d) and number (e) of baseline CTSS versus differentially regulated CTSSs by shNIPBL_4 and shNIPBL_5 in hierarchical and non-hierarchical TADs defined under control condition (≥ level 3 vs. ≤ level 2 and singleton). *P < 0.05, **P < 0.01, two-tailed chi-square test. Source data
Extended Data Fig. 8
Extended Data Fig. 8. Perturbation of CTCF insulators in proximity to ALKATI and ULK4 altPs.
a, Hi-C contact map (10 kb resolution) of TADs surrounding ALKATI in control (top, shLuc) and NIPBL knockdown (bottom, shNIPBL_2). Genomic region of interest around the ALKATI was shaded in blue. Selected CTCF insulator sites (shaded in yellow) that overlapped with SMC1A binding around the ALKATI altP (shaded in pink) were targeted. bf, CTCF ChIP–qPCR with specific sgRNA targeting selective CTCF binding by dCas9–KRAB compared to sgGFP1/sgGFP2 controls. g, Relative ALKATI mRNA levels with dCas9–KRAB and respective sgRNAs. h,i, Quantification of CTCF binding by ChIP–qPCR at WDR43_3dn (h) by Cas9 deletion of CTCF and relative ALKATI mRNA levels (i). j, Hi-C contact map (10 kb resolution) of TADs surrounding ULK4 intron 31 in control (top, shLuc) and NIPBL knockdown (bottom, shNIPBL_2). Genomic region of interest around the ULK4 altP was shaded in blue. Selected CTCF insulator sites (shaded in yellow) that overlapped with SMC1A binding around the ULK4 intron 31 altP (shaded in pink) were targeted. km, CTCF ChIP–qPCR with specific sgRNA targeting selective CTCF binding by dCas9–KRAB compared to sgGFP1/sgGFP2 controls. n, Relative ULK4 intron 31 TSS mRNA levels with dCas9–KRAB and respective sgRNAs. o,p, Quantification of CTCF binding by ChIP–qPCR at CTNNB1_5up (o) by Cas9 deletion of CTCF and relative ULK4 intron 31 TSS mRNA levels (p). Error bars are mean ± s.d. (n = 3 biological replicates). *P < 0.05, **P < 0.01, ***P < 0.001, ****P < 0.0001, ordinary one-way ANOVA, Dunnett’s multiple comparisons test (bg, kn). *P < 0.05, **P < 0.01, two-tailed unpaired t test (h,i,o,p). Source data
Extended Data Fig. 9
Extended Data Fig. 9. Specificity of CRISPRi-sgRNA at the ALKATI and ULK4 intron 31 altPs.
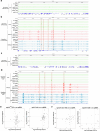
a, Single dCas9 peak was observed in ChIP–seq for each CRISPRi-sgRNA targeted region around the ALKATI altP within a 5.6 Mbp window, while no dCas9 peak was observed in no sgRNA and non-targeting sgGFP controls. b, Normalized Cas9 ChIP–seq and H3K27ac and H3K9me3 CUT&RUN signals around on-target sites. Pink highlighted areas indicated the locations of designed sgRNA. Specific increase in H3K9me3 decoration was observed at corresponding dCas9 peak. Specific repression of H3K27ac was observed at intron 19 and intron 4 by sgALKATI TSS and sgALK int4. c, Single dCas9 peak was observed in ChIP–seq for each CRISPRi-sgRNA targeted region around the ULK4 intron 31 altP within a 6.2 Mbp window, while no dCas9 peak was observed in no sgRNA and non-targeting sgGFP controls. d, Normalized Cas9 ChIP–seq and H3K27ac and H3K9me3 CUT&RUN signals around on-target sites. Pink highlighted areas indicated the locations of designed sgRNA. Specific increase in H3K9me3 decoration was observed at corresponding dCas9 peak. Specific repression of H3K27ac was observed at intron 31 and intron 30 by sgULK4int31 TSS and sgULK4 int30. e, log2(fold change) of H3K9me3 vs. H3K27ac CUT&RUN signals at dCas9 peaks called in sgALKATI TSS (left) or sgALK int4 (right) compared to no sgRNA control conditions. Orange point highlighted dCas9 peak specific to sgALKATI TSS or sgALK int4. f, log2(fold change) of H3K9me3 vs. H3K27ac CUT&RUN signals at dCas9 peaks called in sgULK4int31 TSS (left) or sgULK4 int30 (right) compared to no sgRNA control conditions. Orange point highlighted dCas9 peak specific to sgULK4int31 TSS or sgULK4 int30.
Extended Data Fig. 10
Extended Data Fig. 10. NIPBL functional perturbation by FunSeq2 of TCGA melanoma cases and MITF binding for ALKATI transcriptional activation in patient-derived melanoma cell lines.
a, Each cohort of high and low ALKATI expression (RSEM) has 50 cases. NIPBL mutations are present in 12 of 50 cases in high ALKATI expression cohort and in 4 of 50 cases of low ALKATI expression cohort. FunSeq2 score is considered 0 for cases without any NIPBL mutations. b, Quantification of MITF binding by ChIP–qPCR at selective H3K27ac-enriched regions that interacted with ALKATI altP identified by H3K27ac HiChIP in ALKATI-expressing melanoma cell lines. Negative control: PSA promoter; positive controls: TYR and DCT promoters. c, Immunoblots of MITF and loading control actin (ACTB) with siRNA-mediated knockdown of MITF in melanoma cells. d, Relative ALKATI mRNA levels with siRNA-mediated MITF knockdown in melanoma cells as in b. Error bars are mean ± s.d. (n = 3–4 biological replicates). **P < 0.01, ***P < 0.001, ****P < 0.0001, ordinary one-way ANOVA, Dunnett’s multiple comparisons test. Source data

Update of

References

    1. Fueyo, R., Judd, J., Feschotte, C. & Wysocka, J. Roles of transposable elements in the regulation of mammalian transcription. Nat. Rev. Mol. Cell Biol.23, 481–497 (2022). - PMC - PubMed
    1. Hoyt, S. J. et al. From telomere to telomere: the transcriptional and epigenetic state of human repeat elements. Science376, eabk3112 (2022). - PMC - PubMed
    1. Bourque, G. et al. Ten things you should know about transposable elements. Genome Biol.19, 199 (2018). - PMC - PubMed
    1. Senft, A. D. & Macfarlan, T. S. Transposable elements shape the evolution of mammalian development. Nat. Rev. Genet.22, 691–711 (2021). - PubMed
    1. Erwin, J. A., Marchetto, M. C. & Gage, F. H. Mobile DNA elements in the generation of diversity and complexity in the brain. Nat. Rev. Neurosci.15, 497–506 (2014). - PMC - PubMed

MeSH terms