. 2025 Aug;26(8):1352-1366.
doi: 10.1038/s41590-025-02199-3. Epub 2025 Jun 30.

CD4+ T cells license Kupffer cells to reverse CD8+ T cell dysfunction induced by hepatocellular priming

Affiliations

CD4+ T cells license Kupffer cells to reverse CD8+ T cell dysfunction induced by hepatocellular priming

Valentina Venzin et al. Nat Immunol. 2025 Aug.

Abstract

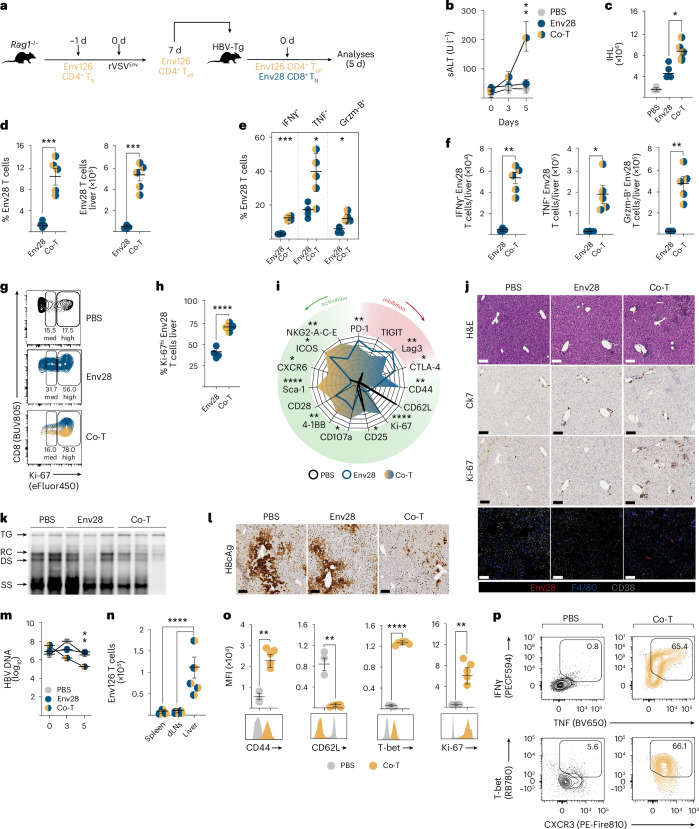
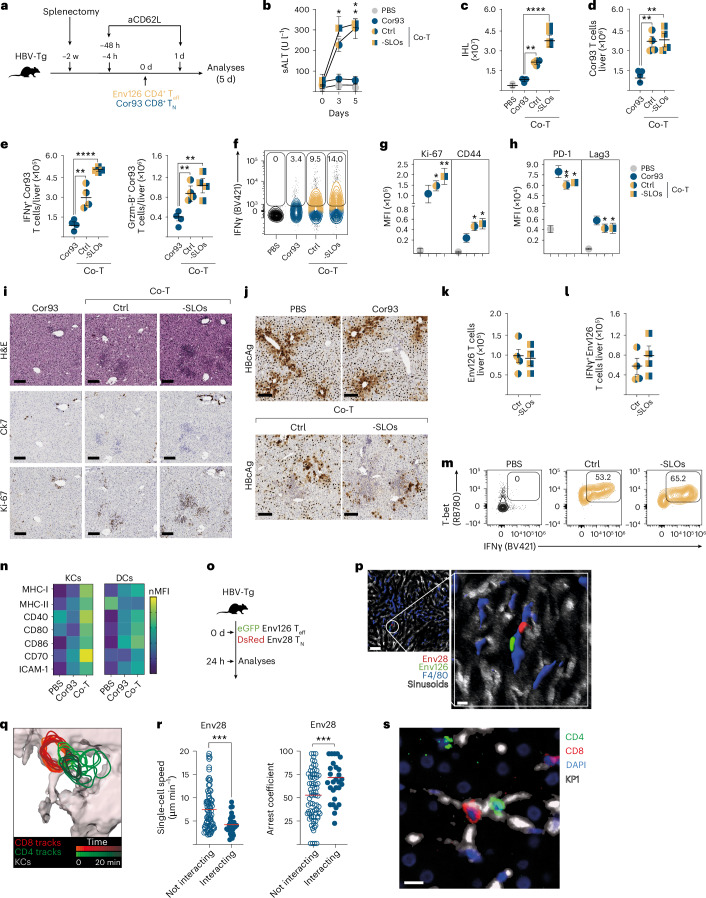
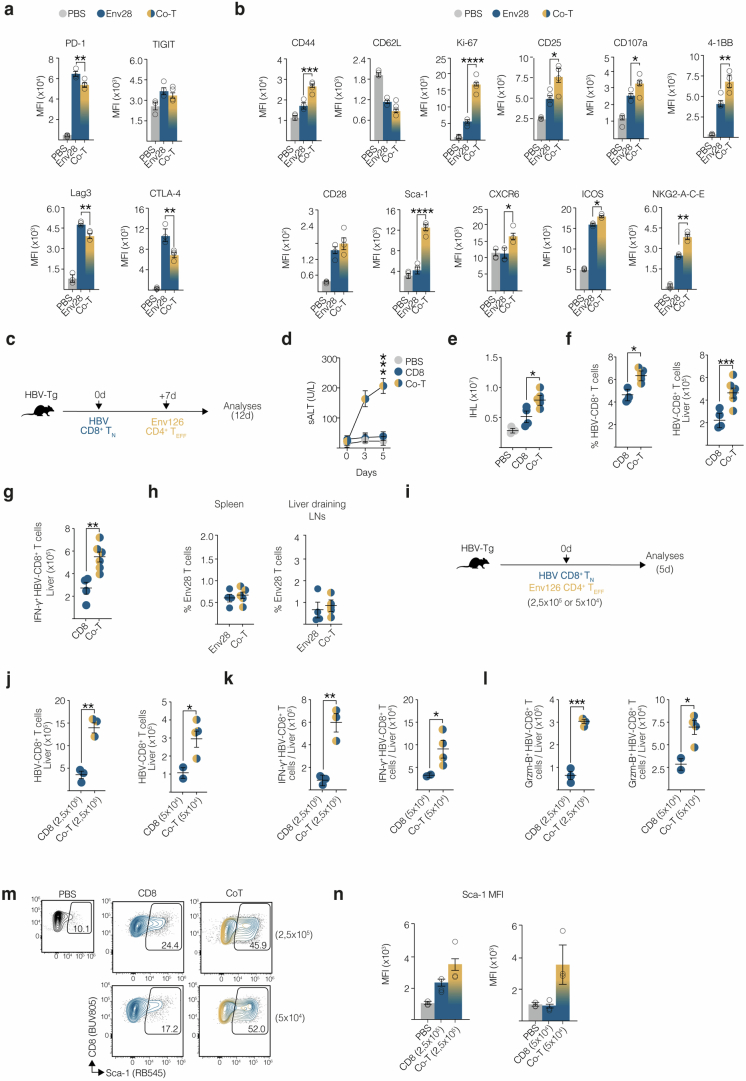
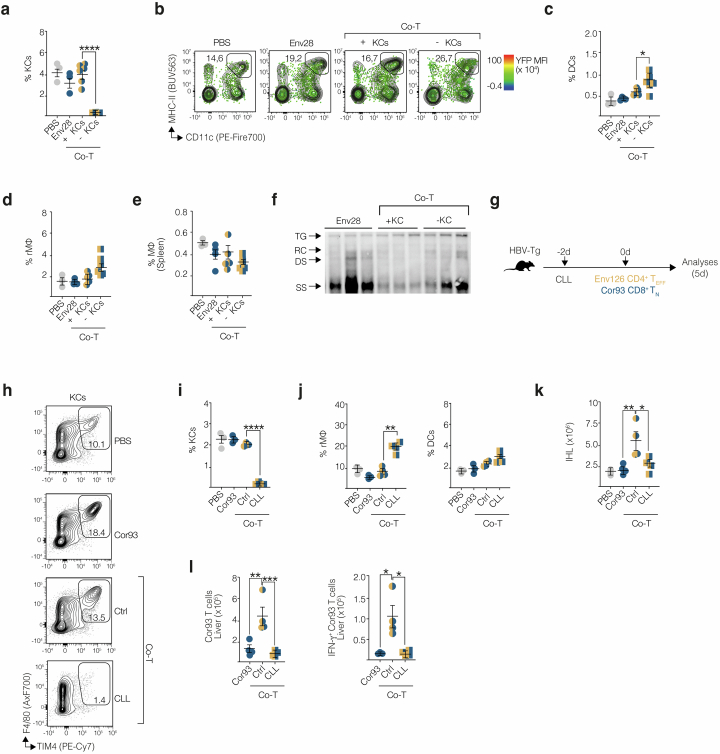
Chronic hepatitis B virus (HBV) infection is marked by dysfunctional HBV-specific CD8+ T cells, and restoring their effector activity is a major therapeutic goal. Here, we generated HBV-specific CD4+ T cell receptor transgenic mice to show that CD4+ effector T cells can prevent and reverse the CD8⁺ T cell dysfunction induced by hepatocellular priming. This rescue enhances antiviral CD8+ T cell function and suppresses viral replication. CD4+ T cell help occurs directly within the liver, independent of secondary lymphoid organs, and requires local antigen recognition. Kupffer cells, rather than dendritic cells, are the critical antigen-presenting platform. CD4+ T cells license Kupffer cells via CD40-CD40L interactions, triggering interleukin (IL)-12 and IL-27 production. IL-12 expands the CD4+ T cell pool, while IL-27 is essential for CD8+ T cell rescue. Exogenous IL-27 similarly restores HBV-specific CD8+ T cell function in mice and in T cells isolated from chronically infected patients. These findings identify IL-27 as a tractable immunotherapeutic target in chronic HBV infection.


Conflict of interest statement

Competing interests: K.R. and T.A.O. are stock owners, and employees at BioNTech. U.S. is stock owner and management board member at BioNTech. P.T.F.K. has acted as a consultant/advisor for Aligos, Assembly Biosciences, Gilead Sciences, GlaxoSmithKline and Bluejay and received educational grants from Aligos, Gilead Sciences and Vir Biotechnology. N.L.B. and A.B. are the founders and hold stocks of T Cell Diagnostics, a biotech company developing T cell tests for viral infection. A.B. is the cofounder of LION TCR, a company developing T cell therapy against viral-related cancers. A.B. consulted and served on the advisory boards of Brii Biosciences, Assembly Biosciences and Gilead Sciences. L.G.G. participated in boards, advisory boards and consultantships for Genenta Science, Epsilen Bio, Gilead Sciences, Antios Therapeutics, Aligos Therapeutics, Medicxi, Chroma Medicine and Ananda Immunotherapies. M.I. participates in advisory boards/consultantships or receives funding from Gilead Sciences, GentiBio, BlueJay Therapeutics, BioNTech, Excision BioTherapeutics, Moderna, GSK and Curie.Bio. The other authors declare no competing interests.

Figures

Fig. 1
Fig. 1. Generation and characterization of HBV-specific CD4+ TCR transgenic mice.
a, Representative flow cytometry plots showing Env126–138 tetramer+ CD4+ T cells in WT mice and Env126 TCR Tg mice. Cells were stained with Env126–138 peptide-loaded tetramer (I-Ab Env126–138) and human peptide-loaded tetramer as a control (I-Ab CLIP). b, Frequency and mean fluorescence intensity (MFI) of indicated markers on splenic CD4+ T cells in Env126 Tg and WT mice. c, Design: splenocytes of Env126 or WT mice were in vitro stimulated with cognate peptide, PMA–ionomycin or anti-CD3/anti-CD28 Dynabeads and analyzed by flow cytometry for cytokine production and proliferation with CellTrace Violet (CTV). Non-stimulated splenocytes were included as a control (Ctrl). d, Representative flow cytometry plots showing the frequency of TNF-producing CD4+ T cells in WT or Env126 mice after 4 h of in vitro stimulation. e, Representative flow cytometry plots showing the frequency of CD44+ and Ki-67+ CD4+ T cells in WT or Env126 mice after 4 h of in vitro stimulation with Env126–138 peptide. f, Representative plots of CTV-labeled WT or Env126 CD4+ T cells after 48 h of in vitro stimulation. Each peak represents a cell division and is indicated with a different shade of color. Numbers indicate the frequency of cells within the peak of events that did not undergo cell division. g, Proliferation index (total number of divisions divided by the number of cells that went into division) of WT and Env126 CD4+ T cells after 48 h of in vitro stimulation. h, Representative histograms of surface expression of indicated markers in WT and Env126 CD4+ T cells after 48 h of in vitro stimulation. i, Representative flow cytometry plot showing the frequency of Env126–138 tetramer+ CD4+ T cells in the spleen of Env126 or Env126 Rag1−/− mice. CD4+ T cells were identified as live, CD45+, CD8CD4+; Env126 CD4+ T cells were identified as live, CD45+, CD8CD4+Env-Tet+. ah, n = 3 (WT), 5 (Env126). Data are representative of at least three independent experiments. i, n = 5 (Env126), 5 (Env126 Rag1−/−). Results in g are expressed as the mean ± s.e.m. P values were calculated with two-way analysis of variance (ANOVA) with Bonferroni’s post hoc test. ****P < 0.0001.
Fig. 2
Fig. 2. CD4+ Teff cells limit CD8+ T cell dysfunction induced by hepatocellular priming.
a, Design: Env126 Teff cells were transferred at a 1:1 ratio (106:106) with naive Env28 T cells in HBV Tg mice (Co-T). Single transfer of Env28 and untreated mice (phosphate-buffered saline (PBS)) were used as controls. b, sALT in indicated groups of mice and time points. c, IHL numbers at day 5 after cell transfer. d, Frequency and numbers of Env28 T cells. e,f, Frequency (e) and numbers (f) of IFNγ-, TNF- and Grzm-B-producing Env28 T cells. g, Representative flow cytometry plots showing the frequency of control and Env28 T cells expressing Ki-67 at medium (med) and high (high) levels. h, Frequency of Ki-67hi Env28 T cells. i, Radar plot showing normalized MFI values of indicated markers on Env28 T cells. Asterisks refer to the comparison between Env28 and Co-T conditions. j, Immunohistochemical representative micrographs of liver sections: hematoxylin and eosin (H&E), cytokeratin-7 (bile ducts) and Ki-67 stainings. Scale bars, 100 μm. Bottom, confocal immunofluorescence micrographs of liver sections showing: DsRed+/+ Env28 T cells (red), CD38+ sinusoids (white), F4/80+ KCs. Scale bars, 200 μm. k, HBV DNA quantification by Southern blot. Bands indicate integrated transgene (TG), relaxed circular (RC), double-stranded linear (DS) and single-stranded (SS) HBV DNA. l, Representative HBcAg immunohistochemistry (IHC) micrographs of liver sections. Scale bars, 100 μm. m, Serum HBV DNA quantification. n, Env126 Teff cell numbers. o, MFIs of CD44, CD62L, T-bet and Ki-67 on hepatic Env126 Teff cells. p, Representative flow cytometry plots showing the frequency of Env126 Teff cells producing IFNγ and TNF, expressing CXCR3 and T-bet. Control CD4+ T cells are shown in black. n = 3 (PBS), 4 (Env28) and 5 (Co-T). Data are representative of five independents and are expressed as the mean ± s.e.m. Data in b and m were analyzed using two-way ANOVA with Bonferroni’s post hoc test. Data in all other graphs were analyzed using a two-tailed t-test or one-way ANOVA with Bonferroni’s post hoc test. *P < 0.05, **P < 0.01, ***P < 0.001, ****P < 0.0001. dLNs, draining lymph nodes. Source data
Fig. 3
Fig. 3. CD4+ T cell help relies on direct antigen recognition but does not require epitope linkage.
a, Experimental design. b, sALT in indicated groups of mice and time points. c, IHL numbers at day 5 after cell transfer. d, Numbers of hepatic Cor93 and IFNγ+ Cor93 T cells in indicated groups of mice. e, HBV DNA quantification by Southern blot. Bands indicate integrated TG, RC, DS and SS HBV DNA. f, Immunohistochemical representative micrographs of liver sections: H&E, cytokeratin-7 (bile ducts) and Ki-67 stainings. Scale bars, 100 μm. g, Experimental design. h, sALT in indicated groups of mice and time points. i, IHL numbers. j, Numbers of hepatic Cor93 and Env28 T cells at day 5 after transfer. k, Numbers of IFNγ-producing Cor93 and Env28 T cells. l, Histograms and representative plots of Ki-67 MFI values on control, Env28 and Cor93 CD8+ T cells. m, Experimental design. n, sALT in indicated groups of mice and time points. o, IHL numbers. p, Numbers of hepatic Cor93 and IFNγ+ Cor93 T cells. q, MFIs of indicated markers on control and Cor93 CD8+ T cells. r, Immunohistochemical representative micrographs of liver sections: H&E, cytokeratin-7 (bile ducts) and Ki-67. Scale bars, 100 μm. s, Representative HBcAg IHC micrographs of liver sections. Scale bars, 100 μm. t, Numbers of hepatic Env126 Teff cells at day 5 after transfer. af, n = 3 (PBS), 4 (Cor93) and 5 (Co-T). Data are representative of at least four independent experiments. gl, n = 3 (PBS), 4 (CD8) and 4 (Co-T). Data are representative of at least three independent experiments. mt, n = 3 (PBS), 4 (Ctrl Cor93), 3 (MUP Cor93), 4 (Ctrl Co-T), 4 (MUP Co-T) and 4 (MHC-II−/− Co-T). Data are representative of at least two independent experiments. Data are expressed as the mean ± s.e.m. Data in b, h and n were analyzed using two-way ANOVA with Bonferroni post hoc test. Data in all other graphs were analyzed using a two-tailed t-test or one-way ANOVA with Bonferroni’s post hoc test. *P < 0.05, **P < 0.01, ***P < 0.001. Source data
Fig. 4
Fig. 4. CD4+ T cells help CD8+ T cell function by licensing APCs in the liver.
a, Experimental design. b, sALT in indicated groups of mice and time points. c, IHL numbers at day 5 after cell transfer. d, Numbers of Cor93 T cells in the liver. e, Numbers of IFNγ+ and Grzm-B+ Cor93 T cells. f, Frequency of IFNγ+ Cor93 T cells. g,h, MFIs of indicated markers on Cor93 T cells. i, Liver immunohistochemical representative micrographs at day 5 after cell transfer: H&E, cytokeratin-7, Ki-67 stainings. Scale bars, 100 μm. j, Representative HBcAg IHC liver micrographs at day 5 after cell transfer. Scale bars, 100 μm. k,l, Numbers of hepatic Env126 and IFNγ+ Env126 CD4+ Teff cells. m, Frequency of IFNγ+ Env126 Teff cells. n, Heat map of normalized MFI (nMFI) of indicated markers on KCs and DCs at day 5 after cell transfer. MFI values were normalized separately (lowest value set to 0 and highest to 100). o, Experimental setup. Livers were analyzed 24 h after cell transfer. p, Rendered confocal immunofluorescence representative liver micrographs from co-transferred mice: DsRed+/+Env28 T cells (red), EGFP+/+Env126 Teff cells (green), CD38+ sinusoids (white), F4/80+ KCs (blue). Scale bars, 100 μm and 10 μm. q, Time-coded shapes of DsRed+/+Env28 T (red) and EGFP+/+Env126 Teff (green) cell tracks of Supplementary Video 1. r, Single-cell speeds and arrest coefficients of Env28 T cells non-interacting or engaged in three-cell clusters (interacting; cutoff, <2.5 µm min−1). s, Representative multiplex immunofluorescence liver image from a chimpanzee acutely infected with HBV at week 20 after infection: CD4+ T cells (green), CD8+ T cells (red), macrophages (KP1, white), nuclei (DAPI, blue). Scale bar, 10 µm. Individual channels are displayed in Supplementary Fig. 3. an, n = 3 (PBS), 4 (Cor93), 4 (Ctr Co-T), 4 (-SLOs Co-T). Data are representative of four independent experiments. or, n = 5. r, n = 82 tracks (not interacting), 28 tracks (interacting). Data are representative of at least two independent experiments. Data are expressed as the mean ± s.e.m. Data in b were analyzed using two-way ANOVA with Bonferroni’s post hoc test. Data in all other graphs were analyzed using two-tailed t-test or one-way ANOVA with Bonferroni’s post hoc test. *P < 0.05, **P < 0.01, ****P < 0.0001.
Fig. 5
Fig. 5. KCs function as a cellular platform for CD4+–CD8+ T cell cooperation in the liver.
a, Experimental design. b, Hepatic DC numbers at day 5 after cell transfer. c, sALT in indicated groups of mice and time points. d, IHL numbers. e, Hepatic Cor93 T cell and IFNγ+ Cor93 CD8+ T cell numbers. f, Immunohistochemical representative liver micrographs at day 5 after cell transfer: H&E, cytokeratin-7, cleaved caspase-3 stainings. Scale bars, 100 μm. g, Hepatic Env126 Teff cell numbers at day 5 after transfer. h, Experimental setup. i, KC numbers at day 5 after cell transfer. j, Representative flow cytometry plots showing frequency of F4/80+TIM4+YFP+ KCs at day 5 after cell transfer. k, DC numbers at day 5 after cell transfer. l, sALT in indicated groups of mice and time points. m, IHL numbers. n,o, Env28 T cells and IFNγ+ Env28 T cell numbers. p, Representative flow cytometry plots showing the frequency of IFNγ+ Env28 T cells. q, Immunohistochemical representative liver micrographs: H&E, cytokeratin-7, Ki-67 stainings. Scale bars, 100 μm. r, Representative HBcAg IHC liver micrographs at day 5 after cell transfer. Scale bars, 100 μm. s, Serum HBV DNA quantification of indicated groups of mice and time points. t, Hepatic Env126 Teff cell numbers at day 5 after cell transfer. ag, n = 3 (PBS), 3 (Cor93), 4 (+DCs Co-T), 5 (-DCs Co-T). Data are representative of at least two independent experiments. ht, n = 3 (PBS), 3 (Cor93), 5 (+KCs Co-T), 6 (-KCs Co-T). Data are representative of at least three independent experiments. Data are expressed as the mean ± s.e.m. Data in c and l were analyzed using two-way ANOVA with Bonferroni post hoc test. Data in all other graphs were analyzed using a two-tailed t-test or one-way ANOVA with Bonferroni’s post hoc test. **P < 0.01, ***P < 0.001, ****P < 0.0001. BMT, bone marrow transplant. DT, diphtheria toxin.
Fig. 6
Fig. 6. CD4+ T cells license KCs via CD40L to produce IL-12 and IL-27.
a, Experimental design. b, sALT in indicated groups of mice and time points. c, IHL numbers. d, Env28 T cell and IFNγ+ Env28 T cell numbers. e, Hepatic Env126 CD4+ Teff cell frequency. f, Relative quantification of IL-12 in total liver tissue. g, Experimental design. h, sALT in indicated groups of mice and time points. i, IHL numbers. j, Hepatic Cor93 T cell numbers at day 5 after transfer. k, IFNγ+ and Grzm-B+ hepatic Cor93 T cells. l, Immunohistochemical representative liver micrographs. Scale bars, 100 μm. m, Representative HBcAg IHC liver micrographs. Scale bars, 100 μm. n, Hepatic Env126 Teff cell frequency. o, Sca-1 MFI on Cor93 T cells. p, Relative quantification of IL-27 in total liver at day 5 after cell transfer. q, Experimental design. r, sALT in indicated groups of mice and time points. s, IHL numbers. t, Hepatic Cor93 T cell and IFNγ+ Cor93 T cell numbers. u, Representative flow cytometry plots showing the frequency of IFNγ+ Cor93 T cells. v, Immunohistochemical representative liver micrographs. Scale bars, 100 μm. w, Representative HBcAg IHC liver micrographs. Scale bars, 100 μm. x, Hepatic Env126 Teff cell frequency. y, Relative quantification of IL-27 in total liver tissue at day 5 after cell transfer (Fig. 5h–t). af, n = 3 (PBS), 3 (Env28), 4 (Isotype Co-T) and 3 (anti-CD40L (CD40L) Co-T); representative of three independent experiments. gp, n = 3 (PBS), 3 (Cor93), 4 (Isotype Co-T), 4 (anti-IL-12 (aIL-12) Co-T), 4 (aCD40L Co-T); representative of three independent experiments. qx, n = 3 (PBS), 3 (Cor93), 4 (Isotype Co-T), 4 (aIL-27 Co-T); representative of two independent experiments. y, n = 3 (PBS), 3 (Cor93), 5 (+KCs Co-T), 6 (−KCs Co-T). Data are expressed as the mean ± s.e.m. Data in b, h and r were analyzed using two-way ANOVA with Bonferroni’s post hoc test. Data in all other graphs were analyzed using a two-tailed t-test or one-way ANOVA with Bonferroni post hoc test. *P < 0.05, **P < 0.01, ***P < 0.001, ****P < 0.0001. NS, not significant.
Fig. 7
Fig. 7. Therapeutic potential of IL-27.
a, Experimental design. b, sALT in indicated groups of mice and time points. c, IHL numbers. d, Frequency and numbers of hepatic Cor93 T cells. e, IFNγ+ and Grzm-B+ Cor93 T cell numbers. f, Representative flow cytometry plots showing the frequency of Sca-1+, CD107a+ (LAMP1), IFNγ+ Cor93 T cells. Control CD8+ T cells are shown in black. g, Immunohistochemical representative liver micrographs of indicated groups of mice: H&E, cytokeratin-7, cleaved caspase-3, Ki-67 stainings. Scale bars, 100 μm. h, Representative HBcAg IHC liver micrographs. Scale bars, 100 μm. i, Experimental setup: PBMCs were isolated from 12 individuals with CHB and stimulated with HBV peptide pools or with hCMV-UL55 peptides as a control. Cells were expanded in vitro for 10 days with or without rIL-27. j,k, Frequency of HBV-specific (core, S and polymerase combined) and hCMV-specific (UL55) T cells (n = 12 individuals with CHB) expanded in the absence (full blue) or presence (empty blue) of rIL-27. Each dot represents one donor. j, Individual results from single individuals. l, Pie charts representing the number and proportion of individuals with CHB with higher or lower/equal response to HBV (core, S, POL peptide pools individually tested or combined) and hCMV-UL55 in T cells expanded in the presence of rIL-27 in comparison to expansion without rIL-27. m, ELISpot wells from donor no. 2045 of T cell lines expanded in the presence or absence of rIL-27 and stimulated with the indicated HBV peptide pools. n, Flow cytometry plots showing unstimulated (medium) and HBV-S-stimulated CD4+ and CD8+ T cells expanded in the presence of rIL-27. ah, n = 3 (Ctrl), 3 (PBS), 3 (rIL-27). Data are representative of at least three independent experiments and are expressed as the mean ± s.e.m. il, n = 12. Each dot represents one donor. Paired data were analyzed by paired t-test. *P < 0.05, **P < 0.01, ***P < 0.001, ****P < 0.0001. n, n = 1. Donor no. 2045.
Extended Data Fig. 1
Extended Data Fig. 1. Generation of TCR transgenic Env126 mice.
(a) Experimental design: WT mice were immunized with Env126-138 peptide and polyI:C at three time points. At day 21 post immunization, splenocytes were isolated and restimulated ex vivo o/n with the cognate peptide before cell sorting. (b) Sorting strategy and frequency of IFN-ɣ producing CD4+ T cells after 4 h and o/n in vitro peptide restimulation and subsequent IFN-ɣ+ cell enrichment prior sorting. As a control, isolated splenocytes were cultured with an irrelevant Ag (CtrlAg, OVAII) and Concavalin A (ConA). (c) RNA encoding TCR α and β chains were electroporated into activated WT CD4+ T cells (2×10⁵ cells) and tested with Env126-138 peptide via IFNγ ELISpot in the presence of peptide pulsed bone marrow-derived cells (BMDCs, 1×10⁴ cells). OVAII peptide was used as control (Ctrl-Ag). (d) Transgenic constructs maps generated after cloning of the Env126-138-specific TCR alpha and beta chain sequences into cassette plasmids. (Upper) Plasmid cassette (pTalphaCass) for TCRα gene expression comprises the Vα (variable alpha region) sequence of the specific Env126-138 TCR (green), the the α constant region (blue) downstream enhancers components (black). (Lower) Plasmid cassette (pTbetaCass) for TCR β gene expression comprises the Vβ (variable beta region) sequence of the specific Env126-138 TCR (orange), the β constant region (blue) downstream enhancers components (black). (e) MFIs of indicated markers on splenic WT or Env126 CD4+ T cells. (f) MFIs of CD44 and Ki-67 on ex vivo 4 h restimulated Env126 CD4+ T cells or WT CD4+ T cells in indicated conditions. WT unstimulated CD4+ T cells were included as a control (Ctrl). (g) MFIs of indicated markers on splenic polyclonal WT or Env126 CD4+ T cells after 48 h in vitro stimulation with indicated stimuli. WT unstimulated CD4+ T cells were included as a control (Ctrl). In (e-g) CD4+ T cells were identified as Live, CD45+, B220CD19, CD3+, CD8CD4+. Env126 CD4+ T cells were identified as Live, CD45+, B220CD19, CD3+, CD8CD4+Env-Tet+. (e-g) n = 3 (WT), 5 (Env126). Results are expressed as mean ± SEM and are representative of at least 3 independent experiments. P values were calculated with two-way ANOVA with Bonferroni post-test. ** P<0.01, *** P<0.001.
Extended Data Fig. 2
Extended Data Fig. 2. In vivo generation of effector Env126 CD4+ T cells.
(a) Experimental design. Rag1−/− recipient mice were injected intravenously with 105 naïve Env126 CD4+ T cells. After 24 h, a group of Rag1−/− recipient mice was infected with rVSVEnv. Spleens were surgically collected and analyzed 7 days post infection (p.i.) by flow cytometry. (b) Absolute numbers of Env126 T cells in the spleen of indicated groups of mice at day 7 p.i. (c) Radar plot of the normalized MFIs of indicated markers on Env126 T cells. Polyclonal CD4+ T cells from untreated WT mice were included as a control (PBS). Asterisks refer to the results obtained from the statistical analysis of the comparison between Env126 and Env126 + rVSVEnv experimental groups. (d) Histograms of the MFIs represented in (b) calculated on Env126 T cells or WT CD4+ T cells as a control (PBS). (e) Frequency of Env126 T cells or control WT CD4+ T cells expressing the indicated marker o producing the indicated cytokine after 4 h in vitro peptide (Env126-138) restimulation. (f) Representative flow cytometry plots showing the frequency of Env126 CD4+ T cells (yellow) producing IFN-ɣ and TNF-α (left plot), expressing T-bet and producing IL-2 (right plot) after 4 h in vitro peptide (Env126-138) restimulation. Each plot is compared with the same frequencies in WT CD4+ T cells as a control (black). Env126 CD4+ T cells were defined as Live, CD45+, B220CD19, CD8CD4+, CD45.1+CD45.2+; control CD4+ T cells from untreated WT control mice were identified as Live, CD45+, B220CD19, CD8CD4+. (a-f) n = 3 (PBS), 3 (Env126), 5 (Env126 + rVSVEnv) (b, d, e) Data are representative of at least 6 independent experiments. Data are expressed as mean ± SEM. P values were calculated with two-way ANOVA with Bonferroni post-test. * P<0.05, ** P< 0.01, *** P< 0.001, **** P<0.0001.
Extended Data Fig. 3
Extended Data Fig. 3. Single-cell RNA sequencing of effector Env126 CD4+ T cells.
(a) Top panel: UMAP projection of 8894 CD4+ T Env126 cells coloured by the condition: Env126 CD4+ TEFF (yellow), Env126 CD4+ TN (blue); bottom panel: UMAP visualization of 8894 Env126 CD4+ T cells colored by unsupervised Louvain clustering. (b) Heatmap of scaled and clusters-averaged expression values from the three unsupervised-identified clusters displayed in (a) across a curated TH1 set of genes. (c) Feature plot representation of the normalized expression level of selected genes. (d) Violin plot representation of CD4+ T helper signatures extracted from Kiner et al. 2021 showing the enrichment of the naïve, T helper 1, T helper 2, T helper 17, T follicular helper signatures. (e) Barplot displaying the normalized enrichment score (NES) and adjusted pvalue of the GO biological processes related to the signatures displayed in (d) enriched in cluster 1 + cluster 2. (f) GSEA plot displaying the results of the enrichment of the most significant gene set from MSigDB M5 (MSigD B 2024.1 release) of the biological processes related to the T helper 1 signature displayed in (d), in the list of genes pre-ranked based on the comparison between cluster 1 + cluster 2 (positive log2FC) versus cluster 0 (negative log2FC). (g) Violin plot representation of Mki67 gene expression stratified by Env126 CD4+ T cells clusters defined in (a). (h) Feature plot representation of the normalized expression level of Mki67 gene. The central line within the box represents the median of the data, while the lower and upper edges of the box correspond to the first (Q1) and third (Q3) quartiles, respectively, thus defining the interquartile range (IQR). The whiskers extend to the most extreme values that fall within 1.5 times the IQR from the quartiles, and any observations beyond this range are plotted individually as outliers (d, g). p.adjust represents FDR adjusted values calculated using two-tailed Benjamini–Hochberg procedure (e, f). In (d, g) no statistical analysis was performed. n = 5 (Env126 TN), 5 (Env126 TEFF). Data shown are representative of one experiment.
Extended Data Fig. 4
Extended Data Fig. 4. CD4+ T cells prevent and revert CD8+ T cell dysfunction.
(a) MFIs of indicated markers (Fig. 2I) on Env28 T cells or control CD8+ T cells. (b) MFIs of indicated markers (of Fig. 2I) on Env28 T cells in indicated conditions or control CD8+ T cells. (c) Experimental design: HBV-sp CD8+ TN cells were transferred in HBV Tg mice transferred 7 days later with Env126 CD4+ TEFF. Single transfer of CD8+ T cells (CD8) and untreated HBV Tg mice (PBS) were used as controls. (d) sALT at indicated time points post CD4+ TEFF transfer. (e) IHL in indicated groups at day 5 post CD4+ TEFF transfer. (f) Frequency and numbers of hepatic HBV-specific CD8+ T cells at day 5 post Env126 CD4+ TEFF transfer. (g) Numbers of IFN-γ producing hepatic HBV-specific CD8+ T cells t day 5 post Env126 CD4+ TEFF transfer. (h) Env28 T cells frequency in spleen and liver draining lymph nodes at day 5 post cell transfer (refers to Fig. 2A). (i) Experimental design: Env126 CD4+ TEFF were transferred in 1:1 ratio (2,5×10⁵:2,5×10⁵ or 5×10⁴: 5×10⁴) with naïve HBV-specific CD8+ T cells in HBV Tg mice (Co-T). Single transfer of CD8+ T cells (CD8) and untreated HBV Tg mice (PBS) were used as controls. (j) Hepatic HBV-specific CD8+ T cells numbers at day 5 post transfer. (k) Numbers of IFNγ producing hepatic HBV-specific CD8+ T cells at day 5 post transfer. (l) Grzm-B producing hepatic HBV-specific CD8+ T cells numbers at day 5 post transfer. (m) Representative flow cytometry plots showing the frequency of Sca-1+ HBV-specific CD8+ T cells at day 5 post transfer. (n) Sca-1 MFI on HBV-specific CD8+ T cells or control CD8+ T cells. (a-b, h) n = 3 (PBS), 4 (Env28), 5 (Co-T). Data are representative of at least 10 independent experiments. (c-g) n = 3 (PBS), 4 (CD8), 6 (Co-T). (j-n) n = 2 (PBS), 2 (CD8 5×10⁴), 4 (Co-T 5×10⁴), 3 (CD8 2,5×10⁵), 3 (Co-T 2,5×10⁵). Data are representative of at least 3 independent experiments. Data are expressed as mean ± SEM. P values were calculated with two-way ANOVA with Bonferroni post-test. * P<0.05, ** P<0.01, *** P<0.001.
Extended Data Fig. 5
Extended Data Fig. 5. Effector CD4+ T cells do not mediate liver immunopathology.
(a) Experimental design: Env126 CD4+ TEFF were generated as described in Extended Data Fig. 2 and transferred in HBV Tg mice (Env126, yellow dots). As a control, untreated HBV Tg mice (PBS, grey) were included in the experiment. Livers were collected 5 days post cell transfer. (b) sALT in indicated groups of mice at indicated time points. (c) Numbers of IHL isolated from indicated groups of mice at day 5 post cell transfer. (d) Frequency and absolute numbers of endogenous CD8+ T cells in HBV Tg mice in indicated conditions at day 5 post Env126 CD4+ TEFF transfer. (e) Immunohistochemical representative micrographs of liver sections from the indicated groups of mice at day 5 post cell transfer in HBV Tg mice. Micrographs are showing the H&E, cytokeratin-7 (bile ducts) and Ki-67 and cleaved-Caspase3 staining of liver sections. Scales bars represent 100μm. (f) Representative HBcAg IHC micrographs of liver sections from indicated groups of mice at day 5 post Env126 CD4+ TEFF transfer. Scales bars represent 100μm. The staining is presented as a qualitative assessment of antigen distribution, illustrating its presence or absence across conditions. (g) HBV DNA quantification by Southern blot in livers of indicated mice. Bands corresponding to integrated transgene (TG), relaxed circular (RC), double-stranded linear (DS), and single-stranded (SS) HBV DNA are indicated by arrows. n = 3 (PBS), 3 (Env126). Data are representative of at least 3 independent experiments. Source data
Extended Data Fig. 6
Extended Data Fig. 6. Effector CD4+ T cells help is heterologous.
(a) Frequency of IFNγ, TNF and granzyme-B producing hepatic Cor93 CD8+ T cells in indicated groups of mice at day 5 post cell transfer after in vitro peptide restimulation. (b) Representative flow cytometry plots showing the frequency of IFNγ producing hepatic Cor93 CD8+ T cells in indicated groups of mice at day 5 post cell transfer after in vitro peptide restimulation. Endogenous CD8+ T cells from untreated HBV Tg mice were included as a control (PBS, black plot). (c) Absolute numbers of TNF and Grzm-B producing hepatic Cor93 CD8+ T cells in indicated conditions at day 5 post cell transfer after in vitro peptide restimulation. (d) Radar plot of the mean of normalized MFIs of indicated markers on hepatic Cor93 CD8+ T cells. Polyclonal CD8+ T cells from untreated HBV Tg mice were included as a control (PBS). Asterisks refer to the results obtained from the statistical analysis of the comparison between Cor93 and Co-T experimental conditions. (e) Representative HBcAg IHC micrographs of liver sections from indicated groups of mice at day 5 post cell transfer. Scales bars represent 100μm. The staining is presented as a qualitative assessment of antigen distribution, illustrating its presence or absence across conditions. (f) Representative CD3 IHC micrographs of liver sections from indicated groups of mice at day 5 post cell transfer. Scales bars represent 100μm. n = 3 (PBS), 4 (Cor93), 5 (Co-T). Data are representative of at least 4 independent experiments. Data are expressed as mean ± SEM. Data were analysed using two-tailed t-test or one-way ANOVA with Bonferroni post-test. * P<0.05, ** P<0.01, *** P<0.001.
Extended Data Fig. 7
Extended Data Fig. 7. Effector CD4+ T cells help CD8+ T cells outside SLOs.
(a) Representative flow cytometry plots showing frequency of Cor93 T cells in the liver draining lymph nodes 24 h post transfer. (b) Immunohistochemical representative micrographs of liver sections at day 5 post cell transfer. Micrographs show cleaved-Caspase3 staining. Scales bars represent 100μm. (c) Experimental design: Env126 CD4+ TEFF were transferred 1:1 (106:106) with naïve HBV-specific CD8+ T cells in HBV Tg mice splenectomized and treated with anti-CD62L antibody (Co-T) or treated with FTY720 (Co-T FTY). Single transfer of HBV-specific CD8+ T cells in mice splenectomized and treated with anti-CD62L (CD8) or treated with FTY (Cor93 FTY) were included in the experiment. Untreated HBV Tg mice (PBS) were used as a control. (d) Total lymphocytes count in peripheral blood at day 5 post cell transfer. (e) Numbers of hepatic Cor93 T cells at day 5 post transfer. (f) Numbers of hepatic Env126 CD4+ TEFF at day 5 post cell transfer. (g) Numbers of IFNγ producing hepatic HBV-specific CD8+ T cells at day 5 post cell transfer. (h) MFIs of indicated markers on Cor93 T cells or control CD8+ T cells (PBS). (i) Representative flow cytometry plots showing the gating strategy used to identify KCs and DCs among liver non parenchymal cells. Lin comprises CD3+NK1.1+CD19+Ly6G+CD49b+ cells. (j) Representative histogram Fold Change values (FC) of MFIs values on KCs in the liver of co-transferred (Co-T) mice versus Env28 transferred mice (Env28); refers to Fig. 4n. (k) MFIs of indicated markers on KCs and DCs at day 5 post cell transfer (refers heatmap in Fig. 4n). (a, b) n = 4 (Cor93), 4 (Ctr Co-T), 4 (-SLOs Co-T). Data are representative of at least 4 independent experiments. (c-h) n = 3 (PBS), 3 (Cor93), 4 (Co-T), 3 (Cor93 FTY), 4 (Co-T FTY) (k) n = 3 (PBS), 4 (Cor93), 4 (Ctr Co-T). Data are representative of at least 2 independent experiments. Data are expressed as mean ± SEM. Data were analyzed using one-way ANOVA with Bonferroni post-test or two-tailed t-test. * P<0.05, ** P<0.01.
Extended Data Fig. 8
Extended Data Fig. 8. DCs are dispensable for intrahepatic cooperation of CD4+ CD8+ T cells.
(a) Total chimerism on CD45+ cells in the blood of HBV Tg mice transplanted with CD11c-iDTR-GFP bone marrow at indicated time points (b) Frequency of GFP+ DCs cells out of total DCs in the blood of HBV Tg mice transplanted with CD11c-iDTR-GFP bone marrow at indicated time points. (c) Frequency of DCs in the liver of indicated groups of mice at day 5 post cell transfer. (d) Representative flow cytometry plots showing the frequency of DCs in the liver of indicated groups of mice at day 5 post cell transfer. Color scale indicate GFP MFI. (e) Frequency and absolute numbers of KCs in the liver of indicated groups of mice at day 5 post cell transfer. (f) Absolute numbers of granzyme-B+ Cor93 CD8+ T cells in the liver of indicated groups of mice at day 5 post cell transfer. (g) Representative histograms showing the MFIs of indicated markers on Cor93 CD8+ T cells in the liver of indicated groups of mice at day 5 post cell transfer. (h) Representative HBcAg IHC micrographs of liver sections from indicated groups of mice at day 5 post cell transfer. The staining is presented as a qualitative assessment of antigen distribution, illustrating its presence or absence across conditions. (i) Frequency of Env126 CD4+ TEFF in the livers of indicated groups of mice at day 5 post cell transfer. Scales bars represent 100μm. (j) Representative flow cytometry plots showing the frequency of IFN-g producing Env126 CD4+ TEFF in in the livers of indicated groups of mice at day 5 post cell transfer and after in vitro peptide restimulation. (k) Representative histograms showing the MFIs of indicated markers in Env126 CD4+ TEFF in the livers of indicated groups of mice at day 5 post cell transfer. n = 3 (PBS), 3 (Cor93), 4 (+DCs Co-T), 5 (-DCs Co-T). Data are representative of at least 2 independent experiments. (c, f) Data are expressed as mean ± SEM. Data were analyzed using one-way ANOVA with Bonferroni post-test. * P<0.05, ** P<0.01, **** P<0.0001.
Extended Data Fig. 9
Extended Data Fig. 9. KCs depletion impairs intrahepatic T cell cooperation.
(a) Frequency of KCs in the liver at day 5 post T cell transfer. (b) Representative flow cytometry plots showing the frequency of hepatic DCs at day 5 post T cell transfer. Colour scale indicate YFP MFI. (c) Frequency of hepatic DCs at day 5 post T cell transfer. (d) Frequency of hepatic resident macrophages (rMΦ, identified as F4/80+TIM4) in indicated groups of mice at day 5 post cell transfer. (e) Frequency of macrophages in the spleen of indicated groups of mice at day 5 post cell transfer. (f) HBV DNA quantification by Southern blot in livers of indicated groups of mice at day 5 post cell transfer. Bands corresponding to integrated transgene (TG), relaxed circular (RC), double-stranded linear (DS), and single-stranded (SS) HBV DNA are indicated by arrows. (g) Experimental setup: Env126 CD4+ TEFF were transferred 1:1 (106:106) with naïve Cor93 T cells in HBV Tg mice (Ctr Co-T) and in HBV Tg mice treated with a single dose of clodronate liposomes (CLL) 48 h before cell transfer (CLL Co-T). Single transfer of CD8+ T cells (Cor93) and untreated HBV Tg mice (PBS) were used as controls. (h) Representative flow cytometry plots showing the frequency of KCs at day 5 post T cell transfer. (i) Frequency of KCs at day 5 post cell transfer. (j) Frequency of hepatic resident macrophages and DCs in indicated groups of mice at day 5 post T cell transfer. (k) IHL numbers in indicated groups of mice at day 5 post cell transfer. (l) Absolute numbers of hepatic Cor93 T cells and IFN-g+ Cor93 T cells at day 5 post cell transfer. (a-f) n = 3 (PBS), 3 (Cor93), 5 (+KCs Co-T), 6 (-KCs Co-T). Data are representative of at least 3 independent experiments. (g-l) n = 3 (PBS), 3 (Cor93), 4 (Ctr Co-T), 4 (CLL Co-T). Data are representative of at least 2 independent experiments. Data are expressed as mean ± SEM and analysed using two-tailed t-test or one-way ANOVA with Bonferroni post-test. * P<0.05, ** P<0.01, *** P<0.001, **** P<0.0001. Source data
Extended Data Fig. 10
Extended Data Fig. 10. IL-27 ameliorate HBV-specific CD8+ T cell function with minimal toxicity and off-target effects.
(a-b) MFIs of indicated markers on hepatic Cor93 T cells at day 5 post cell transfer. (c) Experimental design: Cor93 naïve CD8+ T cells were transferred in HBV Tg mice. After 5 days, Cor93 CD8+ T cells were isolated from the liver and put in culture in the presence or absence of the cognate peptide and/or rIL-27. Analyses were performed 48 h after in vitro culture. (d) Representative flow cytometry plots showing the frequency of Sca-1+ and Granzyme-B producing Cor93 T cells after 48 h of in vitro culture. (e) Experimental design: HBV Tg mice were treated with rIL-27 (rIL-27) and compared with untreated HBV Tg mice (PBS). (f) sALT at indicated time points. (g) IHL numbers at day 5 post cell transfer. (h) Frequency of hepatic CD8+ T, CD4+ T and NK cells 5 days after treatment. (i) Numbers of hepatic CD8+ T, CD4+ T and NK cells in indicated groups of mice 5 days after treatment. (j) Frequency of Ki-67+ CD8+ T cells and Ki-67 MFI on hepatic CD8+ T cells 5 days post treatment. (k) Frequency of Sca-1+ CD8+ T cells and Sca-1 MFI on hepatic CD8+ T cells 5 days post treatment. (l) Frequency of Grzm-B producing CD8+ T and NK cells 5 days after treatment. (m) Representative MFI histograms of indicated markers on CD8+ T cells 5 days after treatment. (a-b) n = 3 (Ctr), 3 (PBS), 3 (rIL-27). Data are representative of at least 3 independent experiments. (c-e) n = 2 (WT), 5 (Cor93). Data are representative of at least 2 independent experiments. Each in vitro culture condition was performed in triplicate. (f-m) n = 3 (PBS), 3 (rIL-27). Data are representative of at least 2 independent experiments. CD8+ T cells were identified as Live, CD45+, CD3+, CD8+CD4. CD4+ T cells were identified as Live, CD45+, CD3+, CD4+CD8. NK cells were identified as Live, CD45+, CD3, NK1.1+NKp46+. All data are expressed as mean ± SEM and were analysed using two-tailed t-test or one-way ANOVA with Bonferroni post-test. * P<0.05, ** P<0.01, *** P<0.001.

References

    1. Iannacone, M. & Guidotti, L. G. Immunobiology and pathogenesis of hepatitis B virus infection. Nat. Rev. Immunol.22, 19–32 (2022). - PubMed
    1. Kawashima, K., Andreata, F., Beccaria, C. G. & Iannacone, M. Priming and maintenance of adaptive immunity in the liver. Annu. Rev. Immunol.42, 375–399 (2024). - PubMed
    1. Venzin, V., Beccaria, C. G., Andreata, F., Fumagalli, V. & Iannacone, M. Intrahepatic immunity to hepatitis B virus. J. Hepatol.81, 911–913 (2024). - PubMed
    1. Bertoletti, A. & Ferrari, C. Adaptive immunity in HBV infection. J. Hepatol.64, S71–S83 (2016). - PubMed
    1. Maini, M. K. & Burton, A. R. Restoring, releasing or replacing adaptive immunity in chronic hepatitis B. Nat. Rev. Gastroenterol. Hepatol.16, 662–675 (2019). - PubMed

MeSH terms

LinkOut - more resources