. 2025 Aug;44(16):4473-4498.
doi: 10.1038/s44318-025-00490-5. Epub 2025 Jun 30.

Sphingosine simultaneously inhibits nuclear import and activates PP2A by binding importins and PPP2R1A

Affiliations

Sphingosine simultaneously inhibits nuclear import and activates PP2A by binding importins and PPP2R1A

Vaishali Jayashankar et al. EMBO J. 2025 Aug.

Abstract

Sphingosine and constrained analogs like FTY720 and SH-BC-893 restrain tumor growth through incompletely defined mechanisms that include protein phosphatase 2A (PP2A) activation. Here we show that these compounds directly bind not only the PP2A scaffolding subunit PPP2R1A, but also the structurally related karyopherins importin-β1 (KPNB1), transportin-1 (TNPO1), importin-5 (IPO5), and importin-7 (IPO7). Binding to sphingosine-like molecules triggers reversible unfolding of these target proteins, resulting in activation of PP2A and inhibition of importins. Although sphingosine engages these proteins, ceramide does not, suggesting that these two endogenous tumor-suppressive sphingolipids work through distinct mechanisms. Simultaneous PP2A activation and importin inhibition reduces nuclear levels of proteins that drive cancer progression and therapeutic resistance such as JUN, YAP, MYC, androgen receptor, hnRNPA1, and NF-κB under conditions where compounds that target PP2A or KPNB1 individually are inactive. These findings provide new insights into sphingolipid biology and highlight a possible path toward cancer therapeutics that could overcome drug resistance.

Keywords: Homeostatic Growth Control; Nuclear Import; Protein Phosphatase 2A; Sphingosine.


Conflict of interest statement

Disclosure and competing interests statement. ALE and SH are inventors on a patent covering SH-BC-893. Other authors declare no competing interests. ALE, PT, and SH are co-corresponding authors. Requests for biological materials should be directed to ALE.

Figures
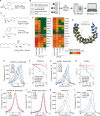
Figure 1
Figure 1. Sphingosine-like compounds directly bind PPP2R1A and a subset of importins.
(A) Active ligands shown with their IC50 in FL5.12 cells at 48 h. PHS phytosphingosine, alk alkyne. See also Appendix Fig. S1A–F. (B) Orthogonal chemoproteomics strategy. (C) Proteins enriched by ≥eightfold with a P value ≤ 0.01 by at least one active ligand in FL5.12 and/or mPCE cell lysates. See also Dataset EV1. (D) Overlay of human PPP2R1A (blue, PDB 1B3U) and amino acids 1–442 of human KPNB1 (KPNB1.1; yellow, PDB 1F59). (EJ) Thermal shift assays with recombinant PPP2R1A or KPNB1.1 and the indicated concentrations of active (blue) or inactive (red) ligand. Representative first derivative plots shown in (E, G, I, J). In (F, H), mean ± SD shown; n = 3–17, where each biological replicate is a mean of 3–4 technical replicates. Using a one-way ANOVA with Dunnett’s multiple comparisons test to compare treated and untreated control samples, ***P ≤ 0.001; **P ≤ 0.01; *P ≤ 0.05; unmarked points not significantly different from control, P > 0.05. See Appendix for exact P values. (K, L) Thermal shift assays performed with PPP2R1A (K) or KPNB1.1 (L) and vehicle (dashed line) or SH-BC-893 (dark blue) and repeated after dialysis to remove SH-BC-893 (light blue); n = 2, representative plots shown.
Figure 2
Figure 2. 893-diazirine crosslinks to PPP2R1A and KPNB1 at functionally important, conserved sites.
(A) Tandem mass spectrometry was used to identify the amino acids in recombinant PPP2R1A that UV-crosslinked to 893-diazirine (see also Appendix Figs. S4B and S5). Conservation determined using ConSurf (Ashkenazy et al, 2016) with default settings, asterisks indicate amino acids that are involved in inter-subunit hydrogen bonding (Cho and Xu, 2007). See also Dataset EV6. Crosslinking sites are shown on PDB 2IAE, a crystal structure of the complex of PPP2R1A (colored to show conservation), PPP2CA (Cα, grey), PPP2R5C (B56γ, grey), and microcystin (not shown). (B) As in (A) but for KPNB1.1, see also Dataset EV6. PDB 1F59 shown, with FxFG peptides (grey). (C) Stable SH-BC-893 binding sites on KPNB1 (PDB 3LWW) predicted by molecular dynamics simulations. KPNA2 (PDB 1QGK, pink). (D) Endogenous KPNB1 staining in 22Rv1 cells treated with 10 µM SH-BC-893. Scale bar, 20 µm.
Figure 3
Figure 3. Constrained cyclic sphingosine analog SH-BC-893 reduces nuclear levels of cargo proteins transported by KPNB1, TNPO1, IPO5, and IPO7.
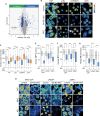
(A) Non-histone nuclear proteins in mPCE cells whose levels were altered by a 6 h treatment with 5 µM SH-BC-893 as determined by LC-MS/MS. Mean of four biological replicates shown. Significance was calculated using a t test. Volcano plot shows log₂(fold change) vs −log₁₀(P value). The curved significance threshold represents a false discovery rate (FDR)-adjusted boundary at 5%. See also Dataset EV7. (B, C) Endogenous YAP, JUN, hnRNPA1, or MYC localization in mPCE cells following a 6 h treatment with 5 µM SH-BC-893 or 20 µM perphenazine (PPZ). (DG) YAP, MYC, or AR localization in the indicated cell lines treated with 15 µM (MYC-CaP and LNCaP) or 10 µM (22Rv1) SH-BC-893. All cells were maintained in 10 nM dihydrotestosterone (DHT) where AR is evaluated, LNCaP cells were also maintained in DHT during YAP and MYC evaluation. In (D), fluorescence intensity scale as in (B). For (D), larger field of view shown in Appendix Fig. S8A. Box-and-whisker plots display the median and interquartile range (box), as well as the range of the lower and upper quartiles (whiskers). In (C, EG), n > 200 cells from two biological replicates. As a visual inspection and a D’Agostino & Pearson test indicated that the data was not normally distributed, a Kruskal–Wallis with Dunn’s multiple comparisons test (C) or Mann–Whitney test (EG) was applied; ***P ≤ 0.001 or ns, not significant P > 0.05. See Appendix for exact P values. Scale bars, 20 µm.
Figure 4
Figure 4. The parallel actions of SH-BC-893 on PPP2R1A and KPNB1 contribute to MYC and AR inhibition.
(A) Model for SH-BC-893 inhibition of MYC and AR through redundant pathways. PPZ, perphenazine; epox, epoxomicin; IPZ, importazole. Endogenous AR (B, C) or MYC (D) and Appendix Fig. S9A) localization in 22Rv1 cells treated with 10 µM SH-BC-893 or 25 µM PPZ ± 100 nM epoxomicin for 6 h. In (C, D), n > 140 cells from two biological replicates. (E) Model showing mechanism for FLAG-PPP2R1A degradation in response to the auxin NAA in homozygous knock-in cells. See also Appendix Fig. S9B,C. (F, G) FLAG-PPP2R1A or endogenous MYC localization in 293T-AID-2R1A cells treated with SH-BC-893 (10 µM) or PPZ (25 µM) for 6 h ± a 3 h pre-treatment with 500 µM NAA. In (G), n > 150 cells from two biological replicates. (H) Western blot validating doxycycline-inducible over-expression of KPNB1 in mPCE cells. Representative blot shown, n = 3. (I, J) KPNB1 or endogenous MYC localization in mPCE-doxi-KPNB1 cells treated for 6 h with SH-BC-893 (5 µM) or IPZ (40 µM) ± an overnight treatment with 1 µg/ml doxycycline. In (J), n > 200 cells from two biological replicates. Box-and-whisker plots display the median and interquartile range (box), as well as the range of the lower and upper quartiles (whiskers). In (F, I), fluorescence intensity scale for nuclear proteins as in (B). In (C, D, G, J) a visual inspection and a D’Agostino & Pearson test indicated that the data was not normally distributed and a Kruskal–Wallis test with Dunn’s multiple comparisons test was applied; ***P ≤ 0.001; **P ≤ 0.01; *P ≤ 0.05; ns, not significant P > 0.05. See Appendix for exact P values. Scale bars, 20 µm.
Figure 5
Figure 5. Sphingosine, but not ceramide, binds PPP2R1A and inhibits importins.
(A, B) Recombinant PPP2R1A (A) or KPNB1.1 (B) binding to SH-BC-893 (893), sphingosine (SO), C2-ceramide (C2cer), or C6-ceramide (C6cer) was evaluated in thermal shift assays; mean ± SD shown, n = 3–17 where each biological replicate is a mean of 3–4 technical replicates. (C) Metabolic pathways regulating sphingosine levels. SK1/2, sphingosine kinase 1 or 2. (D) Validation of SK1 WT and KO MEFs by RT-PCR, representative gel shown, n = 2. (E, F) d18:1 sphingosine (E) or S1P (F) levels over time in wild-type (WT) or SK1 KO MEFs treated with 10 µM d18:1 sphingosine as measured by LC-MS/MS; mean ± SD, n = 3. (G, H) YAP localization in SK1 WT or KO MEFs treated for 6 h with 10 µM sphingosine. In (H), n > 100 cells from two biological replicates. (I, J) YAP localization in SK1 KO MEFs treated with SH-BC-893 (15 µM), sphingosine (15 µM), or PPZ (25 µM) ± epoxomicin (100 nM) for 3 h. In (J), n > 200 cells from two biological replicates. (KM) NF-κB (p65) localization in SK1 WT or KO MEFs treated with 20 nM TNF-α and vehicle (ethanol), SH-BC-893 (5 µM), or sphingosine (10 µM) for 1 h. In (L, M), n > 170 cells from two biological replicates. Box-and-whisker plots display the median and interquartile range (box), as well as the range of the lower and upper quartiles (whiskers). In (I, K), intensity scale same as in (G). Using a one-way ANOVA with Dunnett’s multiple comparisons test to compare to the untreated control (A, B), or a D’Agostino and Pearson normality test followed by a Kruskal–Wallis test with Dunn’s multiple comparisons test (H, J, L, M), ***P ≤ 0.001; **P ≤ 0.01; *P ≤ 0.05; ns, not significant P > 0.05. See Appendix for exact P values. In (A, B), asterisks are colored to match the compound being compared to its untreated control. In (E, F), black asterisks compare WT and KO with multiple t tests, red or blue asterisks compare individual time points for each cell line with its own untreated control using an ANOVA. Scale bars, 20 µm.
Figure 6
Figure 6. Endogenous sphingosine inhibits importins.
(A) Structures of PF-543 and sphingosine. (B) Thermal shift assays using recombinant PPP2R1A or KPNB1.1 and the indicated concentrations PF-543. Representative first derivative plots shown; n = 3. (C, D) Endogenous sphingosine (SO) (C) or S1P (D) levels in HeLa cells treated for the indicated time with PF-543 (100 nM) measured by LC-MS/MS; mean ± SD, n = 3. (E, F) NF-κB localization in HeLa cells treated with 100 ng/ml TNFα for 30 min. Cells were treated with 100 nM PF-543 for 6 h. In (F), n > 150 cells from two biological replicates. (G) ACER1 expression was induced in HeLa cells with 10 ng/ml doxycycline for the indicated time interval and sphingosine levels measured by LC-MS/MS; mean ± SD, n = 3. (HJ) JUN and YAP localization in ACER1-TET-ON HeLa cells treated for 6 h with SH-BC-893 (10 µM) or doxycycline (10 ng/ml) for 24 h. In (I, J), n > 500 cells from two biological replicates. In (H), fluorescence intensity scale for nuclear proteins as in (E). Box-and-whisker plots display the median and interquartile range (box), as well as the range of the lower and upper quartiles (whiskers). Using a one-way ANOVA with Dunnett’s multiple comparisons test (C, D, G), a D’Agostino and Pearson normality test followed by a Kruskal–Wallis test with Dunn’s multiple comparisons test (F, I, J), ***P ≤ 0.001; **P ≤ 0.01; *P ≤ 0.05; ns, not significant P > 0.05. See Appendix for exact P values. Scale bars, 20 µm.

References

    1. Abraham MJ, Murtola T, Schulz R, Páll S, Smith JC, Hess B, Lindahl E (2015) GROMACS: high performance molecular simulations through multi-level parallelism from laptops to supercomputers. SoftwareX 1–2:19–25
    1. Antonarakis ES, Lu C, Wang H, Luber B, Nakazawa M, Roeser JC, Chen Y, Mohammad TA, Chen Y, Fedor HL et al (2014) AR-V7 and resistance to enzalutamide and abiraterone in prostate cancer. N Engl J Med 371:1028–1038 - PMC - PubMed
    1. Ashkenazy H, Abadi S, Martz E, Chay O, Mayrose I, Pupko T, Ben-Tal N (2016) ConSurf 2016: an improved methodology to estimate and visualize evolutionary conservation in macromolecules. Nucleic Acids Res 44:W344–W350 - PMC - PubMed
    1. Bai A, Liu X, Bielawski J, Hannun YA (2019) Bioactive sphingolipid profile in a xenograft mouse model of head and neck squamous cell carcinoma. PLoS ONE 14:e0215770 - PMC - PubMed
    1. Bayliss R, Littlewood T, Stewart M (2000) Structural basis for the interaction between FxFG nucleoporin repeats and importin-beta in nuclear trafficking. Cell 102:99–108 - PubMed

MeSH terms

LinkOut - more resources