. 2025 Jul;26(7):1182-1197.
doi: 10.1038/s41590-025-02191-x. Epub 2025 Jun 30.

Chemosensor receptors are lipid-detecting regulators of macrophage function in cancer

Affiliations

Chemosensor receptors are lipid-detecting regulators of macrophage function in cancer

Giulia Marelli et al. Nat Immunol. 2025 Jul.

Abstract

Infiltration of macrophages into tumors is a hallmark of cancer progression, and re-educating tumor-associated macrophages (TAMs) toward an antitumor status is a promising immunotherapy strategy. However, the mechanisms through which cancer cells affect macrophage education are unclear, limiting the therapeutic potential of this approach. Here we conducted an unbiased genome-wide CRISPR screen of primary macrophages. Our study confirms the function of known regulators in TAM responses and reveals new insights into the behavior of these cells. We identify olfactory and vomeronasal receptors, or chemosensors, as important drivers of a tumor-supportive macrophage phenotype across multiple cancers. In vivo deletion of selected chemosensors in TAMs resulted in cancer regression and increased infiltration of tumor-reactive CD8+ T cells. In human prostate cancer tissues, palmitic acid bound to olfactory receptor 51E2 (OR51E2) expressed by TAMs, enhancing their protumor phenotype. Spatial lipidomics analysis further confirmed the presence of palmitic acid in close proximity to TAMs in prostate cancer, supporting the function of this lipid mediator in the tumor microenvironment. Overall, these data implicate chemosensors in macrophage sensing of the lipid-enriched milieu and highlight these receptors as possible therapeutic targets for enhancing antitumor immunity.


Conflict of interest statement

Competing interests: E.L. received research funding from Bristol Myers Squibb unrelated to this study and consulting fees from Swarm Therapeutics, Menarini, Amgen, Pfizer and BioLegend. F.B. has received institutional research funds from ADC Therapeutics, Bayer AG, BeiGene, Floratek Pharma, Helsinn, HTG Molecular Diagnostics, Ideogen AG, Idorsia Pharmaceuticals Ltd., Immagene, ImmunoGen, Menarini Ricerche, Nordic Nanovector ASA, Oncternal Therapeutics and Spexis AG; consultancy fees from BIMINI Biotech, Floratek Pharma, Helsinn, Immagene, Menarini and Vrise Therapeutics; advisory board fees to the institution from Novartis. F.B. has also provided expert statements to HTG Molecular Diagnostics and has received travel grants from Amgen, Astra Zeneca and iOnctura. H.M. has received royalties from Chemcom, research grants from Givaudan and consultant fees from Kao. The remaining authors declare no competing interests.

Figures
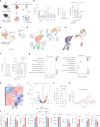
Fig. 1
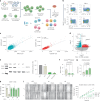
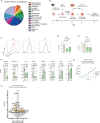
Fig. 1. Profiling the immune cell infiltration in prostate cancer models.
a, Experimental scheme for the profiling of the composition of the immune microenvironment by multiparametric flow cytometry and scRNA-seq in the prostate of transgenic Ptenpc−/−Trp53pc−/− (tumor) and healthy (nontumor) mice. b, FACS analysis of macrophages in Ptenpc−/−Trp53pc−/− transgenic prostate compared to nontumor tissue. Quantification of immune infiltrating cells (n = 4 nontumor-bearing mice and n = 6 Ptenpc−/−Trp53pc−/− mice). Total macrophages were gated on CD45+ cells. The percentages of CD206MHCII+, CD206+MHCII+/ and ARG1-expressing macrophages were gated on F4/80+CD11b+. c, Uniform manifold approximation and projection (UMAP) of CD45+ cells in Ptenpc−/−Trp53pc−/− transgenic prostate. Fourteen clusters characterized by lineage-specific and cluster-enriched genes were identified by integrated analysis. d, UMAP of scRNA-seq data from macrophages from Ptenpc−/−Trp53pc−/− transgenic prostate (n = 2). e, Trajectory analysis of macrophages using Monocle3 inference methods. f, FACS analysis of macrophages in murine prostate orthotopically injected with Pten−/−Trp53−/− cells compared to macrophages in nontumor tissue (n = 4 mice per group). g, GSEA showing downregulated biological pathways (pathways down) and upregulated biological pathways (pathways up) in TAMs. The size of each dot indicates the number of enriched genes relative to the pathway of interest. The fraction of genes represents the proportion of the total number of genes in the pathway that were significantly enriched. h, Heat map illustrating all the differentially expressed genes according to bulk mRNA-seq from nonconditioned macrophages (untreated (Untr.), left) and macrophages exposed to conditioned media from Pten−/−Trp53−/− cells (CM-tr., right). i, Volcano plot showing differentially expressed genes in CM-tr. macrophages compared to Untr. Genes are colored according to their log2FC value (blue, log2FC ≤ −0.5; red, log2FC ≥ 0.5). j, Proliferation of CD8+ T cells exposed to supernatant from Untr. and CM-tr. macrophages: bar graph shows the number of divisions (n = 3 per group). k, Scratch assay: graph shows the quantification of distance (μm) covered by tumor cells over time after exposure to supernatant from Untr. or CM-tr. macrophages (n = 9 per group). l, FACS analysis of macrophages upon exposure to Pten−/−Trp53−/− conditioned media: percentages of cells were gated on F4/80+CD11b+ cells (n = 5 per group). Statistical analyses were performed using two-tailed unpaired Student’s t-test. Values are presented as the mean ± s.e.m. Schematic in a created using BioRender.com. NK, natural killer; DC, dendritic cells; PMN, polymorphonuclear neutrophils; Mono-Mac, monocyte–macrophages; Inflam-Macs, inflammatory macrophages; Angio-Macs, angiogenic macrophages; LA-Macs, lipid-laden macrophages; RTM-Macs; Reg-Macs, Cl6 regulatory macrophages; INF-Macs, macrophages defined by Cl3 interferon-related genes; LPS, lipopolysaccharide; ECM, extracellular matrix; Pos., positive; NA, not applicable; MFI, mean fluorescence intensity; NS, not significant.
Fig. 2
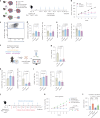
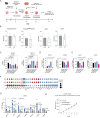
Fig. 2. CRISPR–Cas9 screening of primary mouse macrophages to identify TAM regulators.
a, Experimental scheme of genome-wide CRISPR–Cas9 Knockout GecKO v2 Library B screening in primary murine macrophages. b, Representative plot of backbone (LGP) or library-B-infected macrophages exposed or not to conditioned media from Pten−/−Trp53−/− tumor cells. c, Two independent experiments were performed. Graphs show the correlations between the distribution of the guides found in the CD206MHCII+ population (MHCII) and in the CD206brightMHCII population (CD206) from the two experiments. Lib1, library 1; Lib2, library 2. d, Volcano plot showing genes related to the differentially enriched sgRNA guides from CD206MHCII+ versus CD206brightMHCII cells. Negative regulators of the CD206brightMHCII population are shown in light blue, and positive regulators are shown in red. log2FC ± 0.56, P < 0.005. Statistical analyses and comparisons from NGS output were performed with MAGeCK. e, Western blot analysis showing the percentage of expression of total STAT6. Two independent sgRNA guides (g1 and g2) were utilized to silence Stat6 in macrophages (n = 2). f,g, FACS analysis of control (LGP) and Stat6-silenced (g1 and g2) macrophages following exposure to Pten−/−Trp53−/− conditioned media, with events gated on F4/80+CD11b+ cells: LGP n = 5, g1 n = 5, g2 n = 6 (f); LGP n = 4, g1 n = 4, g2 n = 4 (g). h, Proliferation of CD8+ T cells exposed to supernatant from Untr. and CM-tr. macrophages: bar graph shows the number of divisions. i, Scratch assay: graph and curves showing the distance (μm) covered by tumor cells over time after exposure to supernatant from Untr. or CM-tr. macrophages (n = 8). Statistical analyses were performed using two-tailed unpaired Student’s t-test. Values are presented as the mean ± s.e.m. All replicates represent biological replicates. Schematic in a created using BioRender.com. Source data
Fig. 3
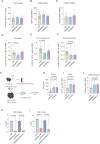
Fig. 3. Genetic deletion of selected chemosensors on tumor-conditioned macrophages.
ae, FACS analysis of macrophages in the absence (LGP) or presence (OLFR644−/−) of Olfr644 deletion and Vmn2r29 deletion (Vmn2r29−/−). Macrophages were exposed to Pten−/−Trp53−/− conditioned media. Events were gated on F4/80+CD11b+ cells. Bar graphs show ratios between conditions: mean fluorescence intensity of CD206 (a); percentages of CD206brightMHCII (b) and CD206MHCII+ (c) cells gated on F4/80+CD11b+ cells (LGP n = 4, Vmn2r29−/− n = 4, Olfr644−/− n = 4); and percentages of ARG1+ (d) and CD39+ (e) cells gated on F4/80+CD11b+ cells (LGP n = 4, Vmn2r29−/− n = 5, Olfr644−/− n = 3). f, Venn diagrams showing common and specific genes among the differentially expressed genes calculated for the three conditions: LGP + Pten−/−Trp53−/− conditioned media versus LGP; OLFR644 + Pten−/−Trp53−/− conditioned media versus LGP + Pten−/−Trp53−/− conditioned media; VMN2R29 + Pten−/−Trp53−/− conditioned media versus LGP + Pten−/−Trp53−/− conditioned media. g, Graphs showing change in expression of selected genes among differentially expressed genes from the three comparisons (red, upregulated; blue, downregulated). h, Proliferation of CD8+ T cells exposed to supernatant from Untr. and CM-tr. macrophages: the bar graph shows the number of divisions (LGP Untr. n = 5, LGP CM-tr. n = 4, Vmn2r29−/− Untr. or Cm-tr. n = 6, Olfr644−/− Untr. or Cm-tr. n = 6). i, Scratch assay: graph and curves showing the distance (μm) covered by tumor cells over time after exposure to supernatant from Untr. or CM-tr. macrophages (LGP n = 6, VMN2R29 n = 6, OLFR644 n = 6). j,k, Flow cytometry analysis to assess the impact of chemosensor gene silencing on macrophage phenotypes. Olrf644−/− and Vmn2r29−/− macrophages were compared to control macrophages (LGP) after exposure to conditioned media from ovarian ID8 cancer cells (LGP n = 3, NT n = 3, Vmn2r29−/− n = 4, Olfr644−/− n = 3) (j) or breast 4T1 cancer cells (LGP n = 3, NT n = 3, Vmn2r29−/− n = 3, Olfr644−/− n = 3) (k). Events were gated on F4/80+CD11b+ cells. Statistical analyses were performed using two-tailed unpaired Student’s t-test. Values are presented as the mean ± s.e.m. All replicates represent biological replicates.
Fig. 4
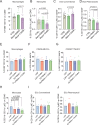
Fig. 4. Infusion of genetically modified macrophages in a prostate cancer model.
a, Experimental scheme. Mice were injected twice per week with LGP-Macs, Olfr644−/− Macs or Vmn2r29−/− Macs (n = 7 mice per group). b, Tumor growth expressed as a percentage of the initial volume. c, Representative FACS plot of GFP and GFP+ tumor-infiltrating macrophages. d,e, Results of FACS analysis to determine the immune infiltrate in mice injected with LGP, OLFR644-KO or VMN2R29-KO, showing: percentages of cells gated on GFP+F4/80+CD11b+ cells (LGP n = 7, VMN2R29-KO n = 8, OLFR644-KO n = 8) (d); and percentages of proliferating CD39+ cells gated on CD8+ T cells and FoxP3+ CD25+ Treg cells gated on CD4+ T lymphocytes (LGP n = 7, VMN2R29-KO n = 7, OLFR644-KO n = 8) (e). f, Experimental scheme: mice were contextually injected orthotopically with Pten−/−Trp53−/− and with LGP-Macs (n = 4 mice), Olfr644−/− Macs (n = 5 mice) or Vmn2r29−/− Macs (n = 4 mice). g, Tumor volumes calculated at sacrifice. h,i, FACS analysis to determine the immune infiltrate in LGP, OLFR644-KO or VMN2R29-KO injected mice; percentages of cells gated on GFP+F4/80+CD11b+ cells (h) and percentages of CD39+ cells gated on CD8+ T cells and Treg cells gated on CD4+ T lymphocytes (i) are shown. j, Experimental scheme: mice were injected twice per week with LGP-Macs or Olfr644−/− Macs and with anti-CD8 antibody or isotype control. k,l, Tumor growth expressed as a percentage of the initial volume (k) and tumor volumes at the day of sacrifice (l) (LGP isotype n = 4, LGP anti-CD8 n = 7, OLFR644 isotype n = 8, OLFR644 anti-CD8 n = 8). Statistical analyses were performed using two-tailed unpaired Student’s t-test. Values are presented as the mean ± s.e.m. All replicates represent biological replicates. Schematic in a created using BioRender.com.
Fig. 5
Fig. 5. Pharmacological inhibition of olfactory receptor in a prostate cancer model.
a, FACS analysis of LGP (n = 3), OLFR644-KO (n = 3) and VMN2R29-KO (n = 3) macrophages exposed to 13-cRA for 4 h with and without Pten−/−Trp53−/− conditioned media. Events are plotted as ratio versus conditioned macrophages. b,c, Experimental scheme (b) and tumor growth (c): mice were injected intravenously with macrophages pretreated for 4 h with DMSO (n = 8) or 13-cRA (n = 9). Ctrl mice were untreated. c, Tumor growth expressed as a percentage of the initial volume. d, Representative FACS plot of GFP and GFP+ tumor-infiltrating macrophages. e,f, FACS analysis: percentage of cells gated on GFP+F4/80+CD11b+ cells (Macs + DMSO or 13-cRA, n = 8) (e); percentages of CD39+ cells gated on CD8+ T cells and FoxP3+CD25+ Treg cells gated on CD4+ T cells (Untr., Macs + DMSO or 13-cRA, n = 9) (f). g, Response of splenocytes to mitomycin-C-killed tumor cells was examined ex vivo using tumor cell restimulation assays. IFNγ production in response to stimulation was assessed through ELISA or FACS analysis after a 72-h incubation period (Untr. n = 10, Macs + DMSO n = 8, Macs + 13-cRA n = 10). h, Tumor growth expressed as a percentage of the initial volume. Mice were injected intravenously with LGP-Macs or Olfr644−/− Macs pretreated for 4 h with DMSO or 13-cRA. i,j, FACS analysis: percentages of cells gated on GFP+F4/80+CD11b+ cells (LGP n = 6, LGP+13-cRA n = 6, OLFR644 n = 8, OLFR644 + 13-cRA n = 6) (i); and percentages of CD39+ cells gated on CD8+ T cells and Treg cells gated on CD4+ T cells (LGP n = 6, LGP + 13-cRA n = 6, OLFR644 n = 8, OLFR644 + 13-cRA n = 6) (j). Statistical analyses were performed using two-tailed unpaired Student’s t-test. Values are presented as the mean ± s.e.m. All replicates represent biological replicates.
Fig. 6
Fig. 6. Analysis of OR51E2 on human macrophages.
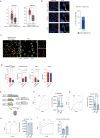
a, Volcano plot showing differentially expressed genes in prostate cancer tissues compared to normal tissue from The Cancer Genome Atlas. Genes are colored according to their log2FC value (blue, log2FC ≤ −0.5; red, log2FC ≥ 0.5). Data were analyzed using GEPIA2. b, Representative confocal immunofluorescence images and quantification of human prostate cancer tissues (patient 1) showing expression of OR51E2 (red) in CD68+ macrophages (green). Nuclei were counterstained with DAPI (blue). Images were acquired with an SP8-II confocal microscope (Leica). Scale bar, 10 µm; number of fields = 5. c, Representative confocal immunofluorescence images and quantification of OR52E2 expression in human Thp1 cells with and without genetic deletion of OR51E2. Each dot represents one cell. n ≥ 10. d, Bar graphs showing percentages of CD206+ and HLA-DR+ macrophages gated on CD68+ upon exposure to conditioned media from PC3 tumor cells, in the presence or absence of partial genetic deletion of OR51E2. Results are expressed as the FC of the CM-tr. over the Untr. group (CD206: Untr. n = 4, short interfering RNA (siRNA) n = 5, CM-tr. or siRNA + CM-tr. n = 6; HLA-DR: Untr. n = 3, siRNA n = 3, CM-tr. or siRNA + CM-tr. n = 3). Statistical analyses were performed using two-tailed unpaired Student’s t-test. Values are presented as the mean ± s.e.m.
Fig. 7
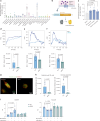
Fig. 7. Effect of palmitic acid on human macrophages.
a, Lipidomic analysis of conditioned media from PC3 prostate cancer cells. Results are expressed as the percentage of each fatty acid relative to the total fatty acids detected (n = 4). b,c, Luciferase reporter gene assay. Experimental scheme (b). Cells were transfected with 20 ng per well of plasmids encoding an olfactory receptor, 5 ng per well of RTP1S, 10 ng per well of CRE–luciferase and 5 ng per well of pRL-SV40. Twenty-four hours later, cells were stimulated by incubation with 50 μM palmitic acid, sodium acetate or sodium propionate. Four hours after stimulation, luminescence was measured. Bar plot showing all luminescence values divided by Renilla luciferase activity to control for transfection efficiency in a given well (c). Each comparison was performed in three technical triplicates (n = 6). df, Ca2+ flux in primary macrophages in the absence or presence of partial genetic deletion of OR51E2-KO treated with palmitic acid (100 μM) (Ctrl n = 5, siRNA n = 6) (d), acetate (Ctrl n = 5, siRNA n = 7) (e) or propionate (Ctrl n = 4, siRNA n = 4) (f). g, Immunofluorescence showing palmitic acid (green) and OR51E2 (red) on primary macrophages in the presence or absence of RNA KO of OR51E2. Palmitic acid was administered to the cells for 10 min or 1 h before quantification. h, Results are expressed as fluorescence intensity per cell (Ctrl n = 5, siRNA 10 min n = 6, siRNA 1 h n = 5). i, Expression of CD206 and HLA-DR by FACS on wild-type or OR52E1-KO THP1 cells. Cells were conditioned with either PC3-conditioned media or palmitic acid (100 µM) (CD206: Untr. or siRNA n = 3, CM-tr. or siRNA + CM-tr. n = 3; palmitic-tr. or siRNA + palmitic-tr. n = 4 or 6; HLA-DR: Untr. or siRNA n = 3, CM-tr. or siRNA + CM-tr. n = 3; palmitic-tr. or siRNA + palmitic-tr. n = 4). Statistical analyses were performed using two-tailed unpaired Student’s t-test. Values are presented as the mean ± s.e.m. Schematic in b created using BioRender.com.
Fig. 8
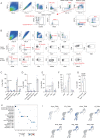
Fig. 8. Palmitic acid accumulates in tumor regions and modulates macrophage phenotype.
a, Representative images of patient biopsies analyzed by hematoxylin and eosin (H&E; T, neoplastic tissue; A, adjacent normal tissue); spatial analysis of the distribution of palmitic acid by mass spectrometry imaging; and mosaic immunofluorescence showing CD68 (green), pancytokeratin (Pan-CK, red) and nuclei (DAPI, blue). b, Quantification of palmitic acid in patient biopsies, comparing tumoral (Tum.) versus nontumoral (No tum.) areas within each patient. n = 4 patients. Two-tailed paired Student’s t-test was used for the statistical analysis. c, H&E and spatial analysis of the distribution of palmitic acid by mass spectrometry imaging in patient number 2. d, Segmented images (inset) showing nontumor (left) and tumor (right) regions. e, Heat map showing significant pairwise cell–cell interaction (red) or avoidance (blue) across the nontumor and tumor regions. f, UMAP identifying two nontumoral and two tumor clusters. g, Spatial distribution of the cluster shown in f. h, Spatial distribution of inflammatory TAM (Inflam-TAM), TAM defined by Cl3 interferon-related genes (IFN-TAM), lipid-laden TAM (LA-TAM), angiogenic TAM (Angio-TAM) and Cl6 regulatory TAM (Reg-TAM) signatures in patient number 2; image represents the enrichment of each signature and its spatial distribution. i, Distribution of each signature from h in the four identified areas: each dot represents a gene, and the size of the dot is representative of the expression level (exp.) of the gene. j, Bubble plot representing the expression of selected genes in the four identified areas. Unless otherwise specified, statistical analyses were performed using two-tailed unpaired Student’s t-test. Values are presented as the mean ± s.e.m. Max., maximum; Min., minimum; TH cell, T helper cell.
Extended Data Fig. 1
Extended Data Fig. 1. Analysis of the tumor immune infiltrate in transgenic Ptenpc-/-; Trp53pc-/- model.
a-b) Gating strategy used to define the myeloid and lymphoid sub-populations. Representative FACS plot from the Ptenpc-/-; Trp53pc-/- model. c) Events are gated on CD45+ cells. d-e)% of naive, central memory, effector, effector memory and Treg cells gated on the (d) CD4+ subset and the (e) CD8+ subset. f-g) % of cells expressing functional markers gated on CD4+ and CD8+ cells. g) % of CD39+ cells gated on CD8+ cells. h) Cell Typist classification: each cluster is annotated with its predicted cell type. i) UCell score distribution in UMAP space for seven gene signatures. Statistical analyses were performed using two-tailed unpaired Student’s t test. Values are presented as mean ± SEM.
Extended Data Fig. 2
Extended Data Fig. 2. Analysis of the tumor immune infiltrate in transgenic Pten-/-; Trp53-/- orthotopic model.
a) Bar graphs showing results of the FACS analysis on the Pten-/-; Trp53-/- orthotopic model. Same strategy as shown in Extended Data Fig. 1. Events are gated on CD45+ cells. b-c) % of naive, central memory, effector, effector memory and Treg cells gated on the (b) CD4+ subset and the (c) CD8+ subset. d-e) % of cells expressing functional markers gated on CD4+ and CD8+ cells. f) % of CD39+ cells gated on CD8+ cells. g) Heat map illustrating top 200 differentially expressed genes from bulk mRNA-Seq on sorted macrophages from the Pten-/-; Trp53-/- orthotopic model. h) Experimental scheme of in vitro conditioning of macrophages. i) Representative FACS plot showing non- conditioned macrophages (Untreated=Untr, left) and macrophages exposed to conditioned media from Pten-/-; Trp53-/- cells (Conditioned =CM-tr, right). j) Proliferation of CD8 + T cells exposed to supernatant derived from ex vivo macrophages. Macrophages were sorted from either tumor (n = 3) or healthy tissues (n = 6) and cultured for two days to collect conditioned supernatant. CD8 + T cells were subsequently exposed to these supernatants to assess their proliferation: bar graph represents the number of divisions. k) % of ARG1+ cells on CD206 + FACS-sorted macrophages (Untr n = 7, CM-tr n = 12. L) RT-qPCR gene expression analysis on CD206+ and CD206- FACS sorted macrophages (n = 3). Statistical analyses were performed using two-tailed unpaired Student’s t test. Values are presented as mean ± SEM. Schematic in h created using BioRender.com.
Extended Data Fig. 3
Extended Data Fig. 3. Stat6 genetic deletion in TAMs.
a) Macrophages transduced with the CRISPR-Cas9 GeCKOv2 library were sorted based on MHC II and CD206 expression. Negative regulators were ranked based on pvalue (<=-0.005) and the first 200 genes were grouped into functional families. The pie chart shows the percentage distribution of the identified genes. b) Experimental scheme of in vitro Stat6 genetic deletion on primary bone marrow derived macrophages. Two independent sgRNA (g1 and g2) have been employed. c) Representative FACS plot showing the expression of CD206 and MHCII on LGP (CTRL) and Stat6 KO (g1 and g2) macrophages. d-e) FACS analysis of control (LGP) and STAT6 silenced (g1 and g2) macrophages upon exposure to Pten-/-; Trp53-/- conditioned media: (d) % of ARG1+ (LGP n = 4, g1 n = 4, g2 n = 4) and (e) CD39+ cells (LGP n = 3, g1 n = 3, g2 n = 3) gated on F4/80 + CD11b+ cells. f) RT-qPCR gene expression analysis on LGP or Stat6 KO macrophages exposed to Pten-/-; Trp53-/- media. Bar graphs show the fold change of treated cells versus untreated for each condition g) Scratch assay: graph and curves showing the distance (um) covered by tumor cells over time after exposure to supernatant from untreated macrophages (n = 9/group). h) Volcano plot showing chemosensor genes related to the differentially enriched sgRNA guides from CD206-MHCII+ vs CD206brightMHCII- cells. Olfactory receptors are shown in orange, Vomeronasal receptors are shown in green. Statistical analyses were performed using two-tailed unpaired Student’s t test. Values are presented as mean ± SEM. Schematic in b created using BioRender.com.
Extended Data Fig. 4
Extended Data Fig. 4. Chemosensor genetic deletion re-educate TAMs.
a) Experimental scheme of OLFR644 and VMN2R29 genetic deletion on primary bone marrow derived macrophages. b) FACS analysis of LGP and NT macrophages exposed to Pten-/-; Trp53-/- media. NT= non- targeting guides. (CD206-MHCII + LGP n = 5, NT n = 5; CD206BrightMHCII- LGP n = 6, NT n = 9; ARG LGP n = 6, NT n = 9; CD39 LGP n = 6, NT n = 8). c) RT-qPCR gene expression analysis on LGP or chemosensor KO macrophages. Bar graphs show the fold change of treated cells versus untreated for each condition. (CD206: LGP n = 4, OLFR229-/- n = 3, OLFR644-/- n = 4, OLFR192-/- n = 4, VMN1R87-/- n = 3, VMN2R29-/- n = 4; MHCII: LGP n = 4, OLFR229-/- n = 4, OLFR644-/- n = 3, OLFR192-/- n = 4, VMN1R87-/- n = 4, VMN2R29-/- n = 3). d-e) FACS analysis on macrophages in absence (LGP n = 4) or presence of OLFR229 deletion (n = 3), OLFR192 deletion (n = 3) and VMN1R87 deletion (n = 3). Events are gated on F4/80 + CD11b+ cells. Bar graphs show the ratio between conditions: (d) % of CD206-MHCII+ and % of CD206brightMHCII- (e) % of ARG1+ and % of CD39+ cells. (d) and (e) one-way ANOVA test with Tukey’s multiple comparisons test was used. f) Bulk mRNA-seq was performed on non-conditioned LGP, Olfr644-/-, and Vmn2r29-/- Macs and LGP, Olfr644-/-, and Vmn2r29-/- Macs exposed to conditioned media from Pten-/-; Trp53-/-cells. The balloon plot shows predicted upstream regulators identified using Ingenuity Pathway Analysis (IPA) by comparing macrophages exposed to conditioned medium and their respective untreated controls. In the LGP condition, genes were ranked based on their pvalue and the top 25 genes were selected. Each balloon represents an upstream regulator, with size indicating the activation Z-score and color reflecting its predicted activation state (red = activated, blue = inhibited). g) RT-qPCR gene expression analysis on Hif1a downstream genes performed on LGP or chemosensor- KO macrophages. Bar graphs show the fold change of treated cells versus untreated for each condition. h) Scratch assay: graph and curves showing the distance (um) covered by tumor cells over time after exposure to supernatant from untreated macrophages. When not specified, statistical analyses were performed using two-tailed unpaired Student’s t test. Values are presented as mean ± SEM. Schematic in a created using BioRender.com.
Extended Data Fig. 5
Extended Data Fig. 5. Role of chemosensors in macrophages in models of ovarian and breast cancer.
a-b) FACS plot and quantification of macrophages conditioned with conditioned media from ID8 or 4T1 cancer cells. (b) % of cells gated on F4/80+ cells (Ctrl n = 3, ID8 n = 6, 4T1 n = 6). c) % ARG1+ cells in CD206low and CD206bright FACS-sorted macrophages (Untr n = 7, Untr+CM n = 6). d-e) % ARG1+ cells gated on F4/80+ cells (ID8: LGP n = 3, NT n = 3, VMN2R29-/- n = 4, OLFR644-/- n = 3, 4T1: LGP n = 3, NT n = 3, VMN2R29-/- n = 3, OLFR644-/- n = 3). f-g) FACS analysis of LGP or Stat6 KO macrophages exposed to ID8 (f) or 4T1 (g) conditioned media (n = 2). Statistical analyses were performed using two-tailed unpaired Student’s t test. Values are presented as mean ± SEM (*, P < 0.05; **, P < 0.01; ***, P < 0.001).
Extended Data Fig. 6
Extended Data Fig. 6. Composition of the TME in mice injected with either OLFR644-/- or VMN2R29-/- macrophages.
a-f) FACS analysis to determine the immune infiltrate of tumors upon injection with LGP (n = 8), OLFR644-/- (n = 8) and VMN2R29-/- (n = 8) macrophages: a) Quantification of macrophages gated on CD45+ cells. b-c) % cells gated on GFP-F4/80 + CD11b+ cells. (d-f) % cells gated on CD45+ cells. g-i) The response of splenocytes to mitomycin c killed tumor cells was examined ex vivo using tumor cell restimulation assays. Interferon production in response to stimulation was assessed through ELISA (LGP n = 7, OLFR644 n = 5 and VMN2R29 n = 6) (h) or FACS analysis (LGP n = 6, OLFR644 n = 7 and VMN2R29 n = 8. (i) after a 72-hour incubation period. j)FACS analysis of interferon production in splenocytes from mice contextually injected orthotopically with Pten-/-; Trp53-/- and with LGP-Macs, OLFR644-/-Macs or VMN2R29-/- Macs. k-l) FACS analysis of CD8 + T lymphocytes to confirm the CD8 depletion in mice treated with antiCD8 antibody or isotype in (k) blood or (l) tumor. Events are gated on CD3+ cells. Statistical analyses were performed using two-tailed unpaired Student’s t test. Values are presented as mean ± SEM.
Extended Data Fig. 7
Extended Data Fig. 7. Composition of the TME in mice injected with macrophages exposed to 13-cRA.
a-d) FACS analysis to determine the immune infiltrate of tumors upon injection with macrophages pre-treated for 4 hours with DMSO or 13-cRA: (a) Quantification of macrophages gated on CD45+ cells. (b) % of monocytes gated on CD45+ cells. (c-d) % of dendritic cells gated on CD45+ cells (a-d Untr, Macs+DMSO or 13cRA n = 10). e-j) FACS analysis to determine the immune infiltrate of tumors upon injection with OLFR644-/- and VMN2R29-/- macrophages pre-treated for 4 hours with DMSO or 13-cRA: e) Quantification of macrophages gated on CD45+ cells. f-g) % cells gated on GFP-F4/80 + CD11b+ cells. (h-j) % cells gated on CD45+ cells. (E-J: LGP n = 6, LGP+13cRA n = 6, OLFR644 n = 7, OLFR644 + 13cRA n = 6). Statistical analyses were performed using two-tailed unpaired Student’s t test. Values are presented as mean ± SEM.
Extended Data Fig. 8
Extended Data Fig. 8. Expression of OR51E2 by human macrophages.
a) OR51E1 and OR51E2 expression in PCa human tissues respect to normal tissue. TGSA data were analysed using GEPIA2 (n tum= 492, n Normal= 152) and presented as Min to Max box-and-whisker plot, the box extends from the 25th to 75th percentiles and the whiskers reach the sample maximum and minimum values, the median is indicated at center line. b) Representative confocal immunofluorescence images and quantification of human PCa tissues (patient#2) showing the expression of OR51E2 (red) in CD68+ macrophages (green). Images were acquired with an SP8-II confocal microscope (Leica). Scale bar: 10um. c) Representative confocal immunofluorescence images showing PBMC- derived macrophages (CD68 + , green) expressing OR51E2 (red). Nuclei were counterstained with DAPI (blue). Images were acquired with an SP8- II confocal microscope (Leica) with a 40× objective. Images on the right are 2× digital zoom. d) Flow cytometry analysis to assess the impact of gene silencing on murine bone marrow derived macrophages. Control macrophages (LGP) were compared to OLFR78-KO (Or51e2-KO) macrophages after exposure to Pten-/-; Trp53-/- conditioned media. Cells were gated on F4/80 + CD11b+ cells. e) Schematic representation of the plasmid encoding OR, RTP1S, CRE-luciferase and 5 pRL-SV40. f-g) Ca2+ flux in THP1 cells in absence or presence of partial genetic deletion of OR51E2 KO treated with (f) β-ionone (100 µM) (Ctrl n = 6, treated n = 8), (g) palmitic acid (100 µM) (Ctrl n = 10, treated n = 11), or (h) ionomycin (2 µM) (Ctrl n = 3, treated n = 3). i) Ca2+ flux in primary macrophages in absence or presence of partial genetic deletion of OR51E2 KO treated with ionomycin (2 µM) (Ctrl n = 3, treated n = 3). Values are presented as mean ± SEM.
Extended Data Fig. 9
Extended Data Fig. 9. Expression of OR51E2 by human macrophages.
a) Gene set enrichment analysis (GSEA) showing up and downregulated biological pathways in BPMCs derived macrophages exposed or not to Palmitic acid. The size of each dot indicates the number of enriched genes relative to the pathway of interest. The fraction of genes represents the proportion of genes significantly enriched out of the total number of genes of the pathway. b) Volcano plot showing differential expressed genes in palmitic acid-exposed macrophages compared to untreated macrophages. Genes are colored according to their log2 fold change value (Blue <=−0.5, red >=+0.5). c-f) FACS analysis of primary macrophages exposed to the conditioned media from PC3 tumor cells or to palmitic acid (100 nM) in presence or absence of partial genetic deletion of OR51E2. Bar graphs showing the % of (c) HLA-DR+ (Ctrl n = 4, CM n = 6, PA n = 6, siRNA ctrl n = 4, siRNA CM n = 5, siRNA PA n = 4), (d) CD204+ (Ctrl n = 4, CM n = 4, PA n = 6, siRNA ctrl n = 4, siRNA CM n = 5, siRNA PA n = 4), (e) CD206+ (Ctrl n = 4, CM n = 6, PA n = 6, siRNA ctrl n = 4, siRNA CM n = 4, siRNA PA n = 4) and (f) Arginase1+ (Ctrl n = 5, CM n = 5, PA n = 4, siRNA ctrl n = 4, siRNA CM n = 4, siRNA PA n = 4) gated on CD68+ macrophages. g) Absolute count of different cell subsets in non-tumor (n = 7) and tumor (n = 9) regions. h) H&E and spatial analysis of the distribution of palmitic acid by mass spectrometry imaging in patient number 3. i) Spatial distribution of Inflamm-TAMs, IFN TAMs, LA-TAMs, Angio-TAMs and Reg-TAMs signature in patient number #3. Statistical analyses were performed using two-tailed unpaired Student’s t test. Values are presented as mean ± SEM.

References

    1. Mantovani, A., Allavena, P., Marchesi, F. & Garlanda, C. Macrophages as tools and targets in cancer therapy. Nat. Rev. Drug Discov.21, 799–820 (2022). - PMC - PubMed
    1. Orecchioni, M. et al. Olfactory receptor 2 in vascular macrophages drives atherosclerosis by NLRP3-dependent IL-1 production. Science375, 214–221 (2022). - PMC - PubMed
    1. Spehr, M. et al. Identification of a testicular odorant receptor mediating human sperm chemotaxis. Science299, 2054–2058 (2003). - PubMed
    1. Flegel, C., Manteniotis, S., Osthold, S., Hatt, H. & Gisselmann, G. Expression profile of ectopic olfactory receptors determined by deep sequencing. PLoS ONE8, e55368 (2013). - PMC - PubMed
    1. Kotlo, K. et al. The olfactory G protein-coupled receptor (Olfr-78/OR51E2) modulates the intestinal response to colitis. Am. J. Physiol. Cell Physiol.318, C502–C513 (2020). - PMC - PubMed

MeSH terms