. 2025 Jul;10(7):1605-1616.
doi: 10.1038/s41564-025-02025-4. Epub 2025 Jun 30.

The GATE glycoprotein complex enhances human cytomegalovirus entry in endothelial cells

Affiliations

The GATE glycoprotein complex enhances human cytomegalovirus entry in endothelial cells

Michael J Norris et al. Nat Microbiol. 2025 Jul.

Abstract

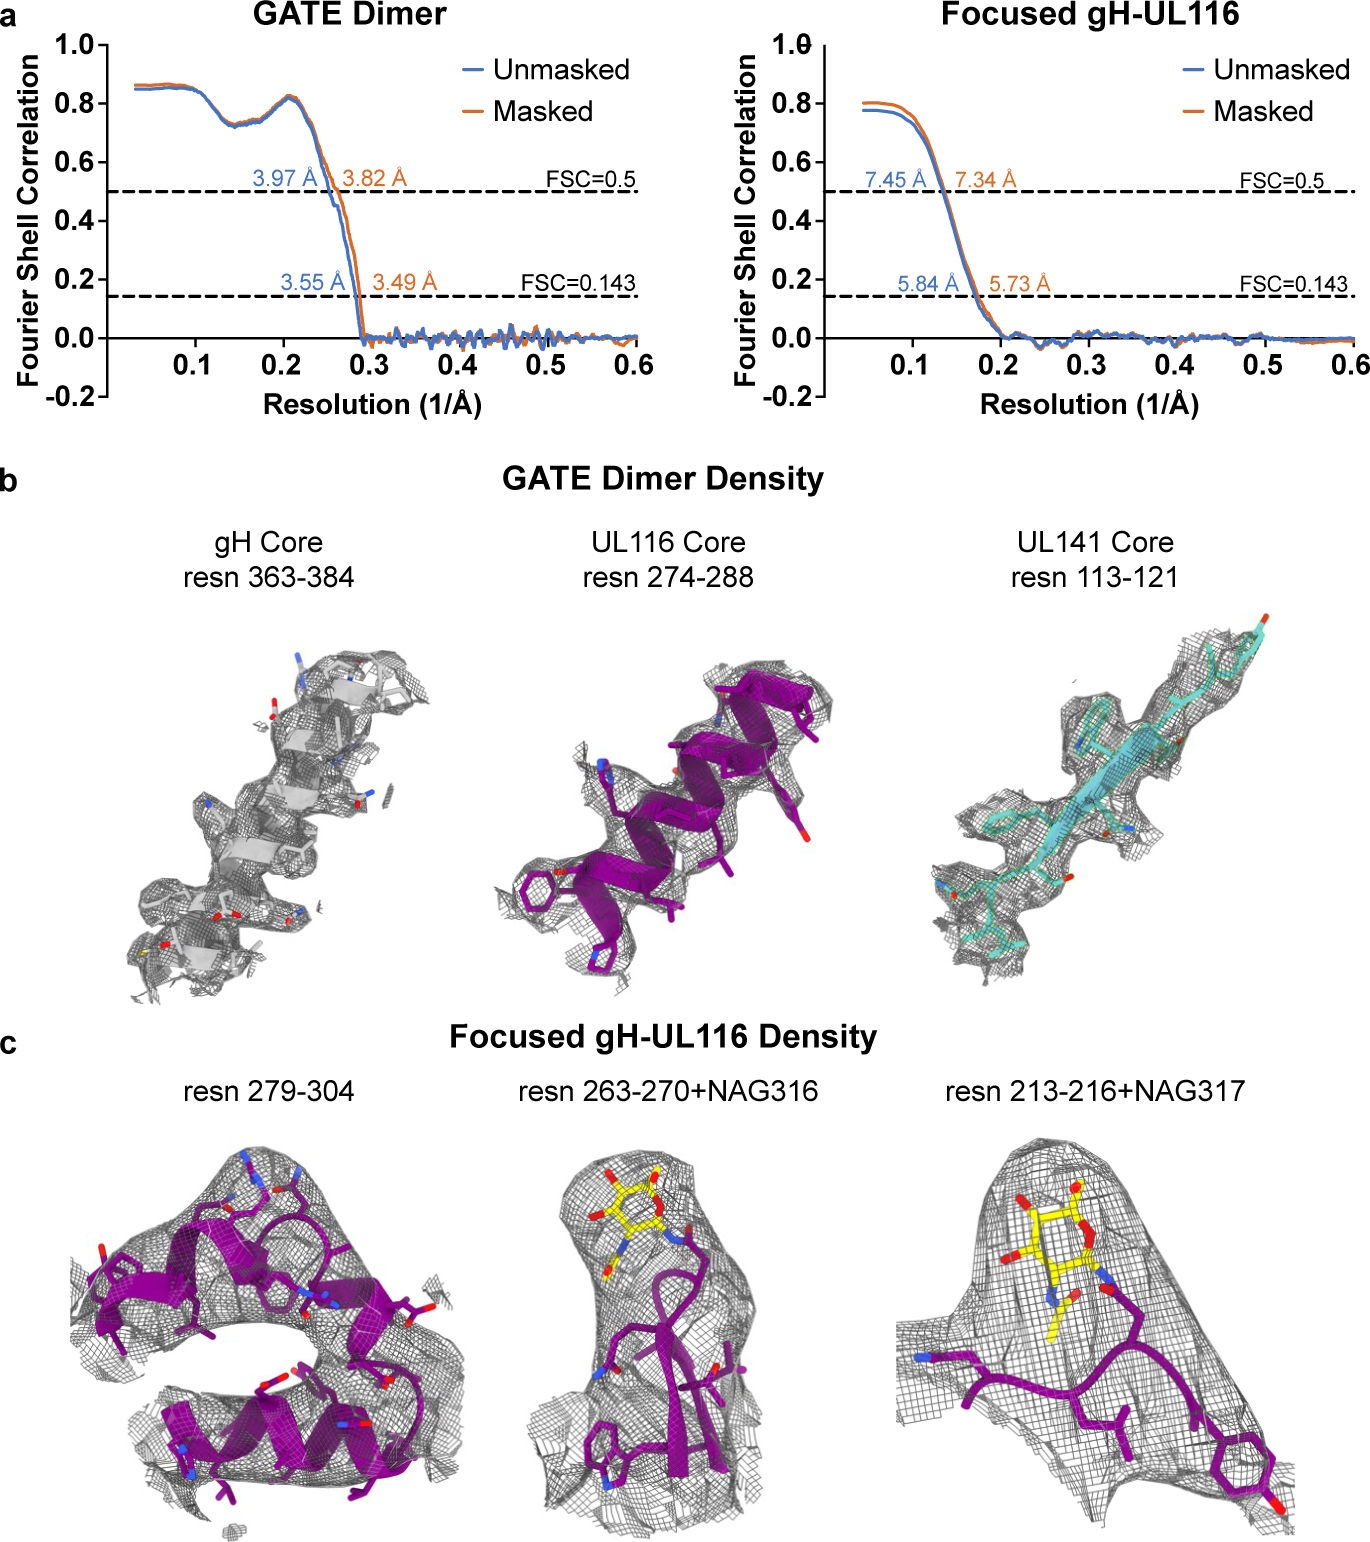
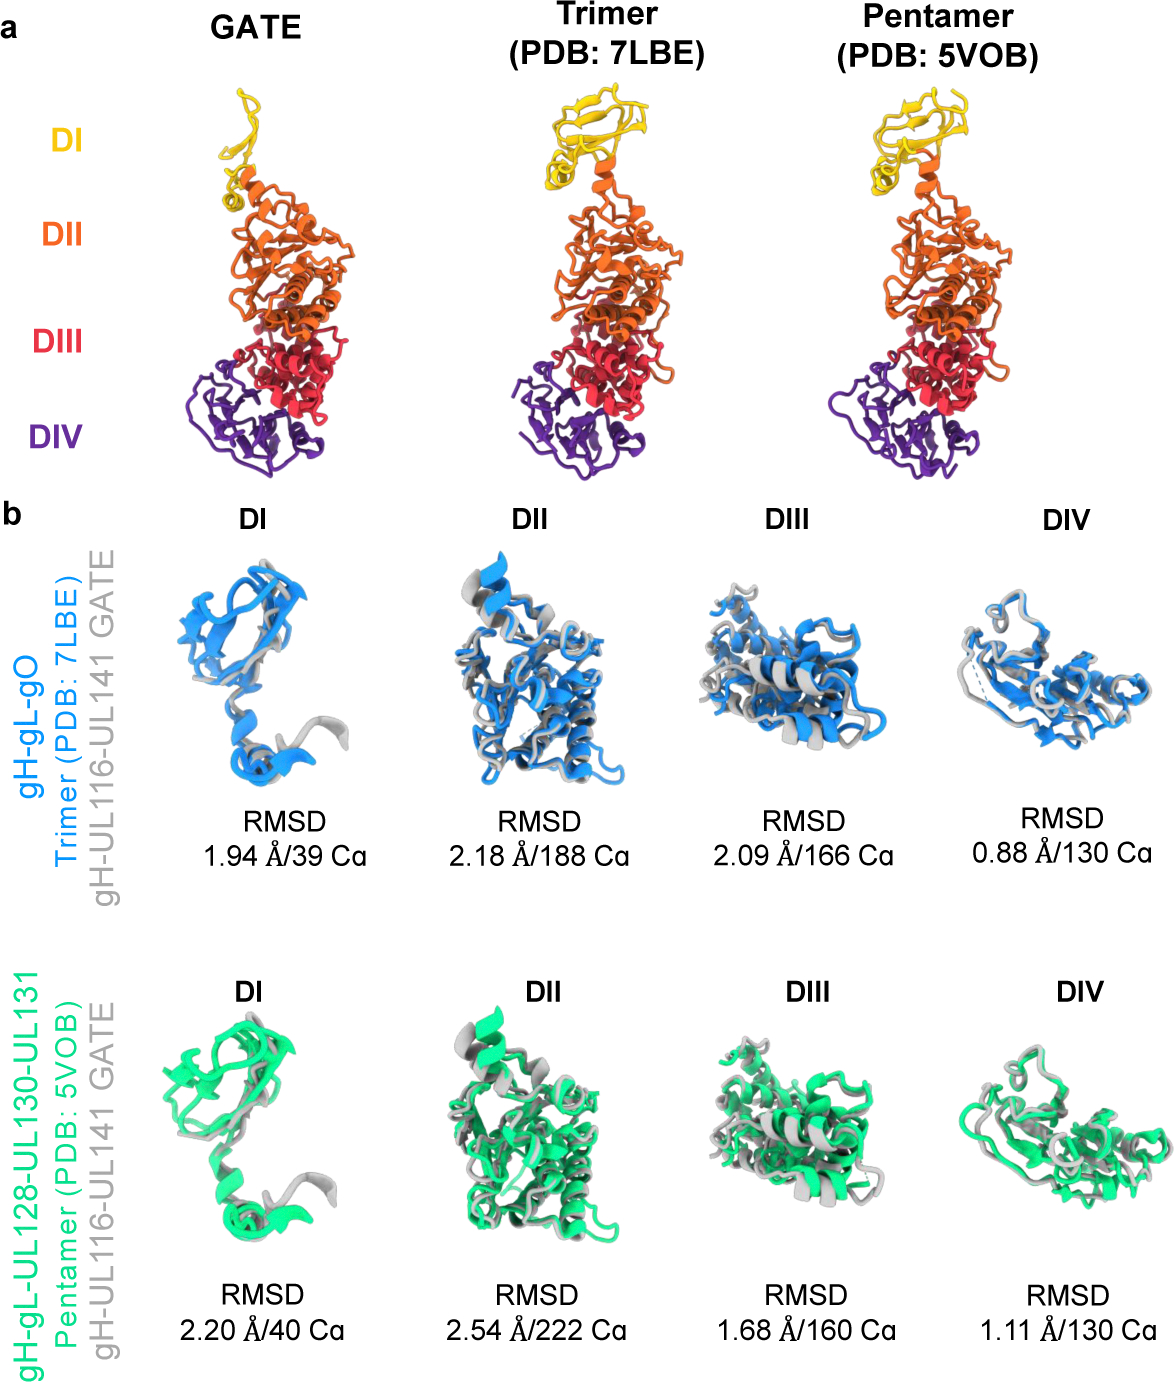
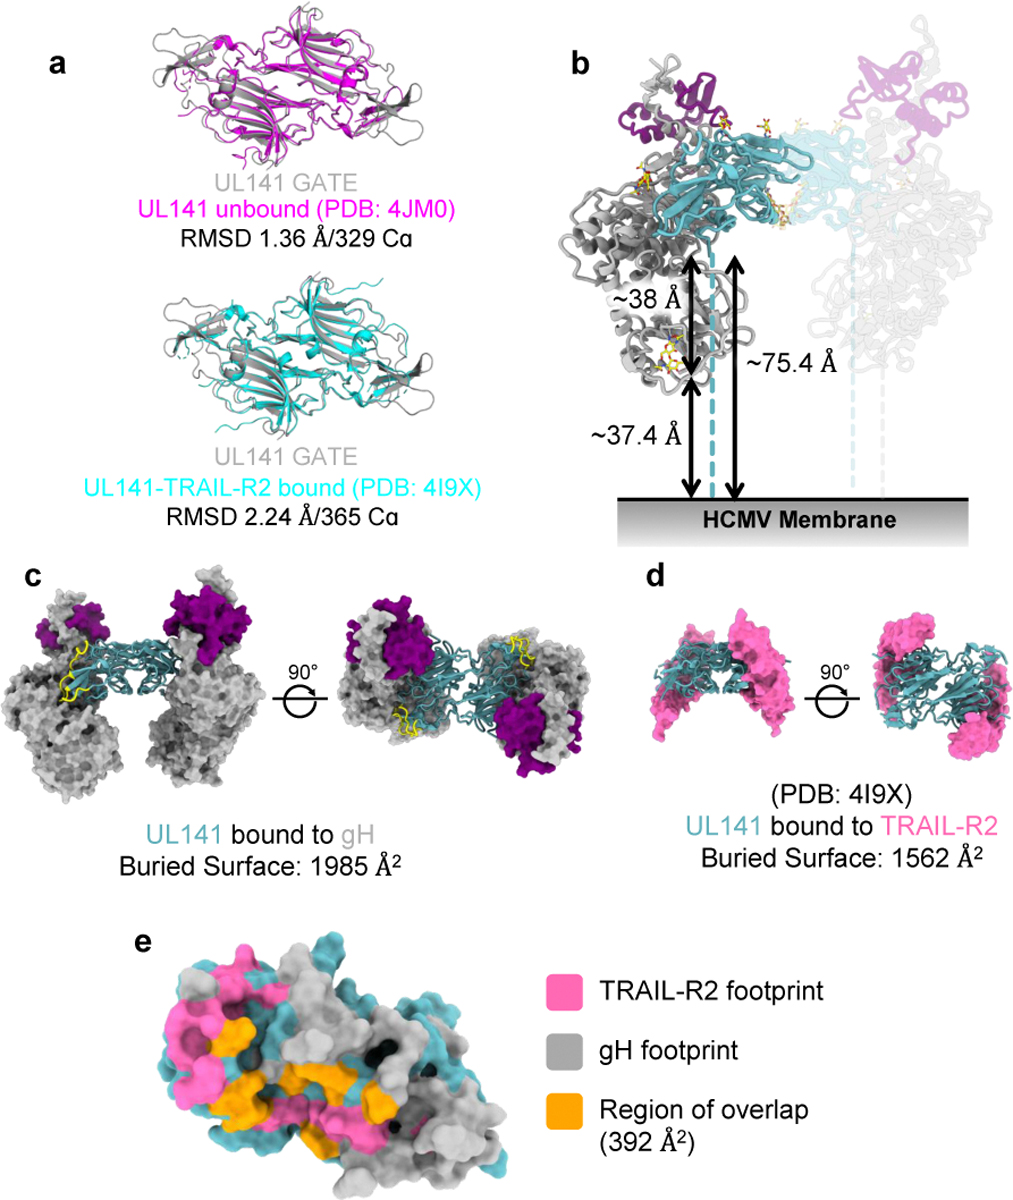
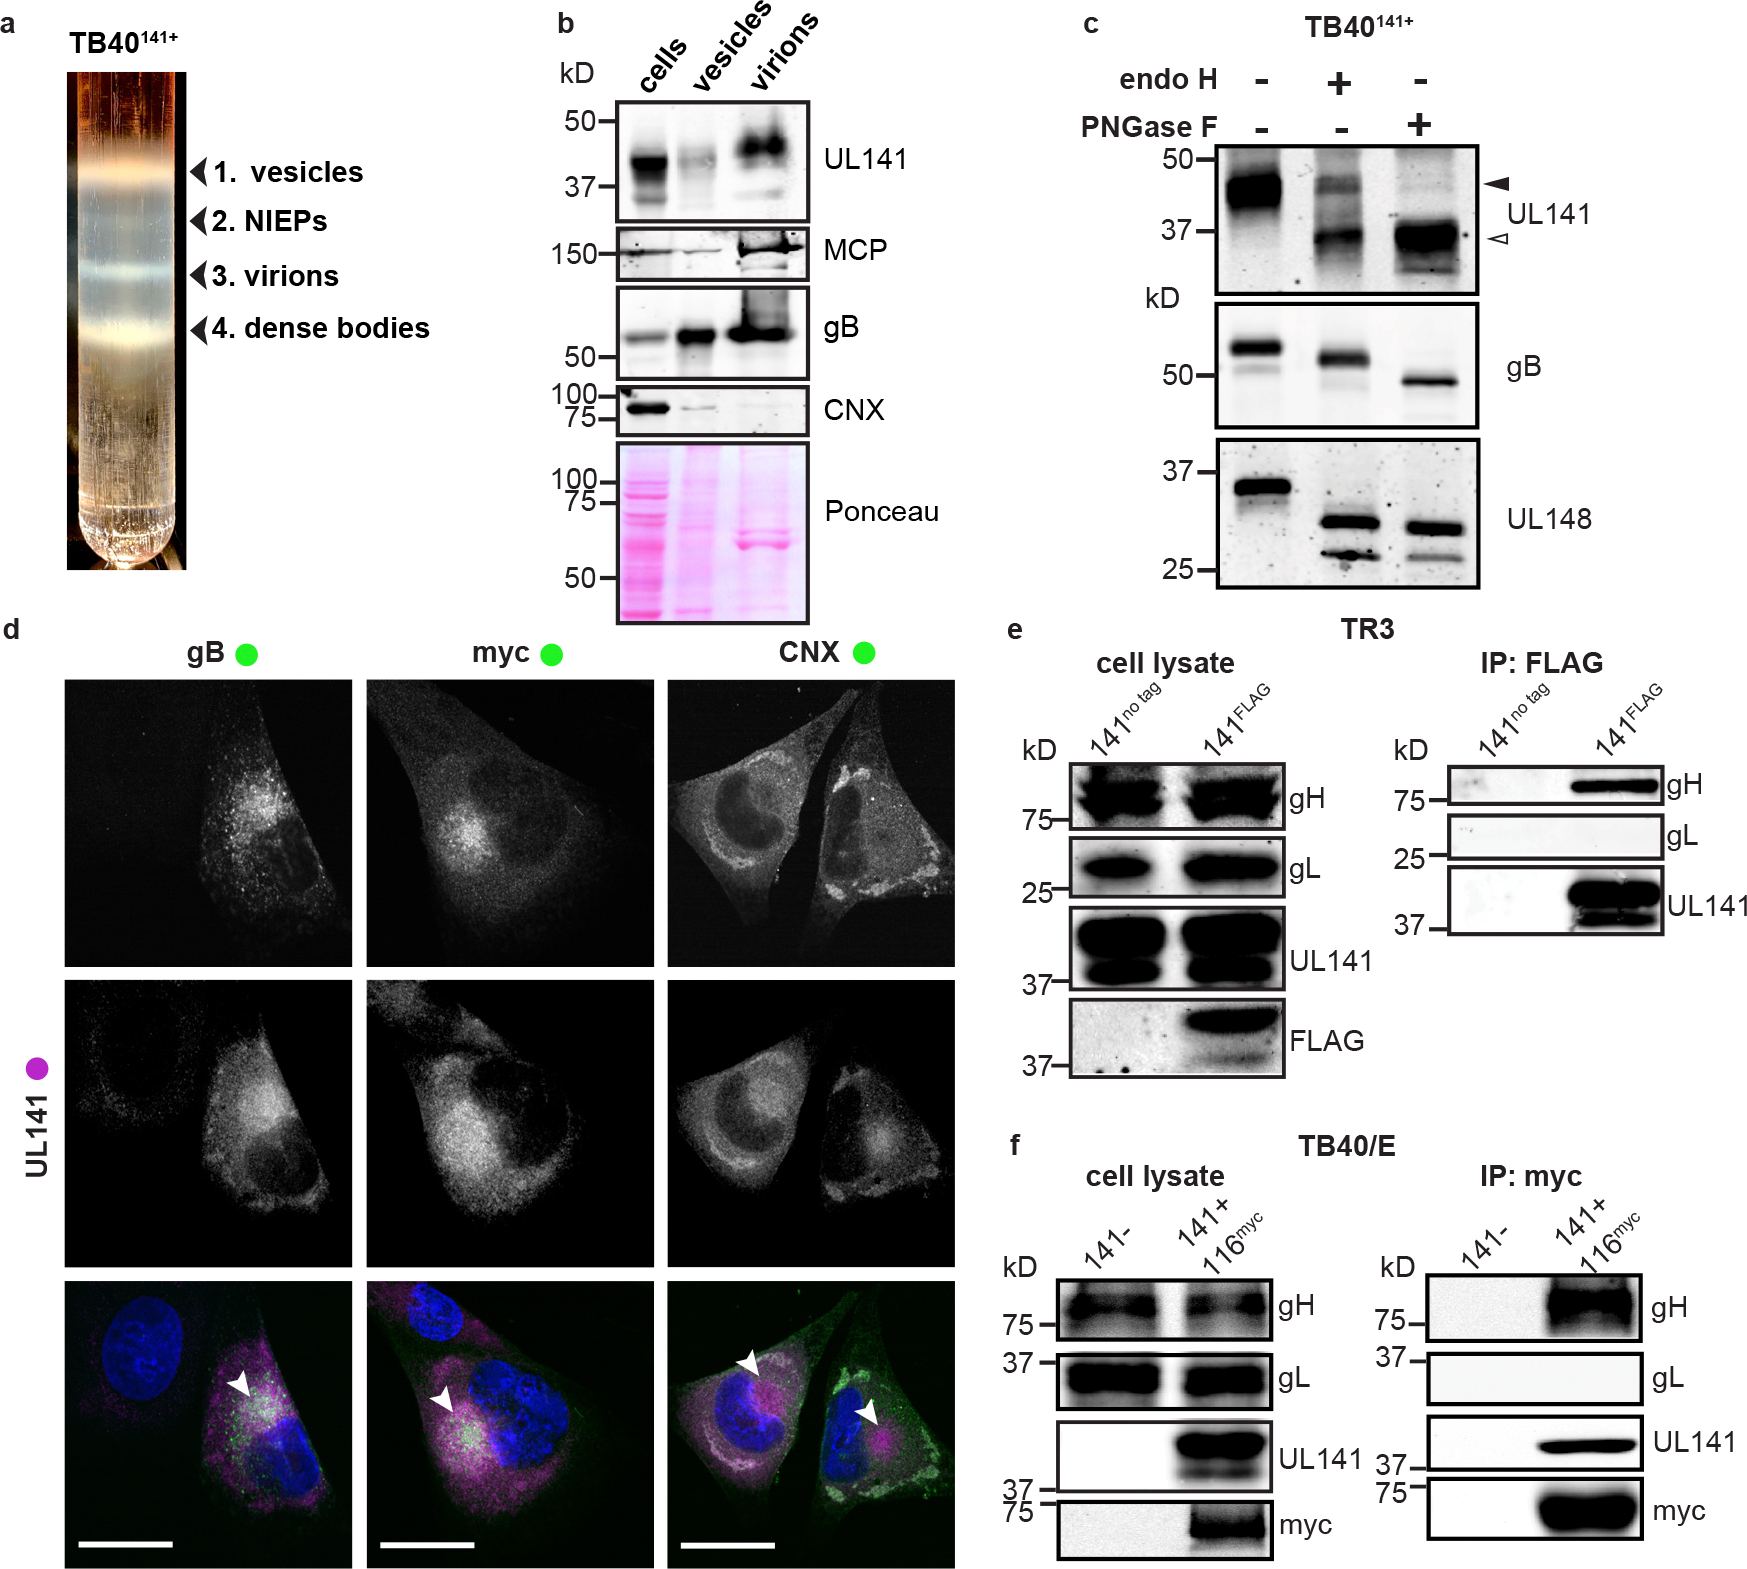
Human cytomegalovirus can cause severe birth defects upon infection in pregnant women and complications in immunocompromised patients. A major challenge for vaccine design is our incomplete understanding of the diverse protein complexes this virus uses to infect cells. In Herpesviridae, glycoproteins H and L (gH and gL) form complexes with other viral proteins that bind receptors to mediate cell-type-specific entry. Here we identify a distinct gH complex that is abundant on human cytomegalovirus virions and enhances infection of endothelial cells. In this complex, gH associates with UL116 and UL141 (an immunoevasin previously known to function intracellularly) but not with gL. We term this the gH-associated tropism and entry (GATE) complex and provide the cryo-electron microscopy structure at ~3.5 Å. The structure shows gH-only scaffolding, UL141-mediated dimerization and a heavily glycosylated UL116 cap. These findings identify a third virion surface complex that promotes cell entry and may represent a new target for vaccines or antiviral therapies.


Conflict of interest statement

Competing interests: M.J.N., M.N.A.S., E.O.S., C.A.B. and J.P.K. are listed as coinventors on US, European and international patent applications related to the identification of GATE-3, US20230293673A1, EP4192494A4 and WO2022032177A1. The other authors declare no competing interests.

Figures

Extended Data Figure 1.
UL141 localizes at the cVAC and is incorporated into HCMV virions. a, Infected cell lysates and purified virions from HCMV strains TB40/E (141-) and TR3 (141+) were compared for the indicated viral glycoproteins. These are representative blots of two independent experiments. b, Immunofluorescent staining of fibroblasts infected with TB40/E viruses that are UL141-null (TB40141-) or express FLAG-tagged UL141 (TB40141F) at 3 dpi (MOI 1 TCID50). Cells were stained with rabbit-derived anti-UL141 (magenta) and mouse-derived anti-gB (green), to identify the cytoplasmic viral assembly compartment (cVAC) (white arrowheads). HCMV encodes Fc-gamma receptors that localize at the cVAC and bind to human and rabbit antibodies, but not mouse antibodies. For all confocal microscopy, recombinant human IgG Fc is used to block viral Fc receptors during the assessment of UL141 localization to the cVAC. In addition to using human Fc, we also use (c) mouse anti-FLAG antibody to detect UL141 (green) and rabbit-derived calnexin (CNX) antibody to identify the endoplasmic reticulum (magenta) in TB40141F infected fibroblasts. Scale bars denote 25 μm. These are representative micrographs of three independent experiments yielding comparable outcomes.
Extended Data Figure 2.
Purification and oligomeric state of the HCMV gH/UL116/UL141 GATE. a, Schematic representation of the expression and purification process for the HCMV gH/UL116/UL141 GATE complex. b, Size exclusion chromatography profile of the gH/UL116/UL141 GATE complex. Fractions were analyzed by SDS-PAGE under non-reducing conditions, with the fraction indicated by blue asterisks used for cryo-EM studies. c, Western blot analysis of fraction 8, probed with anti-His, anti-gH, and anti-strep antibodies to detect UL141, gH, and UL116, respectively. d, Fractions from size exclusion chromatography were analyzed to determine the oligomeric distribution of the gH/UL116/UL141 GATE complex. Molecular weight markers (in kDa) are indicated on the left. Two predominant species, ~720 kDa and ~480 kDa, were observed, suggesting different oligomeric states. Fractions containing these species are marked with asterisks. e, Representative 2D class averages from negative stain electron microscopy of the size exclusion chromatography fractions. Particles from the ~720 kDa and ~480 kDa fractions exhibit distinct structural features, resembling either a “plus sign” or an “H” shape, suggesting that the gH/UL116/UL141 GATE complex can exist both as a heterotrimer and as a dimer of heterotrimers (hexamer). These data are representative of five independent experiments.
Extended Data Figure 3.
Cryo-electron microscopy processing of the HCMV gH/UL116/UL141 GATE complex. a, Overview of the representative cryo-EM data processing workflow for the gH/UL116/UL141 GATE complex. b, (Left) Front and back views of the cryo-EM map of the locally refined and symmetry-expanded gH/UL116 region. (Right) Corresponding front and back views of the atomic model, shown as a ribbon diagram, highlighting the gH–UL116 interaction. gH is depicted in grey, UL116 in purple, and UL141 in teal. Resolved N-linked glycans, identified from focused refinements, are highlighted in yellow.
Extended Data Figure 4.
Cryo-EM structure validation. a, Gold-standard Fourier shell correlation (FSC) curves for the refinements of the HCMV gH/UL116/UL141 dimer (left) and the symmetry-expanded focused local refinement of the gH-UL116 interface (right). b, Conical FSC (cFSC) analysis of the half maps. The blue cFSC summary plot displays the mean, minimum, maximum, and standard deviation of correlations at each spatial frequency. The green histogram shows the distribution of 0.143 threshold crossings, corresponding to the spread of resolution values across different directions. c, Euler angle distribution plot of the particles used in the final 3D reconstructions, demonstrating complete coverage of projections as generated in CryoSPARC. d, Final reconstructions filtered and colored by local resolution, as estimated in CryoSPARC.
Extended Data Figure 5.
Cryo-EM structure validation and model quality assessment. a, Map versus model FSC curves calculated with and without masking, using the Phenix package. Curves are shown for the HCMV gH/UL116/UL141 GATE dimer (left) and the symmetry-expanded focused local refinement of the gH-UL116 interface (right). b, Cryo-EM maps for fragments of gH (left), UL116 (middle), and UL141 (right) from the gH/UL116/UL141 dimer, demonstrating the quality of the map. The cryo-EM map is displayed as a mesh. c, Cryo-EM maps for a fragment of gH and UL116 from the symmetry-expanded focused refinement of the gH-UL116 interface, illustrating the quality of the cryo-EM map. The map is shown as a mesh.
Extended Data Figure 6.
Electrostatic surface potential and glycosylation of the HCMV gH/UL116/UL141 GATE. a, Electrostatic surface potential of the HCMV GATE complex displayed on a space-filling model, with positively charged regions in blue and negatively charged regions in red. The negatively charged cleft is outlined. Electrostatic potential maps were generated using the PDB2PQR and APBS software. b, Side and top views of the glycosylation site distribution on the HCMV gH/UL116/UL141 GATE complex. c, Inset showing the glycosylation site distribution at the gH-UL116 interaction site, as resolved in the symmetry-expanded focused refinement of the gH-UL116 interface.
Extended Data Figure 7.
Structural comparison of gH from the HCMV GATE, trimer, and pentamer. a, Structural representation and domain organization of gH in the HCMV GATE (left), trimer (middle), and pentamer (right). The gH domains I–IV are colored yellow, orange, red, and purple, respectively. In the GATE, the gH DI domain undergoes a significant rotational shift relative to the trimer and pentamer, transforming the gH subunit from a straight rod in the trimer and pentamer to a crescent shape in the GATE structure. b, Structural alignment of individual gH domains comparing the GATE with the trimer (top) and the pentamer (bottom). The structures were aligned using the indicated number of Cα atoms from the respective PDB files, and the alignment was quantified by the indicated r.m.s.d. values.
Extended Data Figure 8.
gH and TRAIL-R2 share a similar binding site on UL141. a, Structural comparison of UL141 in the GATE complex with unbound UL141 (left) and UL141 bound to TRAIL-R2 (right). Structures were aligned as dimers using all Cα atoms in the respective PDB files. The alignment is quantified by the indicated root-mean-square deviation (r.m.s.d.) values. b, The extracellular domain of UL141 (teal) is shown within the gH/UL116/UL141 GATE complex, with gH in grey and UL116 in purple. Glycans are depicted as yellow sticks. Distance measurements indicate the contribution of the gH stalk (37.4 Å), the distance from the top of the stalk to UL141 (38 Å), and the estimated total distance of UL141 from the viral membrane (~75.4 Å). Given that the final 25 C-terminal residues of UL141 are unresolved, they could extend ~85 Å if fully disordered. This suggests that UL141 is membrane-anchored, possibly positioned even closer due to the twisted conformation of the complex. c and d, Structural models of (c) UL141 in the GATE complex and (d) UL141 bound to TRAIL-R2 illustrate that gH and TRAIL-R2 occupy overlapping binding sites on UL141. The buried surface area for each interaction is indicated. UL141 is shown as a cartoon representation, while gH, UL116, and TRAIL-R2 are depicted as surface models. In the GATE, several regions of UL141 that were disordered in the unbound and TRAIL-R2-bound structures become well-ordered (highlighted in yellow). e, Surface representation of a UL141 monomer, with the TRAIL-R2 binding footprint highlighted in pink, the gH binding footprint in grey, and their overlapping region in orange. The buried surface area of the overlap is quantified, representing ~25% of the TRAIL-R2 binding site.
Extended Data Figure 9.
UL141 promotes endothelial cell tropism independently of the pentamer complex. a, Representative images of UL141-dependent spread in endothelial cells. Fibroblasts and endothelial cells were infected with 50 or 100 genome equivalents/cell, respectively, of 141− or 141+ TB40/E viruses produced by fibroblasts. Cells were stained for IE1 (green) and Hoechst (blue) at the indicated days post-infection to monitor viral spread. Scale bars denote 800 μm. b, Low MOI (0.01 TCID50) viral growth kinetics in HUVEC infected with 141− or 141+ viruses up to 14 dpi (n=3). Data were logarithmically transformed to fit a Gaussian distribution prior to calculating statistical significance via 2-way ANOVA (two-tailed). ***P=.0009 for 12 dpi data points. c, Non-reducing SDS-PAGE of HUVEC cell lysates and HUVEC-derived virions. Cells were infected with 141− and 141+ viruses to measure virion incorporation of known HCMV entry complexes, trimer (gH/gL/gO) and pentamer (gH/gL/128). Lysates were immunoblotted for gL to identify covalently-linked entry complexes, major capsid protein (MCP) to measure virion abundance, and UL148 to assess the purity of the virion preparations. d, Quantification of band intensities for gH/gL/gO and gH/gL/128 abundance in HUVEC-derived virions from two independent experiments. Band intensities of 141− and 141+ virions were normalized to MCP. Error bars represent ± SEM.
Extended Data Figure 10.
UL141 enhances the infectivity of the pentamer-null AD169 strain in epithelial cells. a, Epithelial cells (ARPE-19) were incubated with 50 genome equivalents/cell of UL141-null (141-) or UL141-repaired (141+) TB40/E that either express UL116 or are UL116-deficient (Δ116). Cells were stained for IE1 to measure the percentage of infected cells. Significance was determined by a two-tailed ratio paired t-test, as all conditions for each biological replicate were assessed in parallel (141− and 141+, n=5; Δ116141− and Δ116141+, n=3). Error bars represent ± SEM. **P=.0086. Scale bars represent 400 μm. b, Schematic of the pentamer-null AD169 viruses used in c-f. c, ARPE-19 were infected with AD169 or UL141-restored AD169 (AD169141) at MOI 0.1 TCID50. Cells were stained for IE1 at 5 and 10 days post-infection (dpi) to measure the size of foci, or plaques, as IE1+ nuclei/plaque. Each point in the bar graph represents a biological replicate (5dpi, n=6; 10 dpi, n=7) *P=.0406. Error bars represent ± SEM. d, Mean plaque sizes for each 10 dpi biological replicate shown in (c). Error bars represent ± SEM. Enumerated plaques are reported in Supplementary Table 2. e, QQ plots displaying the lognormality of raw plaque size data. After log10 transformation, data fit a Gaussian distribution and were used to calculate statistical significance via two-tailed analyses: (c) Welch’s t-test or (d) 2-way ANOVA. f, Representative image of AD169 versus AD169141+ plaques in ARPE-19 cells at 10 dpi. Cells were stained for IE1 (green). Scale bars represent 100 μm.
Figure 1.
Figure 1.. UL141 is incorporated into virions and assembles into the gH/UL116 complex.
a, TB40141+ viruses purified via a glycerol-sodium tartrate gradient to separate infectious virions (band 3) from cell debris (bands 1 and 4) and non-infectious enveloped particles (NIEPs, band 2). b, Western blot analysis of fibroblasts’ whole cell lysates at 6 days post-infection (dpi), vesicles (a, band 1), and virions (a, band 3). Major capsid protein (MCP) identifies the fraction that is enriched for infectious virions. This is a representative blot of two independent experiments. c, Lysates of fibroblasts infected with TB40/E restored for UL14 (TB40141+) were treated with endoglycosidase H (endoH) or protein N-glycosidase F (PNGase F) and analyzed by Western blot. This blot is representative of four independent experiments. d, Fibroblasts were infected with TB40141+ at MOI 1 TCID50 for 3 days prior to staining for UL141 (magenta) and gB, UL116-myc, or calnexin (CNX) (all green). gB and myc-tagged UL116 denote the cytoplasmic viral assembly compartment (cVAC) (white arrowheads), and CNX identifies the ER. Scale bars are 25 μm. These micrographs are representative of three independent experiments. e, The CMV BAC-derived strain TR3 was modified to introduce a FLAG tag at the C-terminus of UL141 (TR3–141F). Infected fibroblasts were lysed 3 dpi, and IP was performed with anti-FLAG. This blot is representative of two independent experiments. f, Fibroblasts were infected with parental, UL141-null TB40/E (141-) or TB40/E repaired for UL141 expression and engineered to express a myc-tagged UL116 (141+,116myc). Anti-myc IP was carried out at 3 dpi and IP eluates were resolved by SDS-PAGE and analyzed by immunoblot with the indicated antibodies. This blot is representative of two independent experiments.
Figure 2:
Figure 2:. Cryo-EM structure of HCMV gH/UL116/UL141 GATE complex.
a, Schematic representation of the domain organization of the expressed HCMV gH, UL116, and UL141 constructs. b, (Left) Cryo-EM map of the HCMV gH/UL116/UL141 “GATE” complex ectodomain, with gH in grey, UL116 in purple, and UL141 in teal. Dashed lines indicate the hypothetical locations of the protein stalks. Resolved N-linked glycans are highlighted in yellow. (Right) Corresponding ribbon diagram of the GATE ectodomain.
Figure 3.
Figure 3.. UL116 mimics gL binding to gH.
a, Structural comparison of UL116 in the gH/UL116/UL141 GATE complex (left), gL in the trimer (middle), and gL in the pentamer (right), all bound to gH. UL116 and gL are shown as ribbon diagrams, with gH depicted as a surface model. Buried surface areas for each interaction pair are indicated. Inset 1 highlights the mixed beta-sheet interaction; Inset 2 shows the alpha-helix interaction between UL116 or gL and gH. Insets are ribbon diagrams, with gH domains I and II colored yellow and orange, respectively. b, Structural superposition of UL116 (GATE) with gL from the trimer (left) and pentamer (right), aligned by the indicated Cα residues and quantified by r.m.s.d. values. gH is outlined and colored white. c, Comparison of the UL116 binding footprint on gH with gL footprints from the trimer (blue) and pentamer (green). The UL116 footprint is highlighted in purple, with the overlapping region in orange. Buried surface area of the overlap is indicated.
Figure 4.
Figure 4.. UL116 is required for UL141-dependent entry and virion incorporation of the GATE.
a, Schematic of methods used to measure the absolute infectivity of TB40/E virions derived from fibroblasts (Created in BioRender. Henderson, L. (2025) https://BioRender.com/htb1ev4). Viruses were titrated in parallel by qPCR to determine viral genomes/mL and by TCID50 assays on both fibroblasts and HUVEC, immunostaining for IE1 to score infected wells at 3 days post-infection (dpi). b, Absolute infectivity shown as TCID50/103 genomes for fibroblasts (n=4) and endothelial cells (n=4). Each point represents the mean value ± SEM within each biological replicate. Ratio paired t-tests (two-tailed) were used to measure statistical significance as connected points were assayed in parallel. ns, not significant; *P=.0266 c, Representative images of fibroblasts and endothelial cells following infection with UL116-null (Δ116) TB40/E that encodes UL141 or not (Δ116141−or Δ116141+). Fibroblasts (n=5) and endothelial cells (n=3) were infected with 50 genome equivalents/cell or 100 genome equivalents/cell, respectively. Cells were stained for IE1 and counterstained with Hoechst at 1 dpi to measure the percentage of infected cells. Fibroblasts, P=.405; endothelial cells, P=.8583. Error bars represent ± SEM. Scale bars represent 400 μm. d, Western blot analysis of whole cell and crude virion lysates from 141+ or Δ116141+ infected fibroblasts. This is a representative blot of three independent experiments. e-l, Fibroblasts were infected with 141+ and Δ116141+ viruses for 3 days to allow cVAC formation. e and i, Representative micrographs of cells stained for (e) UL141 and gB or (i) UL141 and gH. The yellow-dashed arrows are the regions of interest used to measure the intensity profiles of target proteins in each condition. f and g, Graphs depicting the intensity profiles of UL141 and gB or UL141 and gH, respectively, throughout the cVAC (gray highlighted regions in graphs). g and k, Pearson’s correlations (r) were calculated for (g) UL141 and gB or (k) UL141 and gH in the cVAC only. Two-tailed p-values for Pearson’s correlations are shown in each graph. h and l, Correlation coefficients of (h) gB:UL141 (n=3) and (l) gH:UL141 (n=3). Welch’s t-tests (two-tailed) were used to measure statistical significance. *P=0.0243. Error bars represent ± SEM.
Figure 5.
Figure 5.. GATE improves viral infectivity for endothelial cells.
a, Representative images of fibroblasts or endothelial cells infected with fibroblast-derived or endothelial cell-derived 141− or 141+ TB40/E viruses. Scale bars represent 400 μm. b and c, Percent infection of (b) fibroblast-derived and (c) endothelial cell-derived viruses at day 1 post-infection to measure entry efficiency with fold differences shown as #x for each biological replicate. Fibroblasts and endothelial cells were infected for 24 hours in parallel with 50 or 100 genome equivalents/cell, respectively, stained for IE1 and counterstained with Hoechst 33342 to calculate the percentage of infected cells. Statistical significance was determined by a two-tailed ratio paired t-test, with each connected, similarly colored point representing a biological replicate (b, fibroblasts and endothelial cells, n=7; c, fibroblasts n=3, endothelial cells, n=4). Error bars represent ± SEM for each biological replicate. Shaded bars are the mean % infection for all biological replicates. Ns, not significant; (b) **P=.0027; (c) **P=.0097. d and e, Graphical summary depicting the producer cell-type dependent infectivity of 141− versus 141+ virions in endothelial cells. d, In comparison to fibroblast-derived parental TB40/E (TB40141−), TB40141+ virions infect endothelial cells more efficiently. e, Relative to endothelial cell-derived parental TB40141−, which poorly infects endothelial cells (dashed arrow), UL141 greatly improves the infectivity of viruses produced by endothelial cells (3 solid arrows).

Update of

References

    1. Zuhair M et al. Estimation of the worldwide seroprevalence of cytomegalovirus: A systematic review and meta-analysis. Rev. Med. Virol. 29, e2034 (2019). - PubMed
    1. Lantos PM et al. Neighborhood Disadvantage is Associated with High Cytomegalovirus Seroprevalence in Pregnancy. J Racial Ethn Health Disparities 5, 782–786 (2018). - PMC - PubMed
    1. Plotkin SA & Boppana SB Vaccination against the human cytomegalovirus. Vaccine 37, 7437–7442 (2019). - PMC - PubMed
    1. Chandramouli S et al. Structural basis for potent antibody-mediated neutralization of human cytomegalovirus. Sci Immunol 2, (2017). - PubMed
    1. Ciferri C et al. Structural and biochemical studies of HCMV gH/gL/gO and Pentamer reveal mutually exclusive cell entry complexes. Proc. Natl. Acad. Sci. U. S. A. 112, 1767–1772 (2015). - PMC - PubMed

MeSH terms

LinkOut - more resources