. 2025 Jun 30;22(1):171.
doi: 10.1186/s12974-025-03481-9.

EphB2-mediated ephrin-B reverse signaling on microglia drives an anti-viral, but inflammatory and neurotoxic response associated with HIV

Affiliations

EphB2-mediated ephrin-B reverse signaling on microglia drives an anti-viral, but inflammatory and neurotoxic response associated with HIV

Jeffrey Koury et al. J Neuroinflammation. .

Abstract

Background: Pathological inflammation with a loss of synaptic integrity and function has been implicated in HIV Associated Neurocognitive Disorders (HAND). Although therapeutics exist to increase the lifespan of people living with HIV (PLWH), they are not effective at preventing neuroinflammation and HIV induced neuronal damage persists. In this study, we investigate the ephrin-B/EphB axis, which regulates inflammation, in post-mortem brain specimen of PLWH and experimental models in order to assess its potential role in HIV induced neuroinflammation.

Methods: We analyze mRNA samples of post-mortem brain specimen of PLWH and uninfected controls obtained from the National NeuroAIDS Tissue Consortium (NNTC) and, for comparison, of a transgenic mouse model of neuroHIV using quantitative reverse transcription polymerase chain reaction (qRT-PCR). Follow-up experiments employ mouse brain tissue and in vitro models, including immortalized human microglia, human induced pluripotent stem cell (iPSC)-derived mixed neuroglial cell cultures, cellular and molecular interference, functional and multiplex assays, immunofluorescence and mRNA sequencing to examine the role of the ephrin-B/EphB axis in neuroinflammation and the associated neurotoxicity.

Results: Using qRT-PCR we find increased expression of EphB2 in post-mortem brain of PLWH, and detect a correlation with pro-viral DNA, viral RNA and an inverse correlation with abstract executive function and verbal fluency. Increased expression of ephrin-B/EphB at mRNA and protein level is also observed in brains of a transgenic mouse model of neuroHIV suggesting the upregulation can be driven, at least in part, by expression of viral gp120 envelope protein and a type I interferon, IFNβ. Additionally, we find induction of ephrin-B1 expression in microglia following activation by IFNβ. Given the previously reported impact of EphB2 on inflammation in the periphery, the functional role of EphB2-mediated ephrin-B reverse signaling on microglia is assessed for a pro-inflammatory and anti-viral signature. We find that EphB2 treated microglia secrete inflammatory and anti-viral factors but also exert contact-independent neurotoxicity. Finally, knockdown of microglial ephrin-B1, an EphB2 binding partner, shows a partial alleviation of the microglial pro-inflammatory signature and neurotoxicity.

Conclusion: Our study suggests that elevated EphB2, and its reverse signaling through ephrin-B1 in microglia contribute to neuroinflammation and neurotoxicity in neuroHIV.

Keywords: EphB; Ephrin-B; HIV-1; Interferon-β; Microglia; Neuroinflammation; Neurotoxicity.


Conflict of interest statement

Declarations. Ethics approval and consent to participate: The NNTC studies were conducted in accordance with human subject protection protocols with written consent obtained at the collection sites. Participants were enrolled at any of 4 NNTC clinical sites located in Galveston TX, Los Angeles CA, New York City NY, and San Diego CA. Enrollment and collection of specimens was performed under the oversight of each medical center’s local Institutional Review Board. All participants consented to the use of their data for the purposes of HIV and neuroAIDS/neuroHIV research with all informed consent procedures including tests of comprehension to ensure cognitively impaired participants were able to consent. Criteria for enrollment of individuals in the study includes willingness to be an organ donor upon demise. The following offices maintained the IRBs that performed oversight for the protection of human subjects: University of Texas Medical Branch Office of Research Subject Protections, Galveston, TX; University of California, San Diego, Human Research Protections Program, San Diego, CA; University of California, Los Angeles, Office of Human Research Protection Program, Los Angeles, CA; Mount Sinai Medical Center, Program for Protection of Human Subjects, New York, NY. All procedures involving animals were performed in accordance with the National Institute of Health Guide for the Care and Use of Laboratory Animals and approved by the Institutional Animal Care and Use Committees of the Sanford-Burnham-Prebys Medical Discovery Institute, The Scripps Research Institute and the University of California, Riverside. Consent for publication: N/A. Competing interests: The authors declare no competing interests.

Figures

Fig. 1
Fig. 1
EphB2 is differentially expressed in human neocortex of PLWH with brain pathology. A Relative gene expression levels of EphB2 using mRNA from the middle frontal gyrus (neocortex) of the following groups of individuals: Not-infected (n = 46) and HIV + (n = 63), including HIV+ no brain pathology (n = 44) and HIV+ brain pathology (n = 19). The relative gene expression levels of EPHB2 in HIV+ (n = 63) patient’s cortex was used to calculate Pearson correlations for (B) log HIV DNA/RNA load (+ 200 represents the threshold of HIV DNA/RNA detection in the assay) and (C) two domains of neurocognitive performance. Values in graph are mean ± SEM; n.s., non-significant, * P ≤ 0.05, ** P ≤ 0.01, *** P ≤ 0.001, **** P ≤ 0.0001, One-Way ANOVA followed by Tukey’s post hoc test. Schematic graphics created with Biorender software
Fig. 2
Fig. 2
HIVgp120 and IFNβ regulate total and microglial specific ephrin-B1 expression in hippocampus. A Sagittal brain section stained for astrocytic GFAP (blue), microglial Iba1 (Red) and ephrin-B1 (Green). Scale bar = 20um. B Values are Mean Intensity of ephrin-B1 fluorescence in CA1 hippocampal microglia. All mice for IHC were male, aged 3–4 months. IFNβ indicates intranasal treatment with the cytokine. Each data point represents n = 3 animals per genotype, with an average of 3 sections per animal and 2 images per section. Values are Mean + SD; FC = Fold Change; n.s. = non-significant (P > 0.05), Two Way ANOVA followed by Tukey’s post hoc test. C Increase in EFNB1 and EPHB2 mRNA expression following 24-h IFNβ treatment in human microglial HMC3 cells; n = 3–4 experiments, Two technical replicates averaged per experiment. Values are Mean ± SEM; FC = Fold Change; n.s. = non-significant, * P < 0.05, ** P < 0.01, *** P < 0.001, **** P < 0.0001, students t-test. D Analysis of mRNA expression of ephrin genes in the hippocampus of WT and IFNβKO. Relative mRNA expression was calculated by normalizing to Gapdh using the 2−ΔΔCt method. RNA of IFNβKO and WT mice for qRT-PCR was from hippocampus of males and females, n = 6 (male n = 3 – blue data points; female n = 3 – red data points) per genotype. Values are mean ± SEM; n.s., non-significant, * P ≤ 0.05, ** P ≤ 0.01, *** P ≤ 0.001, **** P ≤ 0.0001, One-Way ANOVA followed by Tukey’s post hoc test. Schematic graphics created with Biorender software
Fig. 3
Fig. 3
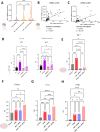
IRF7 regulates expression of type I interferon IFNβ, ISG IFIT1 and EPHB2. A Relative gene expression levels of IRF7 using mRNA from the middle frontal gyrus (neocortex) of Non-infected (n = 46) and HIV+ (n = 63), HIV+ No Brain Pathology (n = 44) and HIV+ Brain Pathology (n = 19). Relative gene expression levels of HIV+ (n = 63) patient’s cortex was used and Pearson correlations were calculated for IRF7 vs (B) EFNB1 (C) and EPHB2. (D) Relative gene expression levels of Irf7 from the cortex and hippocampus of 9-month-old WT, HIVgp120tg, IFNβKO and IFNβKO HIVgp120tg mice. n = 6 (n = 3 male – blue data points, n = 3 female – red data points) per genotype. Expression normalized to Beta-Actin. (E) IRF7, (F) EPHB2 (G) IFIT1 and (H) IFNβ mRNA expression following 48-h IRF7 siRNA or negative control siRNA treatment followed by 24-h IFNβ treatment or 0.001% BSA vehicle in human HMC3 cells; n = 3 biological replicates, 2 technical replicates averaged per experiment. Values are Mean ± SEM; FC = Fold Change; n.s. = non-significant, * P < 0.05, ** P < 0.01, *** P < 0.001, **** P < 0.0001, Two Way ANOVA followed by Tukey’s post hoc test. Schematic graphics created with Biorender software
Fig. 4
Fig. 4
EphB2 reverse signaling in microglia activates anti-viral and inflammatory genes and pathways. Bulk RNA sequencing of HMC3 microglia treated with EphB2-Fc or Ctrl-Fc for 24 h. A GO Enrichment of EphB2 vs Ctrl using the top 300 upregulated genes. B Volcano plot of differentially expressed genes of EphB2 vs Ctrl samples (0.4 log2Fc and 0.05 p-value cutoff). C Network analysis using Ingenuity Pathway Analysis (IPA) of the second highest scoring network (anti-viral network). Blue indicates predicted down-regulated while red reflects up-regulated genes respectively. D-E mRNA transcript levels of IL-6 and CD68 from EphB2 treated microglia. RNA sequencing; n = 3 biological replicates. qRT-PCR; n = 3 biological replicates, 2 technical replicates averaged per biological replicate. Values are Mean ± SEM; FC = Fold Change; * P ≤ 0.05, ** P ≤ 0.01, *** P ≤ 0.001, **** P ≤ 0.0001, n.s., non-significant, student’s t-test. Schematic graphics created with Biorender software
Fig. 5
Fig. 5
EphB2 reverse signaling induces a pro-inflammatory secretome profile, mediated in part by microglial ephrin-B1. A Multiplexed analysis of supernatants of human microglial HMC3 cells using LegendPlex bead assays following 48-h treatment with ephrin-B1 siRNA or scramble siRNA + 24-h EphB2-Fc (2ug/ml) or control-Fc (2ug/ml) exposure. n = 3 biological replicates. 2 technical replicates per biological replicate averaged. Heatmap values are z score based on averaged MFI of each technical multiplex replicate per experiment. B-E representative protein concentrations of IP-10, GM-CSF, CXCL1 and MMP-9 from the LegendPlex bead assay. F Network analysis for EphB2 vs Ctrl, and EphB2 + ephrin-B1 siRNA vs Ctrl (Ingenuity Pathway Analysis) to determine the network level changes from reducing ephrin-B1 during EphB2 mediated activation of microglia. Green indicates downregulated while red reflects upregulated genes, respectively. Blue indicates predicted down-regulated while orange reflects predicted up-regulated genes, respectively. Components without color represent genes without experimentally determined expression levels. * P < 0.05, ** P < 0.01, *** P < 0.001, **** P < 0.0001, n.s. = non-significant, Two-Way ANOVA followed by Tukey’s post hoc test. Schematic graphics created with Biorender software
Fig. 6
Fig. 6
Secreted factors from EphB2 activated microglia induce neurotoxicity. A Timeline beginning with microglial conditioned media (CM) transfer. HMC3 microglia were previously treated for 48 h with RNAiMAX reagents and negative control (scrambled siRNA) or ephrin-B1 siRNA, then stimulated for 24 h with pre-clustered EphB2-Fc or ctrl-Fc before supernatants were collected. B representative image of Vehicle-CM treated iGluta/iAstrocyte (6:1 neuron to astrocyte) co-cultures stained with MAP-2 for dendrites (red), GFAP for Astrocytes (green) and Hoechst Dye (Blue). C The iGluta/iAstrocyte co-cultures were exposed for 24 h to 50% cell-free CM from treated microglia (image of Vehicle-CM treated cells). Neurotoxicity was assessed with MAP-2/NeuN double positive neuron counts following 24 h exposure to 50% cell-free microglia CM. D Co-cultures of iGluta/iAstrocyte exposed to media conditioned by vehicle-treated microglia (Veh-CM) were used to define 100% neuronal survival. Values are Mean ± SEM; n = 3 independent co-culture experiments, with CM from n = 3 independent HMC3 EphB2 stimulation experiments. Total neuron cell counts per treatment: Veh-CM = 1123, EphB2-CM = 765, ephrin-B1 siRNA-CM = 954, ephrin-B1 siRNA + EphB2-CM = 969, EphB2-Ctrl = 822. * P < 0.05, ** P < 0.01, *** P < 0.001, **** P < 0.0001, n.s. = non-significant, Two Way ANOVA followed by Tukey’s post hoc test. Schematic graphics created with Biorender software

Update of

References

    1. Sacktor N, Skolasky RL, Seaberg E, Munro C, Becker JT, Martin E, Ragin A, Levine A, Miller E. Prevalence of HIV-associated neurocognitive disorders in the Multicenter AIDS Cohort Study. Neurology. 2016;86:334–40. - PMC - PubMed
    1. Ellis RJ, Marquine MJ, Kaul M, Fields JA, Schlachetzki JCM. Mechanisms underlying HIV-associated cognitive impairment and emerging therapies for its management. Nat Rev Neurol. 2023;19:668–87. - PMC - PubMed
    1. Kaul M, Garden GA, Lipton SA. Pathways to neuronal injury and apoptosis in HIV-associated dementia. Nature. 2001;410:988–94. - PubMed
    1. Castellano P, Prevedel L, Eugenin EA. HIV-infected macrophages and microglia that survive acute infection become viral reservoirs by a mechanism involving Bim. Sci Rep. 2017;7:12866. - PMC - PubMed
    1. Ru W, Liu X, Bae C, Shi Y, Walikonis R, Mo Chung J, Tang SJ. Microglia Mediate HIV-1 gp120-Induced Synaptic Degeneration in Spinal Pain Neural Circuits. J Neurosci. 2019;39:8408–21. - PMC - PubMed