. 2025 Jul 18;14(7):2865-2877.
doi: 10.1021/acssynbio.5c00320. Epub 2025 Jun 30.

Establishing a Malonyl-CoA Biosensor for the Two Model Cyanobacteria Synechocystis sp. PCC 6803 and Synechococcus elongatus PCC 7942

Affiliations

Establishing a Malonyl-CoA Biosensor for the Two Model Cyanobacteria Synechocystis sp. PCC 6803 and Synechococcus elongatus PCC 7942

Ivana Cengic et al. ACS Synth Biol. .

Abstract

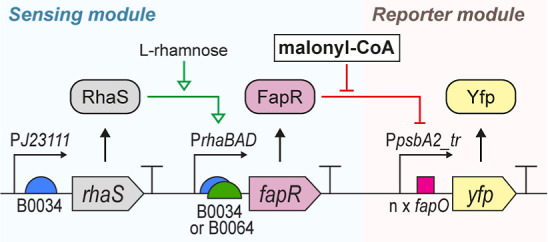
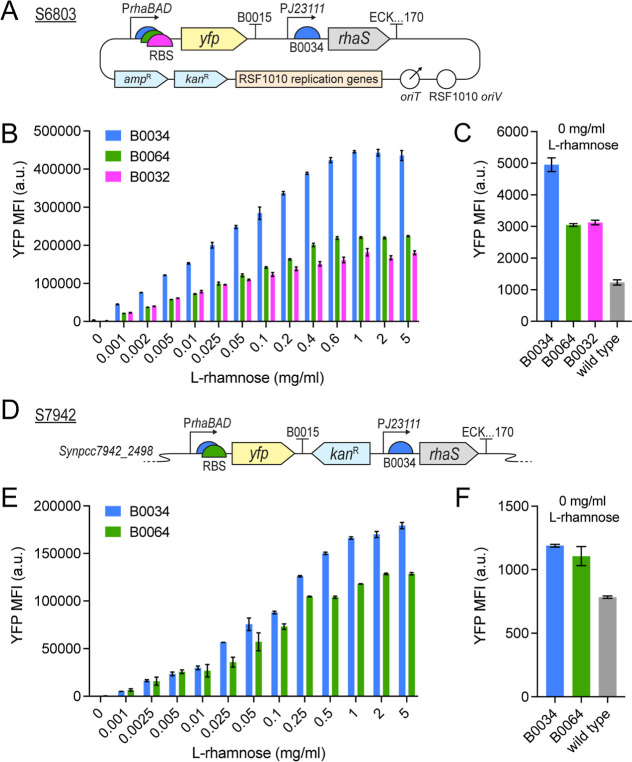
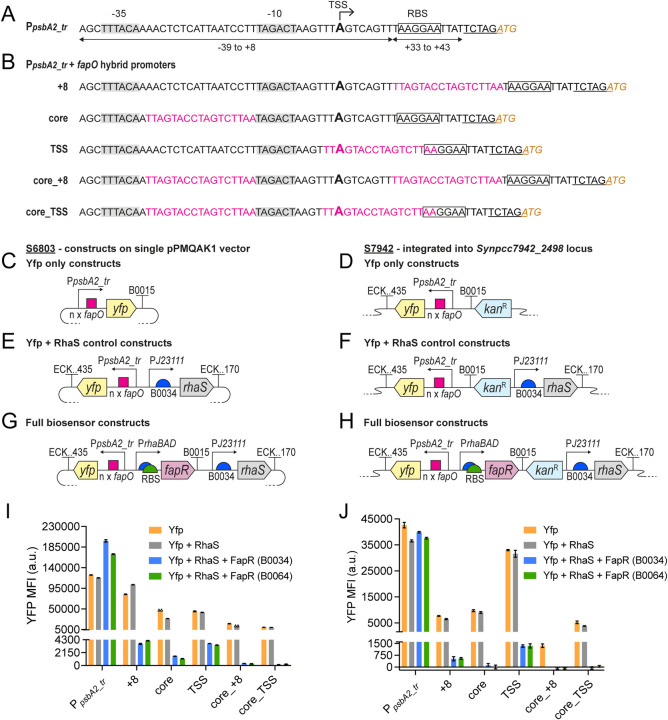
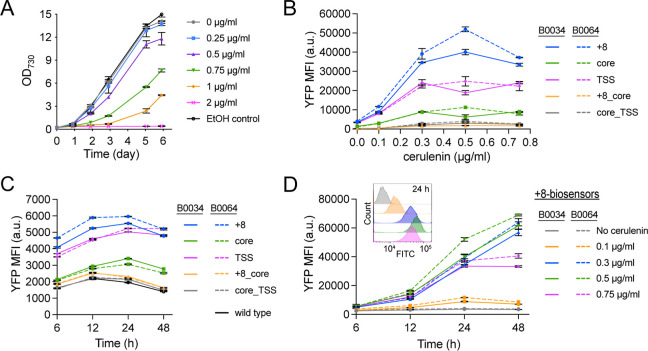
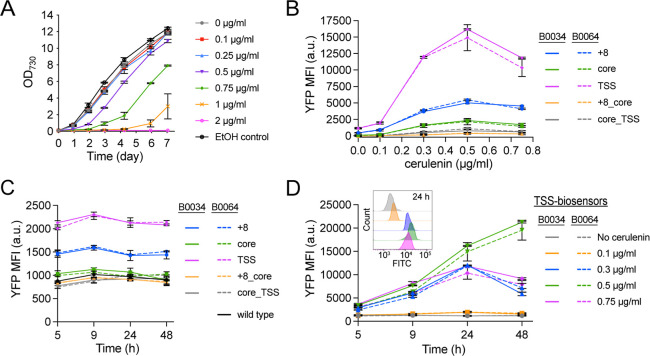
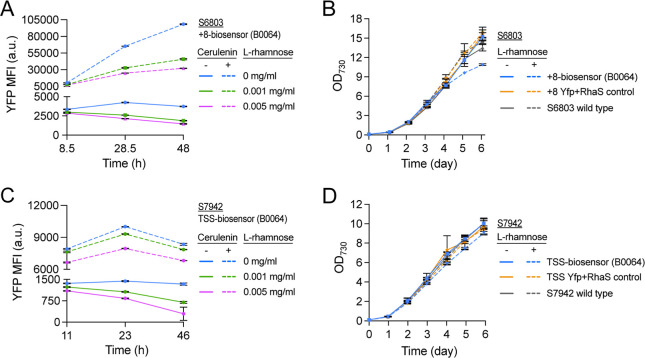
Malonyl-CoA, produced by the first committed step of fatty acid biosynthesis, is a precursor for many valuable bioproducts, making it an important metabolic engineering target. Here, we establish a malonyl-CoA biosensor for the model cyanobacteria Synechocystis sp. PCC 6803 and Synechococcus elongatus PCC 7942. The developed biosensor utilizes FapR, a malonyl-CoA-regulated transcriptional repressor from Bacillus subtilis, and novel FapR-regulated and cyanobacteria-compatible hybrid promoters for expressing Yfp, the biosensor output reporter. A l-rhamnose-inducible promoter PrhaBAD, characterized in combination with ribosome binding sites of varied strengths, was evaluated for titratable FapR expression. Additionally, the placement and quantity of the FapR-recognized operator within the hybrid promoter was evaluated for its effect on biosensor performance. The optimal operator placement was found to differ for the biosensor variants that achieved maximum reporter expression in the two considered model cyanobacteria. Overall, this biosensor provides new opportunities for further development of cyanobacterial cell factories.

Keywords: biosensor; cyanobacteria; inducible promoter; malonyl-CoA; synthetic biology; transcriptional repressor.


Figures

1
1
General schematic of the parts and mechanism of the malonyl-CoA biosensor established in this study. The sensing module supports inducible expression of the malonyl-CoA-regulated transcriptional repressor FapR; the inducible expression is driven by P rhaBAD and its coupled l-rhamnose-regulated activator RhaS. Two different RBS were tested in combination with P rhaBAD , namely, B0034 and B0064. The reporter module drives expression of a Yfp-reporter upon increased intracellular malonyl-CoA levels, since malonyl-CoA blocks the transcriptional repression carried out by FapR onto the Yfp-expressing hybrid promoter (P psbA2_tr -fapO ). Five different hybrid promoters were tested for driving FapR-controlled Yfp-output.
2
2
Evaluating the l-rhamnose-inducible P rhaBAD constructs in (A–C) S6803 and (D–F) S7942 using a Yfp-reporter. (A) Schematic of the replicative pPMQAK1-P rhaBAD constructs, with three RBS variants, evaluated in S6803. (D) Schematic of the integrative P rhaBAD constructs, with two RBS variants, evaluated in S7942. (A,D) ECK.170 stands for terminator ECK120015170. (B,E) Yfp fluorescence levels measured on day three: (B) 68 h for S6803 and (E) 70.5 h for S7942, after induction with 0–5 mg/mL l-rhamnose. Shown Yfp MFI values have been normalized against FITC MFI values obtained for the corresponding wild-type controls, see the methods section for details. (C,F) Non-normalized Yfp fluorescence levels at uninduced conditions (0 mg/mL l-rhamnose) on day three: (C) 68 h for S6803 and (F) 70.5 h for S7942, compared to the corresponding wild-type controls. All data is presented as averages ±SD for biological triplicates (S6803) or duplicates (S7942).
3
3
Design and evaluation of FapR-regulated hybrid promoters in S6803 and S7942. (A) Sequence of the truncated P psbA2 (P psbA2_tr ); bottom arrows and numbers detail the sequences taken from the full-length P psbA2 . The −35 and −10 boxes are shaded, an arrow and larger sized ″A″ marks the mapped TSS, the native P psbA2 RBS is boxed in, an added XbaI-site used for cloning purposes is underlined, and the start codon is in italic brown text. (B) Sequences of all hybrid promoter variants, combining P psbA2_tr and fapO (in pink text). The promoter components are detailed as in (A). (C–H) The hybrid promoters were evaluated in several types of constructs; herein, ECK.170 and ECK.435 stand for terminators ECK120015170 or ECK120034435, respectively. Shown schematics include the Yfp only constructs tested in (C) S6803 and (D) S7942, the Yfp and RhaS control constructs tested in (E) S6803 and (F) S7942, and the full biosensor constructs, with sensing modules featuring one of two RBS variants, tested in (G) S6803 and (H) S7942. Note that the S6803 constructs were expressed from the pPMQAK1 replicative vector; for this backbone schematic, see Figure a (note that the constructs in (C) have chloramphenicol resistance instead of kanamycin resistance). The S7942 constructs were integrated into the Synpcc7942_2498 locus. (I,J) Yfp fluorescence levels measured after 24 h for (I) S6803 and (J) S7942 strains. Shown Yfp MFI values have been normalized against FITC MFI values obtained for wild-type controls; see the methods section for details. All data is presented as averages ±SD for biological duplicates. Individual duplicate values are shown as open triangles only for the data with nonvisible error bars.
4
4
Evaluating the malonyl-CoA biosensor constructs in S6803. (A) Growth curves for S6803 wild-type-grown with 0–2 μg/mL cerulenin. The EtOH control tested the growth effect of the maximum amount of added ethanol (as in 2 μg/mL cerulenin). (B–D) P rhaBAD -B0034 and P rhaBAD -B0064 biosensor constructs are represented by solid or dashed lines, respectively. The biosensor variants are further denoted by the name of the hybrid promoter variant used in the reporter module, see Figure 3b for details. (B) Yfp fluorescence levels measured for the full set of malonyl-CoA biosensor variants after 24 h of treatment with 0–0.75 μg/mL cerulenin. Shown Yfp MFI values have been normalized against FITC MFI values obtained for wild-type controls treated with the corresponding cerulenin concentrations, see the methods section for details. (C) Non-normalized basal (no cerulenin added) Yfp MFI levels for the full set of malonyl-CoA biosensor variants throughout a two-day time-course. Values for a wild-type control are also shown. (D) Yfp fluorescence levels measured for the +8-biosensor variants throughout a two-day time-course of treatment with 0–0.75 μg/mL cerulenin; basal (no cerulenin added) values are also shown. Shown Yfp MFI values have been normalized against FITC MFI values obtained for wild-type controls treated with the corresponding cerulenin concentrations, see the methods section for details. The inset figure shows overlaid histograms of the FITC-channel data (excitation 488 nm, emission 525/40 nm) for the P rhaBAD -B0064 biosensor variant at 24 h (the colors are consistent with the legend in the main figure). All data is presented as averages ±SD for biological duplicates. Nonvisible error bars are smaller than the data symbol.
5
5
Evaluating the malonyl-CoA biosensor constructs in S7942. (A) Growth curves for S7942 wild-type-grown with 0–2 μg/mL cerulenin. The EtOH control tested the growth effect of the maximum amount of added ethanol (as in 2 μg/mL cerulenin). (B–D) P rhaBAD -B0034 and P rhaBAD -B0064 biosensor constructs are represented by solid or dashed lines, respectively. The biosensor variants are further denoted by the name of the hybrid promoter variant used in the reporter module, see Figure 3b for details. (B) Yfp fluorescence levels measured for the full set of malonyl-CoA biosensor variants after 24 h of treatment with 0–0.75 μg/mL cerulenin. Shown Yfp MFI values have been normalized against FITC MFI values obtained for wild-type controls treated with the corresponding cerulenin concentrations, see the methods section for details. (C) Non-normalized basal (no cerulenin added) Yfp MFI levels for the full set of malonyl-CoA biosensor variants throughout a two-day time-course. Values for a wild-type control are also shown. (D) Yfp fluorescence levels measured for the TSS-biosensor variants throughout a two-day time-course of treatment with 0–0.75 μg/mL cerulenin; basal (no cerulenin added) values are also shown. Shown Yfp MFI values have been normalized against FITC MFI values obtained for wild-type controls treated with the corresponding cerulenin concentrations, see the methods section for details. The inset figure shows overlaid histograms of the FITC-channel data (excitation 488 nm, emission 525/40 nm) for the P rhaBAD -B0064 biosensor variant at 24 h (the colors are consistent with the legend in the main figure). All data is presented as averages ±SD from biological duplicates. Nonvisible error bars are smaller than the data symbol.
6
6
Evaluating biosensor performance at induced FapR levels for selected biosensor constructs in (A,B) S6803 and (C,D) S7942. (A,C) Yfp fluorescence levels measured throughout a two-day time-course; tested biosensors constructs are the (A) + 8-biosensor (P rhaBAD -B0064) in S6803 and (C) TSS-biosensor (P rhaBAD -B0064) in S7942. Dashed lines represent the values for biosensor strains treated with 0.5 μg/mL cerulenin; solid lines represent basal (no cerulenin added) biosensor expression. The used concentrations of l-rhamnose to induce P rhaBAD -B0064-FapR are specified in the figures. Shown Yfp MFI values have been normalized against FITC MFI values obtained for wild-type controls treated with the corresponding cerulenin and/or l-rhamnose concentrations, see the methods section for details. (B–D) Growth curves for selected strains of (B) S6803 and (D) S7942, grown with or without 0.005 mg/mL l-rhamnose, the inducer for P rhaBAD -B0064-FapR. A wild-type strain and corresponding Yfp + RhaS strain were included as controls. All data is presented as averages ±SD from biological duplicates. Nonvisible error bars are smaller than the data symbol.

Similar articles

References

    1. Ducat D. C., Way J. C., Silver P. A.. Engineering cyanobacteria to generate high-value products. Trends Biotechnol. 2011;29:95–103. doi: 10.1016/j.tibtech.2010.12.003. - DOI - PubMed
    1. Oliver N. J., Rabinovitch-Deere C. A., Carroll A. L., Nozzi N. E., Case A. E., Atsumi S.. Cyanobacterial metabolic engineering for biofuel and chemical production. Curr. Opin. Chem. Biol. 2016;35:43–50. doi: 10.1016/j.cbpa.2016.08.023. - DOI - PubMed
    1. Knoot C. J., Ungerer J., Wangikar P. P., Pakrasi H. B.. Cyanobacteria: Promising biocatalysts for sustainable chemical production. J. Biol. Chem. 2018;293:5044–5052. doi: 10.1074/jbc.R117.815886. - DOI - PMC - PubMed
    1. Santos-Merino M., Singh A. K., Ducat D. C.. New Applications of Synthetic Biology Tools for Cyanobacterial Metabolic Engineering. Front Bioeng Biotechnol. 2019;7:33. doi: 10.3389/fbioe.2019.00033. - DOI - PMC - PubMed
    1. Sun T., Li S., Song X., Diao J., Chen L., Zhang W.. Toolboxes for cyanobacteria: Recent advances and future direction. Biotechnol. Adv. 2018;36:1293–1307. doi: 10.1016/j.biotechadv.2018.04.007. - DOI - PubMed

MeSH terms

Supplementary concepts

LinkOut - more resources