. 2025 Jun 26:18:8447-8475.
doi: 10.2147/JIR.S515286. eCollection 2025.

Qimai Feiluoping Decoction Inhibits EndMT to Alleviate Pulmonary Fibrosis by Reducing PI3K/AKT/mTOR Pathway-Mediated the Restoration of Autophagy

Affiliations

Qimai Feiluoping Decoction Inhibits EndMT to Alleviate Pulmonary Fibrosis by Reducing PI3K/AKT/mTOR Pathway-Mediated the Restoration of Autophagy

Jing Ma et al. J Inflamm Res. .

Abstract

Purpose: Pulmonary Fibrosis (PF) is a severe interstitial lung disease currently lacking effective prevention strategies. Endothelial mesenchymal transition (EndMT), a novel mechanism for fibroblast production, is closely associated with PF. The precise mechanisms underlying the contribution of EndMT-derived fibroblasts to PF, however, remain unclear.

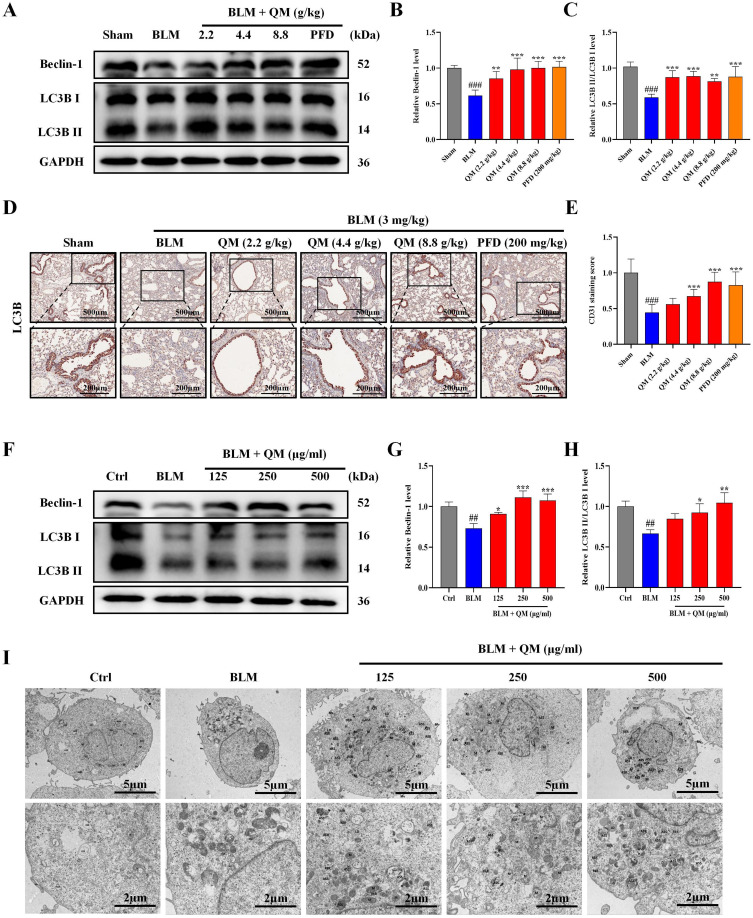
Methods: Using network pharmacology, molecular docking, and molecular dynamics, we identified the key targets and pathways through which Qimai Feiluoping decoction (QM) combats PF. EndMT and autophagy proteins were quantified in bleomycin (BLM) -induced C57BL/6 mice, human umbilical vein endothelial cells (HUVECs), and zebrafish using Western blotting (WB), quantitative real-time polymerase chain reaction (qRT-PCR), immunohistochemistry (IHC), immunofluorescence (IF), Transwell migration assays, and transmission electron microscopy (TEM), revealing the targets and pathways through which QM mitigates PF.

Results: Network pharmacology, molecular docking, and molecular dynamics suggest that QM combats PF by modulating the PI3K/AKT/mTOR pathway. Observations from the study indicated that QM was found to alleviate EndMT by restoring autophagy, primarily through inhibition of the PI3K/AKT/mTOR signaling pathway in both BLM-induced C57 mice and HUVECs. Supporting evidence from zebrafish models demonstrated that QM not only counteracts EndMT but also improves a range of vascular functional disorders and remodeling issues following EndMT.

Conclusion: Our research validates the active compounds, core targets, and signaling pathways through which QM counters PF, providing valuable insights for its therapeutic application in PF management.

Keywords: Qimai Feiluoping decoction; autophagy; endothelial mesenchymal transition; molecular docking; network pharmacology; pulmonary fibrosis.


Conflict of interest statement

The authors report no conflicts of interest in this work.

Figures

Figure 1
Figure 1
Process flowchart for research analysis.
Figure 2
Figure 2
Target selection and network construction. (A) Venn diagram depicting potential targets for PF treatment with QM. (B) The “drug-active compounds-target network”. The red circle represents common targets of QM and PF, and the green circle represents common active compounds. (C) PPI network of QM-targeted common proteins for PF therapy, with darker hues suggesting greater relevance. (D) GO enrichment analysis. (E) KEGG pathway enrichment analysis.
Figure 3
Figure 3
QM’s mitigation of EndMT in C57 Mice: IHC and IF analysis. (A) IHC image of CD31. (B) CD31 protein expression quantification. (C) IHC image of α-SMA. (D) α-SMA protein expression quantification (Lower panel images, scale bar = 200 μm, are zoomed-in versions from upper panel, scale bar = 500 μm). (E) IF image of CD31 and α-SMA (Scale bar = 50 μm). (F and G) Quantitative analysis of CD31 and α-SMA protein expressions. (n = 5). *p < 0.05, ***p < 0.001, compared to the BLM group. ### p < 0.001, compared to the Sham group.
Figure 4
Figure 4
Assessment of QM’s effect on EndMT in C57 mice using qPCR and WB techniques. (AF) qPCR results for mRNA levels of PAI, VE-cadherin, FSP1, MMP12, α-SMA, and Collagen I in lung tissue. (G) WB analysis for protein expression of these markers. (HM) Quantitative evaluation of protein levels using Image J software (n = 5). *p < 0.05, **p < 0.005, ***p < 0.001, compared to the BLM group. ## p < 0.005, ### p < 0.001, compared to the Sham group.
Figure 5
Figure 5
Evaluation of QM’s effect on EndMT in HUVECs via qPCR, WB, and IF techniques. (AF) qPCR analysis for mRNA expression levels of PAI, VE-cadherin, FSP1, MMP12, α-SMA, and Collagen I in HUVECs. (G) WB investigation of these proteins’ expression in HUVECs. (HM) Image J software quantification of protein expression. (N) IF image showcasing α-SMA (Scale bar = 50 μm). (O) Quantitative assessment of α-SMA protein expression (n ≥ 3). *p < 0.05, **p < 0.005, ***p < 0.001, compared to the BLM group. ## p < 0.005, ### p < 0.001, compared to the Ctrl group.
Figure 6
Figure 6
Assessment of QM’s role in restoring autophagy in C57 mice and HUVECs: WB, IHC, and Electron Microscopy. (A) WB analysis of Beclin-1 and LC3B proteins in mouse lung tissue. (B and C) Quantitative protein expression evaluation via Image J software. (D) IHC image showing LC3B distribution. (E) Quantitative LC3B expression analysis (Lower panel images, scale bar = 200 μm, enlarged from upper panel insets, scale bar = 500 μm) (n = 5). *p < 0.05, **p < 0.005, ***p < 0.001, compared to BLM group. # p < 0.05, ## p < 0.005, ### p < 0.001, compared to Sham group. (F) WB detection of Beclin-1 and LC3B protein expression in HUVECs. (G and H) Quantitative protein expression evaluation via Image J software. (I) TEM images of HUVECs. N nucleus; M mitochondria; (Images in the lower panel (scale bar = 2 μm) are magnified from the microphoto insets in the upper panel (scale bar = 5 μm)). (n ≥ 3). *p < 0.05, **p < 0.005, ***p < 0.001, compared to the BLM group. ## p < 0.005, ### p < 0.001, compared to the Ctrl group.
Figure 7
Figure 7
QM’s inhibition of PI3K/AKT/mTOR pathway phosphorylation in C57 mice: qPCR and WB analysis. (AC) qPCR detection of mRNA expressions in PI3K, AKT, and mTOR of the mouse lung tissue. (D) WB detection of protein expressions in P-PI3K, PI3K, P-AKT, AKT, P-mTOR, and mTOR of the mouse lung tissue. (EG) Quantitative analysis of protein expressions using Image J software. (n = 5). *p < 0.05, **p < 0.005, ***p < 0.001, compared to the BLM group. ## p < 0.005, ### p < 0.001, compared to the Sham group.
Figure 8
Figure 8
QM’s inhibition of PI3K/AKT/mTOR pathway in HUVECs: qPCR and WB methods. (AC) qPCR detection of mRNA expressions in PI3K, AKT, and mTOR in HUVECs. (D) WB detection of protein expressions of P-PI3K, PI3K, P-AKT, AKT, P-mTOR, and mTOR in HUVECs. (EG) Quantitative analysis of protein expressions using Image J software. (n ≥ 3). *p < 0.05, **p < 0.005, ***p < 0.001, compared to the BLM group. ## p < 0.005, ### p < 0.001, compared to the Ctrl group.
Figure 9
Figure 9
Verification of QM inhibiting the overexpression of P-mTOR: WB and IF methods after adding rapamycin. (A) WB detection of P-mTOR and mTOR protein expressions. (B) Quantitative analysis of protein expressions using Image J software. (C and D) Representative IF images of mTOR and P-mTOR. (Scale bar = 50 μm). (E) Quantitative analysis of positive expression of P-mTOR/mTOR protein (n = 3). ***p < 0.001, compared to the BLM group. ### p < 0.001, compared to the Ctrl group.
Figure 10
Figure 10
Evaluation of autophagy activator’s (rapamycin) effect on EndMT in HUVECs via qPCR and WB. (AF) qPCR analysis for mRNA expression levels of PAI, VE-cadherin, FSP1, MMP12, α-SMA, and Collagen I in HUVECs. (G) WB investigation of these proteins’ expression in HUVECs. (H-M) Image J software quantification of protein expression (n ≥ 3). * p < 0.05, ** p < 0.005, *** p < 0.001, compared to the BLM group. ## p < 0.005, ### p < 0.001, compared to the Ctrl group.
Figure 11
Figure 11
Molecular docking analysis. Molecular docking showed that drug-active compounds bind to PIK3CA, AKT1, and mTOR.
Figure 12
Figure 12
Molecular dynamics simulation results. (A) Ligand RMSD variations of three protein-Licoricesaponin-G2 complexes during 100 ns simulation. (B) Protein RMSF analysis of the three complexes. (C) Radius of gyration (RoG) changes over simulation time. (D) MM-GBSA binding energies and energy decomposition. (E) Number of hydrogen bonds between small molecule and proteins during MD simulation.
Figure 13
Figure 13
Zebrafish model validation of QM’s efficacy in vascular regeneration and endothelial repair. (A) Typical image of the subintestinal vessel area in zebrafish after QM treatment. Note: (Yellow dashed box: the analyzed subintestinal vessel area). (B) Quantitative measurement of the expression of subintestinal vessel area in zebrafish. (C) Typical image of the intersegmental vessel diameter in zebrafish after QM treatment. (Yellow dashed box: the three intersegmental vessels above the zebrafish’s cloacal pore). (D) Quantitative measurement of the expression of intersegmental vessel diameter in zebrafish. (E) Typical image of thrombosis in zebrafish (Yellow arrow: thrombosis). (F) Quantitative measurement of thrombosis occurrence in zebrafish. (G) Blood flow velocity in zebrafish after QM treatment. (H) Cardiac output in zebrafish after QM treatment. (n = 5). *p < 0.05, **p < 0.005, ***p < 0.001, compared to the Model group. ### p < 0.001, compared to the Ctrl group.
Figure 14
Figure 14
QM’s mechanism in pulmonary fibrosis: restoring autophagy and inhibiting PI3K/AKT/mTOR to alleviate EndMT.

Similar articles

References

    1. Lederer DJ, Martinez FJ. Idiopathic pulmonary fibrosis. N Engl J Med. 2018;378(19):1811–1823. doi: 10.1056/NEJMra1705751 - DOI - PubMed
    1. Sgalla G, Kulkarni T, Antin-Ozerkis D, et al. Update in pulmonary fibrosis 2018. Am J Respir Crit Care Med. 2019;200(3):292–300. doi: 10.1164/rccm.201903-0542UP - DOI - PubMed
    1. Moss BJ, Ryter SW, Rosas IO. Pathogenic mechanisms underlying idiopathic pulmonary fibrosis. Annu Rev Pathol. 2022;17:515–546. doi: 10.1146/annurev-pathol-042320-030240 - DOI - PubMed
    1. Chambers RC, Mercer PF. Mechanisms of alveolar epithelial injury, repair, and fibrosis. Ann Am Thorac Soc. 2015;12(Suppl 1):S16–20. doi: 10.1513/AnnalsATS.201410-448MG - DOI - PMC - PubMed
    1. Chanda D, Otoupalova E, Smith SR, et al. Developmental pathways in the pathogenesis of lung fibrosis. Mol Aspects Med. 2019;65:56–69. doi: 10.1016/j.mam.2018.08.004 - DOI - PMC - PubMed

LinkOut - more resources