. 2025 Jun 29;18(7):e70126.
doi: 10.1111/eva.70126. eCollection 2025 Jul.

Environmental Drivers of Genetic Divergence in Two Corals From the Florida Keys

Affiliations

Environmental Drivers of Genetic Divergence in Two Corals From the Florida Keys

Kristina L Black et al. Evol Appl. .

Abstract

Increasingly frequent marine heatwaves devastate coral reefs around the world, so there is great interest in finding warm-adapted coral populations that could be used as sources for assisted gene flow and restoration. Here, we evaluated the relative power of various environmental factors to explain coral genetic variation, suggestive of differential local adaptation to these factors, across the Florida Keys Reef Tract. We applied a machine learning population genomic method (RDAforest) to two coral species-the mustard hill coral Porites astreoides and the lettuce coral Agaricia agaricites-sampled from 65 sites covering the whole reef tract. Both species comprised three genetically distinct lineages distributed across depths in a remarkably similar way. Within these lineages, there was additional genetic divergence explained by depth, but even more within-lineage variation was cumulatively explained by water chemistry parameters related to nitrogen, phosphorus, silicate, and salinity. Visualizing the predicted environment-associated genetic variation on a geographic map suggests that these associations reflect adaptation to certain aspects of the inshore-offshore environmental gradient, and, to a lesser extent, to difference of Middle and Lower Keys from the rest of the reef tract. Thermal parameters, most notably maximal monthly thermal anomaly, were also consistently identified as putative drivers of genetic divergence, but had a relatively low explanatory power compared to depth and water chemistry. Overall, our results indicate that temperature was not the most important driver of coral genetic divergence in the Florida Keys, and underscore depth and water chemistry as more important environmental factors from the corals' perspective. Our study emphasizes the need for considering a variety of environmental variables, rather than solely focusing on temperature, when predicting how corals may respond to transplantation.

Keywords: 2bRAD; cryptic speciation; polygenic adaptation; random forest; seascape genomics.


Conflict of interest statement

The authors declare no conflicts of interest.

Figures
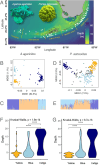
FIGURE 1
FIGURE 1
Sampling locations and genetic structure associated with depth. (A) Two ubiquitous coral species‐ Agaricia agaricites and Porites astreoides —were sampled across 65 sites spanning the entire Florida Keys Reef Tract. (B, C) Genetic structure of A. agaricites (n = 250). (D, E) Genetic structure of P. astreoides (n = 269). (B, D) Principal coordinate analyses based on the identity‐by‐state genetic distance matrices, colored by admixture assignment, with individuals with < 50% assignment to any lineage shown in gray. (C, E) Admixture barplots showing assignment of each individual to the three lineages. (F, G) Violin plots showing the range of depths inhabited by each admixture cluster. For both species, the shallow specialist cluster is depicted in yellow, the shallow‐preferring cluster is blue, and the depth‐tolerant cluster is indigo.
FIGURE 2
FIGURE 2
Proportions of genetic variation explained by RDAforest models, summed up by the type of predictor. The predictor types (y‐axis categories) are Depth, thermal parameters (“Therm”: Minimum monthly temperature, maximum monthly temperature, maximum monthly thermal anomaly), other physical parameters (“Phys”: Turbidity, water column stratification), and water chemistry (“Chem”: Remaining predictors related to N, P, Si and their ratios). The analysis either used complete datasets for the coral species (A, E) or subsets corresponding to cryptic lineages, indicated above the plots (B‐D, F, G). (A–D) A. agaricites , (E–G) P. astreoides . The value inside each plot is the total proportion of variation explained by the RDAforest model using predictors passing mtry‐based selection procedure.
FIGURE 3
FIGURE 3
Depth turnover curves (cumulative genetic variation captured as one moves across the predictor range). (A–C) Agaricia, (D–F) Porites. Label on top of each panel identifies the sample set: either whole species (A, D) or cryptic lineages (B, C, E, F).
FIGURE 4
FIGURE 4
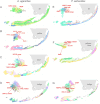
Maps of environment‐associated genetic variation (“adaptive neighborhoods”). (A–D) Agaricia, (E–G) Porites. Colors on the maps correspond to predicted scores along the first three principal axes of environment‐associated genetic variation (insets show the first two axes). Contrasting colors in each PCA (upper left of each panel) suggest differential adaptation, putatively driven by the corresponding environmental vectors. Those same colors plotted on the map indicate regions where corals may be locally adapted to their environmental predictors. Predictions are made only for points where the predictor values do not fall outside their range across sampled sites (Figure 1A) plus‐minus 10% margin. Arrows on the insets are directions of the most important environmental gradients, aligned with the predicted principal axes via linear regression. Sample set is identified by the black text label inside the Florida contour: Panels A and E show predictions based on all samples, other panels show predictions based on subsets of samples corresponding to cryptic lineages (Figure 1C,E).
FIGURE 5
FIGURE 5
Map of environmental suitability for transplanting a coral of A. agaricites indigo lineage from Marquesas Keys. Darker areas are less suitable. Arrows indicate source location (Marquesas Keys) and Looe Key Sanctuary Preservation Area. Dashed outline indicates a suitable area in the Upper Keys. The environmental mismatch is scaled to the 90% quantile of the range of present‐day genetic divergence predicted across the whole modeled area.

References

    1. Aitken, S. , and Whitlock M.. 2013. “Assisted Gene Flow to Facilitate Local Adaptation to Climate Change.” Annual Review of Ecology, Evolution, and Systematics 44: 367–388.
    1. Bairos‐Novak, K. R. , Hoogenboom M. O., van Oppen M. J. H., and Connolly S. R.. 2021. “Coral Adaptation to Climate Change: Meta‐Analysis Reveals High Heritability Across Multiple Traits.” Global Change Biology 27, no. 22: 5694–5710. - PubMed
    1. Baker, A. , and Cunning R.. 2016. “Bulk gDNA Extraction From Coral Samples.” Accessed 2025 February 25. https://www.protocols.io/view/Bulk‐gDNA‐extraction‐from‐coral‐samples‐dy....
    1. Banister, R. B. , and van Woesik R.. 2021. “Ranking 67 Florida Reefs for Survival of Acropora cervicornis Outplants.” Frontiers in Marine Science 8: 672574.
    1. Barshis, D. J. , Ladner J. T., Oliver T. A., Seneca F. O., Traylor‐Knowles N., and Palumbi S. R.. 2013. “Genomic Basis for Coral Resilience to Climate Change.” Proceedings of the National Academy of Sciences of the United States of America 110, no. 4: 1387–1392. - PMC - PubMed

LinkOut - more resources