. 2025 Jun 16:15:1597690.
doi: 10.3389/fcimb.2025.1597690. eCollection 2025.

Oral bacterial community dynamics during induction of gingival inflammation

Affiliations

Oral bacterial community dynamics during induction of gingival inflammation

Bart J F Keijser et al. Front Cell Infect Microbiol. .

Abstract

Introduction: The human oral cavity is a complex and dynamic microbial ecosystem integral to oral and overall health. While the specific roles of microbial communities in health and disease are not fully understood, dysbiosis of the oral microbiota is, along with inadequate immune fitness, recognized as a key factor driving the onset of inflammatory conditions such as gingivitis. Gingivitis, an early and reversible stage of periodontal disease, involves shifts in microbial composition and diversity. This study aimed to investigate the compositional dynamics of the oral microbiota during the early stages of gingival inflammation, focusing on changes across multiple oral niches and their relationship to clinical outcomes.

Methods: We conducted an experimental gingivitis intervention study with 41 healthy volunteers. After a two-week baseline period, participants refrained from oral hygiene for two weeks to induce gingivitis, followed by a one-week resolution phase with resumed oral hygiene. Clinical parameters, including plaque and bleeding scores, were monitored at seven time points. Samples from saliva and five oral niches (tongue, keratinized gingiva, supragingival, subgingival, and interproximal dental plaque) were collected and analyzed using 16S rRNA gene sequencing. Multivariate statistical analyses were applied to evaluate microbial dynamics and their associations with clinical outcomes.

Results: The study revealed pronounced microbial changes, particularly in supragingival plaque, where Leptotrichia and Prevotella increased while Streptococcus decreased. Alpha diversity significantly increased in supragingival plaque, tongue, and saliva during gingivitis induction, highlighting shifts in microbial complexity. Clinical correlations indicated that plaque presence was primarily associated with bacterial load, while gingival bleeding was driven by compositional changes in supragingival plaque and tongue biofilms. These findings suggest that microbial density and composition independently contribute to gingivitis markers.

Conclusion: This study concludes that occurrence of dental plaque and gingival bleeding are independent clinical parameters, linked to bacterial load and composition, respectively. Interactions between multiple niches, especially the tongue, influence clinical outcomes, highlighting a complex, nonlinear dynamic behavior in the oral microbiota. These findings suggest intricate ecological interactions that may approach tipping points, advancing understanding of microbial dynamics during gingival inflammation and informing future strategies for managing gingivitis.

Keywords: 16S rRNA gene sequencing; dysbiosis; gingivitis; inflammation; microbial dynamics; oral microbiota; plaque.


Conflict of interest statement

The authors declare that the research was conducted in the absence of any commercial or financial relationships that could be construed as a potential conflict of interest.

Figures

Figure 1
Figure 1
Timeline and study set-up. This longitudinal study involved 41 volunteers. The study set-up consisted of a two-week baseline period during which volunteers brushed teeth with a standardized toothbrush and toothpaste. After this period, volunteers refrained from oral hygiene for two weeks (induction of gingivitis period), followed by a one-week period where volunteers reinstated their oral hygiene routines. Assessments included clinical, inflammatory and immunological parameters as well as microbiome assessments of six different niches within the oral cavity.
Figure 2
Figure 2
Clinical and immunological effects of experimental gingivitis. (A) Percentage of bleeding sites, and (B) percentage of plaque-covered sites relative to all examined sites. Measurements for panels A and B were taken before the induction of gingivitis (visits 1 and 2; days -14 and 0), at the end of the experimental period (visit 6; day 14), and one week post-experiment (visit 7; day 21). (C) Volume of gingival crevicular fluid (GCF). (D–F) Percentage of viable oral polymorphonuclear neutrophils (oPMNs), total oPMN count, and viable oPMN count, respectively. Measurements for (C–F) were taken before gingivitis induction (visits 1 and 2), during the experimental period (visit 5; day 9), at its conclusion (visit 6; day 14), and one week post-experiment (visit 7; day 21). Significant differences compared to visit 2 are indicated (*P < 0.05, ***P < 0.001).
Figure 3
Figure 3
Bacterial load, as determined by 16S ribosomal gene abundance (qPCR) in the six niches as assessed as quantity of femtograms bacterial genomic DNA per mL, throughout the study. Annotations indicate a significant difference versus visit 2 (***P < 0.001; **P < 0.01; *P < 0.05). The microbiota of six oral niches sampled were lower jaw gingiva (GL), interproximal plaque (PI), supragingival plaque (PL), subgingival plaque (SL), posterior tongue (TP) and unstimulated saliva (US). Visits 1 and 2 - baseline, visit 3 - day 2, visit 4 - day 5, visit 5 - day 9 and visit 6 - day 14 of experimental gingivitis, visit 7 - day 7 of the resolution phase.
Figure 4
Figure 4
Boxplots showing microbial alpha diversity, as determined by the Shannon index of the six niches throughout the study. Annotations indicate a significant difference versus visit 2 (***P < 0.001; **P < 0.01; *P < 0.05). The microbiota of six oral niches sampled were: lower jaw gingiva (GL), interproximal plaque (PI), supragingival plaque (PL), subgingival plaque (SL), posterior tongue (TP) and unstimulated saliva (US). Visits 1 and 2 - baseline, visit 3 - day 2, visit 4 - day 5, visit 5 - day 9 and visit 6 - day 14 of experimental gingivitis, visit 7 - day 7 of the resolution phase.
Figure 5
Figure 5
Boxplots showing within-subject Aitchison distance from visit 2 for the six niches throughout the study. Annotations indicate a significant difference versus visit 2 (***P < 0.001; **P < 0.01; *P < 0.05). The microbiota of six oral niches sampled were: lower jaw gingiva (GL), interproximal plaque (PI), supragingival plaque (PL), subgingival plaque (SL), posterior tongue (TP) and unstimulated saliva (US). Visits 1 and 2 - baseline, visit 3 - day 2, visit 4 - day 5, visit 5 - day 9 and visit 6 - day 14 of experimental gingivitis, visit 7 - day 7 of the resolution phase.
Figure 6
Figure 6
PCA plot of the microbial communities from all niches. Individual samples are shown using translucent dots. The centroid value for all subjects within each niche-time combination is shown with a larger filled dot. Color hues correspond to different niches, with the tint varying from light to dark, corresponding with the visits. Within each niche, subsequent visits are connected with arrows, starting from the first visit and ending with the last. Niches were the lower jaw gingiva (GL), interproximal plaque (PI), supragingival plaque (PL), subgingival plaque (SL), posterior tongue (TP) and unstimulated saliva (US). The timepoints were: 1 and 2 - baseline; 3 - day 2, 4 - day 5, 5 - day 9 and 6 - day 14 of experimental gingivitis; 7 - day 7 of the resolution phase.
Figure 7
Figure 7
PCA plot of the microbiota of the interproximal plaque (PI) and supragingival plaque (PL). The top 20 MED nodes with the overall strongest association to the ordination axes are shown in red.
Figure 8
Figure 8
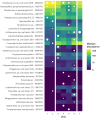
Heat map showing the MEDs (prefixed with taxonomic assignment) that were most representative for each time point of the gingivitis intervention period for the supragingival plaque (PL) niche. The tile color shows the median abundance (number of reads) of a particular MED in this niche. MEDs were selected using Elastic et regression, based on capability of their abundance to help in uniquely discriminating the visit from all other visits. The white dots indicate whether a taxon was selected as discriminative for that timepoint; its size indicates the relative importance in the model.
Figure 9
Figure 9
Network correlation (force directed graph) showing the significant (Spearman Rho P<0,05) correlations of oPMN cell counts (cells), viable oPMN counts (Viable cells), and viable fraction of oPMNs (Viability %), BOMP (bleeding) and plaque percentages, GCF volume along with microbiome compositional change as determined by the Aitchison’s distances relative to the baseline (Visit 2) at each visit for the bacterial load in biofilm samples collected for the lower jaw gingiva (distance GL), supragingival plaque (distance PL), subgingival plaque (distance SL), posterior tongue (distance TP) and unstimulated saliva (distance US). Spearman correlations were computed using pairwise complete observations meaning each correlation reflects data from the subset of time points where both variables were present for a given participant. Edges represent the strength of the correlation (|ρ|), and node colors indicate variable categories (clinical, immune, microbial load, microbial distance). Node positions were determined using a force-directed layout, such that strongly correlated variables cluster together.
Figure 10
Figure 10
The relationships between individual microbial taxa (MEDs) and the clinical parameters - gingival bleeding and plaque - during the baseline (Brushing phase) and the experimental gingivitis intervention (Challenge phase) at each niche. Panels from left to right show results for the lower jaw gingiva (GL), interproximal plaque (PI), supragingival plaque (PL), subgingival plaque (SL), tongue (TP) and saliva (US) The logFC value shows how taxonomic abundance changed with a one unit increase of bleeding and plaque. Bleeding is expressed as the square-root of the fraction of sites with gingival bleeding of all examined sites, while plaque is expressed as the square of the fraction of sites with plaque of all examined sites. Only logFC values with a Benjamini-Hochberg adjusted p-value < 0.05 are shown.

References

    1. Abbas F., Van der Velden U., Hart A. A., Moorer W. R., Vroom T. M., Scholte G. (1986). Bleeding/plaque ratio and the development of gingival inflammation. J. Clin. Periodontol 13, 774–782. doi: 10.1111/j.1600-051X.1986.tb00881.x - DOI - PubMed
    1. al-Essa L., Niwa M., Kohno K., Tsurumi K. (1994). A proposal for purification of salivary polymorphonuclear leukocytes by combination of nylon mesh filtration and density-gradient method: a validation by superoxide- and cyclic AMP-generating responses. Life Sci. 55, Pl333–Pl338. doi: 10.1016/0024-3205(94)00773-X - DOI - PubMed
    1. Arimatsu K., Yamada H., Miyazawa H., Minagawa T., Nakajima M., Ryder M. I., et al. (2014). Oral pathobiont induces systemic inflammation and metabolic changes associated with alteration of gut microbiota. Sci. Rep. 4, 4828. doi: 10.1038/srep04828 - DOI - PMC - PubMed
    1. Ashkenazi M., Dennison D. K. (1989). A new method for isolation of salivary neutrophils and determination of their functional activity. J. Dent. Res. 68, 1256–1261. doi: 10.1177/00220345890680080901 - DOI - PubMed
    1. Badersten A., Nilvéus R., Egelberg J. (1990). Scores of plaque, bleeding, suppuration and probing depth to predict probing attachment loss. 5 years of observation following nonsurgical periodontal therapy. J. Clin. Periodontol 17, 102–107. doi: 10.1111/j.1600-051X.1990.tb01070.x - DOI - PubMed

MeSH terms

LinkOut - more resources