Phosphate transporter gene families in rye (Secale cereale L.) - genome-wide identification, characterization and sequence diversity assessment via DArTreseq
- PMID: 40589952
- PMCID: PMC12206809
- DOI: 10.3389/fpls.2025.1529358
Phosphate transporter gene families in rye (Secale cereale L.) - genome-wide identification, characterization and sequence diversity assessment via DArTreseq
Abstract
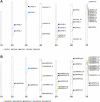
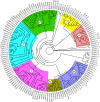
Phosphorus is a macronutrient indispensable for plant growth and development. Plants utilize specialized transporters (PHT) to take up inorganic phosphorus and distribute it throughout the plant. The PHT transporters are divided into five families: PHT1 to PHT5. Each PHT family has a particular physiological and cellular function. Rye (Secale cereale L.) is a member of Triticeae, and an important source of variation for wheat breeding. It is considered to have the highest tolerance of nutrient deficiency, among Triticeae. To date, there is no report about genes involved in response to phosphorus deficiency in rye. The aim of this study was to: (i) identify and characterize putative members of different phosphate transporter families in rye, (ii) assess their sequence diversity in a collection of 94 diverse rye accessions via low-coverage resequencing (DArTreseq), and (iii) evaluate the expression of putative rye Pht genes under phosphate-deficient conditions. We identified 29 and 35 putative Pht transporter genes in the rye Lo7 and Weining reference genomes, respectively, representing all known Pht families. Phylogenetic analysis revealed a close relationship of rye PHT with previously characterized PHT proteins from other species. Quantitative RT PCR carried out on leaf and root samples of Lo7 plants grown in Pi-deficient and control condition demonstrated that ScPht1;6, ScPht2 and ScPht3;3 are Pi-deficiency responsive. Based on DArTreseq genotyping of 94 diverse rye accessions we identified 820 polymorphic sites within rye ScPht, including 12 variants identified by the SIFT algorithm as having a potentially deleterious effect, of which three are scored as high confidence. SNP density varied markedly between ScPht genes. This report is the first step toward elucidating the mechanisms of rye's response to Pi deficiency. Our findings point to multiple layers of adaptation to local environments, ranging from gene copy number variation to differences in level of polymorphism across Pht family members. DArTreseq genotyping permits for a quick and cost-effective assessment of polymorphism levels across genes/gene families and supports identification and prioritization of candidates for further studies. Collectively our findings provide the foundation for selecting most promising candidates for further functional characterization.
Keywords: Pht genes; Secale cereale L.; expression profiling; gene diversity; low-coverage resequencing; phosphate deficiency; phylogenetic relationships; rye.
Copyright © 2025 Chan-Rodriguez, Koboyi, Werghi, Till, Maksymiuk, Shoormij, Hilderlith, Hawliczek, Królik and Bolibok-Brągoszewska.
Conflict of interest statement
The authors declare that the research was conducted in the absence of any commercial or financial relationships that could be construed as a potential conflict of interest.
Figures


Similar articles
-
Antidepressants for pain management in adults with chronic pain: a network meta-analysis.Health Technol Assess. 2024 Oct;28(62):1-155. doi: 10.3310/MKRT2948. Health Technol Assess. 2024. PMID: 39367772 Free PMC article.
-
Comparative Transcriptome Analysis of Two Types of Rye Under Low-Temperature Stress.Curr Issues Mol Biol. 2025 Mar 3;47(3):171. doi: 10.3390/cimb47030171. Curr Issues Mol Biol. 2025. PMID: 40136425 Free PMC article.
-
A rapid and systematic review of the clinical effectiveness and cost-effectiveness of paclitaxel, docetaxel, gemcitabine and vinorelbine in non-small-cell lung cancer.Health Technol Assess. 2001;5(32):1-195. doi: 10.3310/hta5320. Health Technol Assess. 2001. PMID: 12065068
-
Incentives for preventing smoking in children and adolescents.Cochrane Database Syst Rev. 2017 Jun 6;6(6):CD008645. doi: 10.1002/14651858.CD008645.pub3. Cochrane Database Syst Rev. 2017. PMID: 28585288 Free PMC article.
-
Drugs for preventing postoperative nausea and vomiting in adults after general anaesthesia: a network meta-analysis.Cochrane Database Syst Rev. 2020 Oct 19;10(10):CD012859. doi: 10.1002/14651858.CD012859.pub2. Cochrane Database Syst Rev. 2020. PMID: 33075160 Free PMC article.
References
-
- Ahmad I., Rawoof A., Islam K., Momo J., Ramchiary N. (2021). Identification and expression analysis of phosphate transporter genes and metabolites in response to phosphate stress in Capsicum annuum. Environ. Exp. Bot. 190, 104597. doi: 10.1016/j.envexpbot.2021.104597 - DOI
-
- Anandan A., Parameswaran C., Mahender A., Nayak A. K., Vellaikumar S., Balasubramaniasai C., et al. (2021). Trait variations and expression profiling of OsPHT1 gene family at the early growth-stages under phosphorus-limited conditions. Sci. Rep. 11, 13563. doi: 10.1038/s41598-021-92580-7 - DOI - PMC - PubMed
-
- Bandi V., Gutwin C. (2020). Interactive exploration of genomic conservation. Proceedings of Graphic Interface: University of Toronto, 28-29, 74–83. doi: 10.20380/GI2020.09 - DOI
LinkOut - more resources
Full Text Sources
Research Materials
Miscellaneous

