. 2025 Sep;9(9):e00147.
doi: 10.1002/adbi.202500147. Epub 2025 Jul 1.

Investigating the Cellular Effects of GALC Dosing in Enzyme Replacement Therapy for Krabbe Disease Supports the Role of Nanomedicine

Affiliations

Investigating the Cellular Effects of GALC Dosing in Enzyme Replacement Therapy for Krabbe Disease Supports the Role of Nanomedicine

Ambra Del Grosso et al. Adv Biol (Weinh). 2025 Sep.

Abstract

Krabbe disease (KD) is a lysosomal storage disorder characterized by severe neurodegeneration and demyelination. It is caused by mutations in the galactosylceramidase (GALC) gene, leading to the accumulation of psychosine, a neurotoxic metabolite. This study presents an optimized workflow for the production and characterization of recombinant murine GALC (rm-GALC) from HEK293T cells, aiming to improve the feasibility of enzyme replacement therapy (ERT) for KD. An affinity chromatography protocol is refined to purify His-tagged rm-GALC, followed by buffer exchange and concentration steps to produce a stable and active enzyme suitable for subsequent in vitro applications. The purified rm-GALC is characterized for enzymatic activity, purity, and stability using SDS-PAGE, immunoblotting, and dynamic light scattering (DLS). In vitro assays reveal dose-dependent enzymatic activity recovery in KD primary cells upon rm-GALC administration, with no adverse effects on cell viability up to the physiological GALC dose. Additionally, GALC treatment at the physiological dose restored autophagic function in KD cells, as shown by LC3 and p62 marker analyses, confirming its compatibility with lysosomal-autophagic pathways. Conversely, supra-physiological GALC administration resulted in decreased viability and autophagy impairment. Finally, the feasibility of loading GALC into a polymeric nanovector based on stabilized reverse micelles is investigated. These findings highlight the critical importance of precise GALC dose regulation in developing a safe and effective enzyme replacement therapy (ERT) strategy for Krabbe disease (KD), further supporting the potential of a nanovector-mediated ERT approach.

Keywords: Krabbe disease; Twitcher mouse; autophagy modulation; enzyme replacement therapy; eukaryotic recombinant enzymes purification; galactosylceramidase (GALC); globoid cell leukodystrophy; nanomedicine.


Conflict of interest statement

The authors declare no conflict of interest.

Figures

Figure 1
Figure 1
GALC enzymatic assays optimization. a) Graph showing the detected fluorescence (FL) plotted against the nmol of the fluorescent product 4‐MU. b) The linear range for FL versus nmol of 4‐MU selected for accurate extrapolation of enzyme activity from FL measurements is between 0 and 30 nmol mL−1 of 4‐MU. c) Graph showing the detected FL plotted against the amount of rm‐GALC in ng. d) The linear range for FL in relation to the amount of rm‐GALC (ng) used in the enzymatic assays spans from 0 to 250 ng of rm‐GALC.
Figure 2
Figure 2
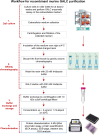
Workflow for recombinant murine Galactosylcermaidase (rm‐GALC) purification. A schematic representation of the purification process for rm‐GALC. Briefly, extracellular media are collected every 14 days from roller bottle cell cultures overexpressing His6‐tagged rm‐GALC. The media is centrifuged, and the supernatant is filtered through a 0.45 µm filter. After overnight incubation with nickel‐charged resin, gravity column chromatography is performed. A 25 mm buffer is used for six washing steps, followed by elution with a 300 mM buffer. The eluted enzyme is then buffer‐exchanged into the appropriate storage buffer, concentrated to approximately 2 µg µL−1 with 10 kDa cutoff centrifugal filters, and stored at −20 °C. The enzyme is characterized through enzymatic activity and protein quantification assays, SDS‐PAGE, Western blot, and DLS analysis.
Figure 3
Figure 3
Monitoring of extracellular rm‐GALC activity in roller bottle cell culture. The graph shows results from the HMU‐β‐gal enzymatic assays to measure the concentration of rm‐GALC in the extracellular media of HEK293T cells engineered to overexpress His6‐tagged rm‐GALC. Measurements were taken at three time points: 0, 5, and 14 days after cell culture establishment. Control HEK293T cells were also included in the assays (see the legend). No FL was detected at the days of culture establishment, while a significant increase in FL was observed 5 days later (*p < 0.05; one‐way ANOVA, Dunnett's test), with a peak 14 days later (****p < 0.0001; T2 vs. T0). Values are presented as the mean ± standard error of the mean (SEM). n = 3 independent experiments.
Figure 4
Figure 4
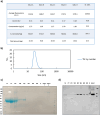
Characterization of the purified rm‐GALC. a) The table summarizes the characterization of five separate batches of rm‐GALC purified independently. The first row presents the average FL values obtained from the β‐gal assay. The second row reports the nmol of 4‐MU calculated by interpolation with the standard curve. The third row lists the protein concentration measured using the BCA assay. The fourth row shows the enzymatic activity, expressed as nmol of product per hour per mg of rm‐GALC used in the assay. The final row provides the total amount of rm‐GALC purified in each independent purification. b) DLS trace acquired on the rm‐GALC sample solution (percent intensity by number, %In), indicating a monomodal distribution of molecular size and low polydispersion. c) The gel shows the SDS‐page profile for the fractions obtained from rm‐GALC purification. M = collected media; FT = flowthourght; W1–6 = wash 1–6; E = elution; GALC 1 – 2 = purified rm‐GALC charged in different amount. Contaminants are present up to W3, whereas the characteristic rm‐GALC bands are detected in GALC 1 and GALC 2. d) Western blot analysis of rm‐GALC in purification fractions. Western blotting performed on fractions obtained from rm‐GALC purification confirms the presence of rm‐GALC across all fractions, with higher concentrations observed in the purified rm‐GALC samples.
Figure 5
Figure 5
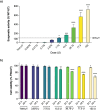
Characterization of enzymatic recovery and cell viability after in vitro ERT. a) Enzyme replacement therapy in vitro with rm‐GALC. Purified rm‐GALC was administered to KD primary cells at nine increasing concentrations: 0.0078 U, 0.0775 U, 0.775 U, 3.875 U, 7.75 U, 15.5 U, 38.75 U, 77.5 U, 155 U (enzymatic unit, U = nmol h−1). HMU‐β‐gal enzymatic assays were performed on cell lysates 4 h post‐administration. Results are reported in % of the WT‐UT activity. Dose of 7.75 U fully restores enzymatic activity to wild‐type (WT) levels (*p < 0.05 for Dose 7.75 U vs. TWI‐UT; One‐way ANOVA, Tukey's test). Dose 15.5 U 6 results in slightly higher enzymatic activity than WT cells (**p < 0.001 vs. WT‐UT; One‐way ANOVA, Tukey's test). Dose 38.75, 77.5, and 155 show significantly increased enzymatic activities compared to WT cells (****p < 0.0001 for Dose 38.75, 77.5 and 155 versus WT‐UT; One‐way ANOVA, Tukey's test). b) Cell viability assay conducted on TWI cells treated with Dose 3.875‐155 U 4–9 of rm‐GALC, measured 24 and 48 h post‐treatment. * p < 0.05 Dose 155 U 24 h versus TWI‐UT 24 h; ** p < 0.01 Dose 15.5 U 48 h versus TWI‐UT 48 h; **** p < 0.0001 Doses 38.75 U, 77.5 U, 155 U versus TWI‐UT 48 h; One‐way ANOVA, Dunnett's test. Data are reported as mean ± SEM; n = 3.
Figure 6
Figure 6
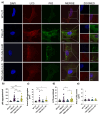
rm‐GACL‐mediated autophagy modulation in TWI (KD) primary cells. a) Immunohistochemistry staining of wild‐type untreated cells (WT‐UT), Twitcher untreated cells (TWI‐UT), Twitcher cells treated with a supra‐physiological dose of rm‐GALC (Dose 155 U; TWI+GALC‐HD), and Twitcher cells treated with the physiological dose of rm‐GALC (Dose 7.75 U; TWI+GALC‐LD). Cells are stained with anti‐LC3 (in red) and anti‐p62 (in green) antibodies, nuclei are stained with DAPI (in blue). Scale bar: 10 µm. A 8 X zoom is shown in the right part of the figure for each merged image. Scale bar zoomed image: 1.25 µm. (b‐c) Analysis of the number and average area of p62 aggregates per cell. b) Number of p62 puncta: **** p < 0.0001, TWI‐UT, and TWI+GALC‐HD versus WT‐UT, TWI+GALC‐LD versus TWI‐UT, and TWI+GALC‐HD versus TWI+GALC‐LD. c) Average area of p62 aggregates (µm2): * p < 0.05 TWI+GALC‐LD versus TWI‐UT and TWI+GALC‐HD versus WT‐UT. d,e) Analysis of the number and average area of LC3 puncta per cell. d) Number of LC3 puncta: * p < 0.05 TWI+GALC‐LD versus TWI‐UT and TWI+GALC‐HD versus TWI+GALC‐LD. e) Average area of LC3 puncta (µm2). Data are reported as mean ± SD, and compared using One way ANOVA (Tukey's multiple comparisons test). n = between 19 and 29 cells for each experimental group.
Figure 7
Figure 7
Rm‐GALC encapsulation into polymeric stabilized reverse micelle (SRM)‐based nanovectors. a) Hydrodynamic diameter (nm) of empty SRMs (SRMs) and rm‐GALC loaded SRMs (GALC‐SRMs). b) Zeta potential of empty SRMs and GALC‐SRMs. *** p < 0.001 SRMs versus GALC‐SRMs; Student's t‐test. c) Enzymatic activity of: GALC‐SRMs, the supernatant resulting from GALC loading into empty SRMs (supernatant), and GALC solution (GALC). ** p < 0.01 GALC‐SRMs versus supernatant; * p < 0.05 supernatant versus GALC; One way ANOVA with Bonferroni correction for selected pairs. Data are reported as mean ± SEM n = 3.
Figure 8
Figure 8
Effect of rm‐GALC on autophagy regulation. This schematic illustrates the hypothesized impact of rm‐GALC dosing on autophagy regulation. Administration of a supra‐physiological dose may overwhelm the autophagy flux, impairing the proper degradation of materials within the pathway. Conversely, our results indicate that administering a physiological dose of rm‐GALC sufficient to restore normal enzymatic activity supports the recovery of autophagy flux. This promotes the clearance of abnormally accumulated materials typically observed in TWI cells. These findings underscore the importance of precise dosing in therapeutic strategies aiming to restore GALC activity and normalize cellular processes in KD tissues, strongly supporting the role of nanomedicine‐based ERT strategies. A schematic nanovector representation is shown: stabilized reverse micelle (SRMs; right) and polymeric nanoparticles (PLGA‐NPs; left). RmGALC = recombinant murine Galactosylceramidase; TWI = Twitcher; ERT = enzyme replacement therapy.

References

    1. Graziano A. C. E., Cardile V., Gene 2015, 555, 2. - PubMed
    1. Bradbury A. M., Bongarzone E. R., Sands M. S., Neurosci. Lett. 2021, 752, 135841. - PMC - PubMed
    1. Escolar M. L., West T., Dallavecchia A., Poe M. D., LaPoint K., J. Neurosci. Res. 2016, 94, 1118. - PubMed
    1. Metovic J., Li Y., Gong Y., Eichler F., Neurotherapeutics 2024, 21, 00443. - PMC - PubMed
    1. Heller G. J., Marshall M. S., Issa Y., Marshall J. N., Nguyen D., Rue E., Bongarzone E. R., Mol. Ther. 2021, 29, 1883. - PMC - PubMed

MeSH terms