. 2025 Aug 13;16(8):e0111925.
doi: 10.1128/mbio.01119-25. Epub 2025 Jul 1.

Deciphering cell cycle organization of Toxoplasma endodyogeny

Affiliations

Deciphering cell cycle organization of Toxoplasma endodyogeny

Mrinalini Batra et al. mBio. .

Abstract

In this study, we report the atypical cell cycle organization of the unicellular eukaryotic pathogen Toxoplasma gondii. The remarkably flexible cell division of T. gondii and other apicomplexan parasites differs considerably from the cell division modes employed by other model eukaryotes. In addition, there is a lack of recognizable cell cycle regulators, which has contributed to the difficulties in deciphering the order of events in the apicomplexan cell cycle. To aid in studies of the cell cycle organization of the T. gondii tachyzoite, we have created the Fluorescent Ubiquitination-based Cell Cycle Indicator probes, ToxoFUCCIS and ToxoFUCCISC. We introduced a DNA replication factor TgPCNA1 tagged with NeonGreen that can be used alone or in conjunction with an mCherry-tagged budding indicator TgIMC3 in the auxin-induced degradation parental strain. The varied localization and dynamic cell cycle oscillation have confirmed TgPCNA1 to be a suitable T. gondii FUCCI probe. The ToxoFUCCIS analysis showed that tachyzoite DNA replication starts at or near centromeric regions and has a bell-shaped dynamic and a significant degree of the cell cycle asynchrony within the vacuoles. Quantitative live and immunofluorescence microscopy analyses of ToxoFUCCIS and its derivatives co-expressing epitope-tagged cell cycle markers have revealed an unusual composite cell cycle phase that incorporates overlapping S, G2, mitosis, and cytokinesis (budding). We identified five intervals of the composite phase and their approximate duration: S (19%), S/G2/C (3%), S/M/C (9%), M/C (18%), and C/G1 (<1%). The ToxoFUCCIS probe efficiently detected G2/M and Spindle Assembly Checkpoints, as well as the SB505124-induced TgMAPK1-dependent block. Altogether, our findings showed an unprecedented complexity of the cell cycle in apicomplexan parasites.

Importance: The cell division rates directly correlate with the severity of the diseases caused by apicomplexan parasites. Despite its clinical importance, little is known about the apicomplexan cell cycle that controls parasite division rates. Previous studies implied that the apicomplexan cell cycle is organized differently from the cell cycle of their host cells. However, the order of cell cycle events had never been established. In the current study, we present evidence of the highly unusual organization of the Toxoplasma gondii cell cycle. Using a new cell cycle indicator, we measured the duration of individual cell cycle processes in Toxoplasma tachyzoites and revealed the unprecedented overlaps of four cell cycle phases. Our findings explain how the apicomplexan cell cycle accommodates the flexibility of the division modes and identify unique steps of the parasite survival program that can be explored in the future.

Keywords: Apicomplexa; Cdk-related kinase; FUCCI; PCNA1; Toxoplasma gondii; cell cycle.


Conflict of interest statement

The authors declare no conflict of interest.

Figures
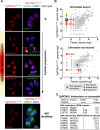
Fig 1
Fig 1
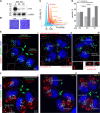
Chromatin-bound Toxoplasma PCNA1 interacts with DNA replication machinery. (A) Fluorescence microscopy analysis of TgPCNA1AID-HA expression in RHΔKu80TIR1 tachyzoites. The images show co-expression of TgPCNA1AID-HA and centrosome (α-Centrin1/α mouse IgG Fluor 568), or inner membrane complex (α-TgIMC1/α-rabbit IgG Fluor 568). Cell cycle phases were determined based on numbers and morphology of the relevant reference structures, as indicated with arrows. Note that centrosome duplication occurs early in S-phase, while separation of duplicated centrosomes takes place after S-phase is completed. Any potential background anomalies are the result of the imaging process. (B) Log2 values of protein spectra detected by mass-spectrometry analysis of TgPCNA1AID-HA complexes that were chromatin-bound or unbound are plotted on graphs. Different color dots represent categories of the selected TgPCNA1 interactors. Experiments were performed in two biological replicates. (C) Select a set of proteins interacting with chromatin-bound TgPCNA1. The SAINT scores represent the significance of interaction between the bait and prey, with score 1 being the highest probability of the proteins’ interaction. The fold change value represents the factor enrichment in TgPCNA1AID-HA isolated complexes compared to the similarly treated RHΔKu80TIR1 parental strain.
Fig 2
Fig 2
TgPCNA1 controls the progression of DNA replication in tachyzoites. (A) Western blot analysis of the total lysates of RHΔKu80TIR1 tachyzoites expressing TgPCNA1AID-HA. Lysates of non-treated parasites and parasites treated with 500 μM IAA for 30 or 90 minutes were analyzed. Western blots were probed with α-HA (α-rat IgG-HRP) and α-GRA7 (α-mouse IgG-HRP) to confirm equal loading of total lysates. (B) Images of stained HFF monolayers infected with RHΔKu80TIR1 TgPCNA1AID-HA tachyzoites grown with or without 500 µM IAA for 7 days. Only TgPCNA1-expressing tachyzoites (-IAA) formed viable plaques. The experiment was performed in three biological replicates. (C) FACScan analysis of DNA content obtained from parasites expressing TgPCNA1AID-HA (0, blue plot) or lacking TgPCNA1AID-HA for 4 hours (+IAA, red plot) and 7 hours (+IAA, orange plot). The results of one of three independent experiments are shown. Dashed lines indicate the prominent 1.8N DNA content peak. (D) Quantification of the G1 (single centrosome) and S/G2/M/budding (two centrosomes) populations. The TgPCNA1AID-HA-expressing and -deficient (4 and 7 hours with 500 μM IAA) parasites were co-stained with α-Centrin1, α-TgIMC1, and DAPI. 100 random parasite vacuoles were evaluated in three independent experiments. Mean ± SD values are plotted on the graphs. (E and F) Ultra-expansion microscopy analysis of RHΔKu80TIR1 TgPCNA1AID-HA-expressing (-IAA) and -deficient (+IAA) tachyzoites. The -IAA images designed “i” show the 8 h mock-treated parasites. The images of IAA-treated parasites are indicated with “ii” and “iii.” Centriole (cntl) counts and localization were evaluated by Centrin1 (α-Centrin/α-mouse IgG Fluor 568) stain. Tubulin A (α-TubulinA/α-mouse IgG Fluor 568) stains subpellicular MTs (daughter cell scaffold, DCS) and centrioles (spindle poles). TgMORN1 (α-MORN1/α-rabbit IgG Fluor 488) staining shows changes in morphology of the centrocone and the number of daughter basal complexes (dBC). Nuclei stained with DAPI (blue). The experiment was performed in three biological replicates. Any potential background anomalies are the result of the imaging process.
Fig 3
Fig 3
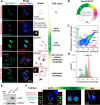
Characterizing the ToxoFUCCI probes. (A) Fluorescence microscopy analysis of TgPCNA1NG expression in RHΔKu80TIR1 tachyzoites. Images show immunofluorescence co-expression of TgPCNA1NG and markers for centrosome (α-Centrin1/α mouse IgG Fluor 568), centrocone (α-TgMORN1/α-rabbit IgG Fluor 568), or apical cone (α-TgISP1/α mouse IgG Fluor 568). The guide panel depicts the marker used in gray. Any potential background anomalies are the result of the imaging process. Cell cycle phases were determined based on the numbers and morphology of the relevant reference structures, as indicated with arrows. (B) Schematics of the tachyzoite cell cycle showing the temporal expression of ToxoFUCCISC fluorophores. (C and D) Flow cytometry analysis of ToxoFUCCISC expressing TgPCNA1NG and TgIMC3mCh. The plot (C) shows the distribution of populations differentially expressing TgPCNA1NG (green) and TgIMC3mCh (red). Cell cycle phases were predicted based on the relative expression of ToxoFUCCISC markers. Data were analyzed using FlowJo, and the results of one of three independent experiments are shown. The plot (D) shows a correlation between the number of cells (events) and expression of the ToxoFUCCISC markers. (E) Western blot analysis of total lysates of the parental RHΔKu80TIR1 and ToxoFUCCIS tachyzoites. Membranes were probed with α-NeonGreen (α-rabbit IgG-HRP) to detect TgPCNA1NG expression and α-GRA7 (α-mouse IgG-HRP) to confirm equal loading of the total lysates. (F) Immunofluorescent microscopy analysis of ToxoFUCCIS tachyzoites expressing inner kinetochore marker TgCenP-CAID-HA. Parasites were stained with α-HA (α-rat IgG Fluor 568) antibody to detect TgCenP-CAID-HA in the first replication forks (TgPCNA1NG). Any potential background anomalies are the result of the imaging process. Colocalization of the markers is shown in the enlarged images on the side. Images of individual markers are included in Fig. S2.
Fig 4
Fig 4
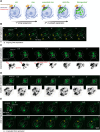
Real-time dynamic of DNA replication in tachyzoites. (A) Schematics of the DNA replication initiation. (B) The beginning of DNA replication. Images of the ToxoFUCCIS probe were taken every 30 seconds. The arrow indicates the development of the first replication aggregate. (C) Expansion of DNA replication forks. Images show changes in the ring-like structure of the replication aggregates. (D) The middle of DNA replication. The images show the dynamic rearrangements of the replication foci that were recorded for 3 minutes. (E) The end of DNA replication. The series of images depicts the offset of DNA replication (last focus). Note the basal position of the nucleus and conoidal accumulation of ToxoFUCCIS probe in parasites completing DNA replication.
Fig 5
Fig 5
The intravacuolar asynchrony of the tachyzoite cell cycle. (A) Images of ToxoFUCCIS parasites expressing the kinetochore marker TgCenP-CAID-HA during early, mid-, and late DNA replication. Representative images of the first three intravacuolar divisions are shown. Stars indicate parasites undergoing DNA replication. The number on the top is an average of the vacuoles containing asynchronous parasites. The schematic on the left shows the periods of the cell cycle represented in the images. The panel of enlarged images on the right depicts different stages of DNA replication in four parasites from the same vacuole. Note that replication starts around centromeres (kinetochores) and moves away from centromeres as it progresses to the middle stages. Any potential background anomalies are the result of the imaging process. (B) Quantifications of intravacuolar cell cycle asynchrony in parasites beginning (first replication dot) and completing (last replication dot) DNA replication. 100 random vacuoles of the indicated size containing parasites actively replicating DNA (aggregated TgPCNA1NG) were examined in three independent experiments. Asynchronous vacuoles contained at least one parasite lacking aggregated TgPCNA1NG. Mean ± SD values are plotted on the graph. (C) Quantifications of intravacuolar asynchrony across the entire cell cycle. 100 random vacuoles of the indicated size were examined in three independent experiments. Asynchronous vacuoles contained at least one parasite lacking aggregated TgPCNA1NG. Mean ± SD values are plotted on the graph. (D) Distribution of vacuole size of the ToxoFUCCIS parasites and their parental strain, asynchronously grown for 24 hours. The number of parasites per vacuole (shown on the right of the graph) was quantified in a minimum of 300 random vacuoles in three independent experiments. Mean ± SD values are plotted on the graph.
Fig 6
Fig 6
Organization of the T. gondii tachyzoite cell cycle. (A) Immunofluorescence microscopy images of TgPCNA1NG (green) and selected cell cycle markers (red) visualized with antibodies against Centrin1 (α-mouse IgG Fluor 568), TgMORN1 (α-rabbit IgG Fluor 568), and myc-epitope (α-rabbit IgG Fluor 568). Images are aligned with the corresponding cell cycle intervals shown in panel B. Green double-head arrows show temporal TgPCNA1 expression in replication foci and on the conoid. Any potential background anomalies are the result of the imaging process. (B) Schematic representation of cell cycle phases and intervals inferred from quantitative microscopy analyses of the ToxoFUCCIS line and its derivatives. The numbers on the top reflect the duration of the intervals in minutes (assuming the division cycle takes 7 h) and as a percentage of total time. Dotted lines indicate the putative location of the event. The processes representing conventional cell cycle phases are labeled and shown in green. The red hexagonal signs mark the positions of known checkpoints. (C) Key events of the composite cell cycle phase. Temporal order was deduced by quantitative microscopy analyses or published studies. (D) Table summarizing the approaches used to identify mitotic subphases. The aggregated TgPCNANG is characteristic of the prophase of mitosis. The TgMORN1-positive centrocone is resolved into two structures at the metaphase-to-anaphase transition. Nuclear division or karyokinesis is completed in telophase.
Fig 7
Fig 7
The ToxoFUCCI approach identifies cell cycle checkpoints. (A) Schematic representation of cell cycle phases shows the changes in tachyzoite populations conditionally arrested at the indicated checkpoints. (B and F) Immunofluorescence microscopy images of ToxoFUCCIS +TgCrk4AID-HA (B) and ToxoFUCCIS +TgCrk6AID-HA (F) parasites treated with 500 μM auxin for 7 hours. Any potential background anomalies are the result of the imaging process. (C and G) Quantification of the vacuoles of ToxoFUCCIS +TgCrk4AID-HA (C) and ToxoFUCCIS +TgCrk6AID-HA (G) tachyzoites containing aggregated TgPCNA1NG. 100 random vacuoles were examined in three independent experiments. Mean ± SD values are plotted on the graph. (D and H) FACScan analysis of DNA content obtained from ToxoFUCCIS parasites expressing (0, blue plots) or lacking +TgCrk4AID-HA (D) and TgCrk6AID-HA (H) for 4 hours (+IAA, red plot) and 7 hours (+IAA, orange plot). The results of one of three independent experiments are shown. Dashed lines indicate the prominent 1.8N DNA content peak. (E) Flow cytometry analysis of ToxoFUCCIS +TgCrk4AID-HA and ToxoFUCCIS +TgCrk6AID-HA tachyzoites grown under the indicated conditions. Plots show changes in TgPCNA1NG expression and DNA content (PI). Data were analyzed in FlowJo10.10, and the results of one of three independent experiments are shown.
Fig 8
Fig 8
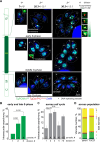
Mapping TgMAPK1-mediated cell cycle arrest using ToxoFUCCIS model. (A) Immunofluorescence microscopy images of ToxoFUCCIS tachyzoites with or without 3 μM SB505124 treatment for 7 hours, and ToxoFUCCIS +TgMAPK1AID-HA parasites with 500 μM auxin treatment for 7 hours. Centrosomes were visualized with antibodies targeting Centrin1 (α-mouse IgG Fluor 568). Green fluorescence indicates aggregated and conoidal TgPCNA1NG. Blue DAPI stain shows the number of nuclei per cell. (B) FACScan analysis of DNA content of ToxoFUCCIS parasites with mock treatment (blue plot) or 4 hours (red plot) and 7 hours (orange plot) of treatment with 3 μM SB505124. The results of one of three independent experiments are shown. Dashed lines indicate the prominent 1.8N DNA content peak. (C) Quantification of ToxoFUCCIS parasites containing aggregated TgPCNA1NG with mock treatment, or after 4 and 7 hours of 3 μm SB505124 treatment. 500 individual parasites were examined in three independent experiments. Mean ± SD values are plotted on the graph. (D) Quantification of ToxoFUCCIS parasites with two nuclei per cell with mock treatment or after 4 and 7 hours of treatment with 3 μm SB505124. The graph shows the distribution of non-DNA replicating parasites undergoing budding (blue bar), parasites with two nuclei containing aggregated TgPCNA1NG (light green), and parasites with one or two nuclei undergoing DNA replication (dark green). 500 individual parasites were examined in three independent experiments. Mean ± SD values are plotted on the graph. (E) Quantification of budding ToxoFUCCIS parasites after mock treatment, or 4 and 7 hours of 3 μm SB505124 treatment. The abnormal budding fraction encompasses parasites containing more or less than 2 buds per cell and altered bud polarity. 500 individual parasites were examined in three independent experiments. Mean ± SD values are plotted on the graph. (F) Quantification of budding ToxoFUCCIS parasites showing parallel or anti-parallel bud orientation of the buds after mock treatment, or 4 and 7 hours of 3 μm SB505124 treatment. 500 individual parasites were examined in three independent experiments. Mean ± SD values are plotted on the graph. (G) Ultra-expansion microscopy analysis of ToxoFUCCIS tachyzoites with mock treatment and 3 μM SB505124 treatment for 7 hours. Tubulin A (α-TubulinA/α-mouse IgG Fluor 568) stain shows mother and daughter cells’ subpellicular MTs (daughter cell scaffold, DCS). TgMORN1 (α-MORN1/α-rabbit IgG Fluor 488) stain shows the number of daughter basal complexes (dBC). Nuclei stained with DAPI (nc, blue). The experiment was performed in three biological replicates. (H) Schematic representation of the tachyzoite cell cycle. Red lines mark the cell cycle processes that are affected by the SB505124 compound. The flathead line indicates inhibition, and the arrowhead line indicates the promoted process.
Fig 9
Fig 9
Organization of the conventional cell cycle and the endodygenic cycle of T. gondii tachyzoites. The schematic on the left shows four phases of the conventional cell cycle that do not overlap. Cytokinesis occupies a fraction of mitotic telophase. On the contrary, four different cell cycle phases run concurrently within the composite cell cycle phase of T. gondii tachyzoites. Despite drastic differences in cell cycle organization, Toxoplasma endodyogeny preserved three major cell cycle checkpoints (red stop symbol).

References

    1. Francia ME, Striepen B. 2014. Cell division in apicomplexan parasites. Nat Rev Microbiol 12:125–136. doi: 10.1038/nrmicro3184 - DOI - PubMed
    1. Gubbels MJ, White M, Szatanek T. 2008. The cell cycle and Toxoplasma gondii cell division: tightly knit or loosely stitched? Int J Parasitol 38:1343–1358. doi: 10.1016/j.ijpara.2008.06.004 - DOI - PubMed
    1. White MW, Suvorova ES. 2018. Apicomplexa cell cycles: something old, borrowed, lost, and new. Trends Parasitol 34:759–771. doi: 10.1016/j.pt.2018.07.006 - DOI - PMC - PubMed
    1. Alvarez CA, Suvorova ES. 2017. Checkpoints of apicomplexan cell division identified in Toxoplasma gondii. PLoS Pathog 13:e1006483. doi: 10.1371/journal.ppat.1006483 - DOI - PMC - PubMed
    1. Hawkins LM, Naumov AV, Batra M, Wang C, Chaput D, Suvorova ES. 2022. Novel CRK-cyclin complex controls spindle assembly checkpoint in Toxoplasma endodyogeny. mBio 13:e0356121. doi: 10.1128/mbio.03561-21 - DOI - PMC - PubMed

Substances

LinkOut - more resources