

A manganese metabolism-related gene signature stratifies prognosis and immunotherapy efficacy in kidney cancer
- PMID: 40591061
- PMCID: PMC12214139
- DOI: 10.1007/s12672-025-03050-9
A manganese metabolism-related gene signature stratifies prognosis and immunotherapy efficacy in kidney cancer
Abstract
Background: Manganese modulates tumorigenesis and immune regulation. High levels of manganese may promote cancer progression. While manganese toxicity causes renal tubular damage and chronic impairment, its association with kidney cancer remains poorly understood.
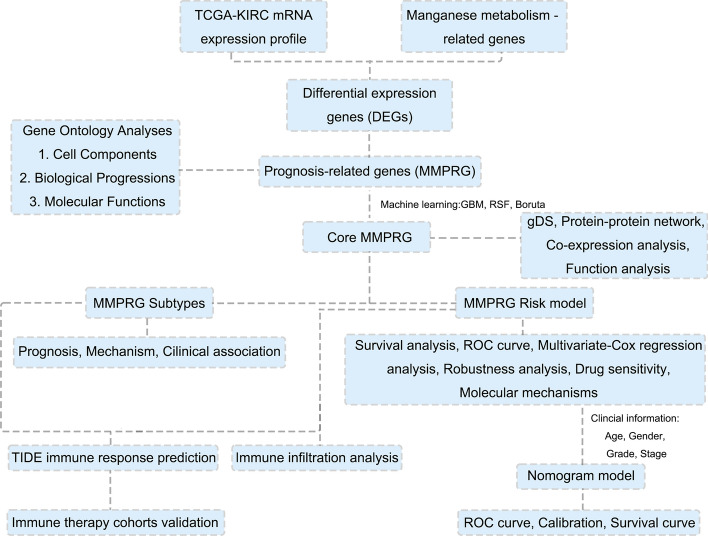
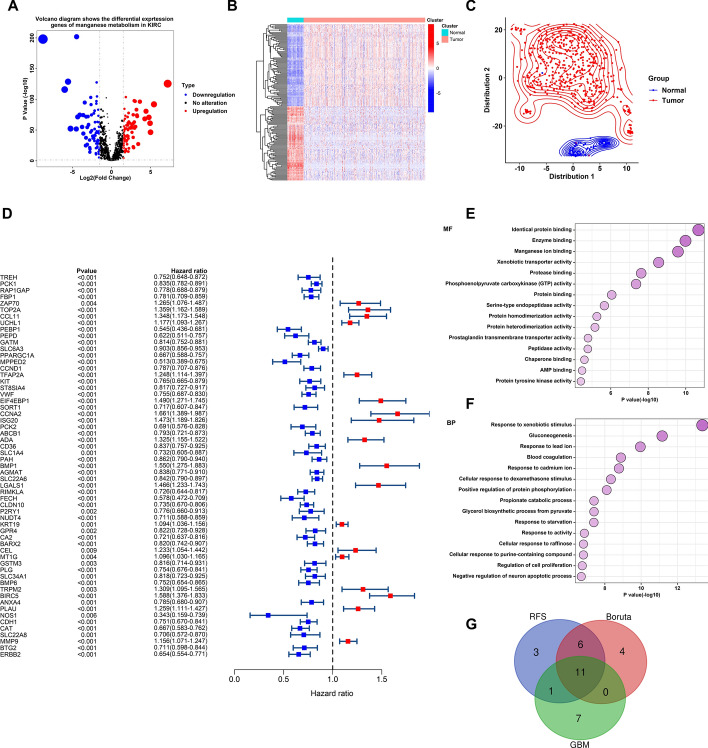
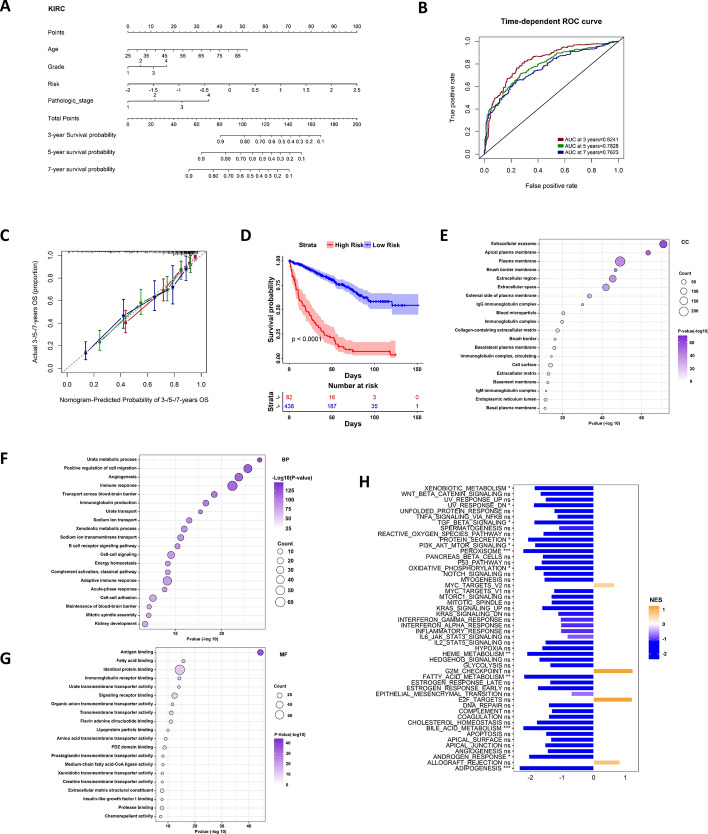
Methods: We systematically analyzed manganese metabolism genes in KIRC using the TCGA dataset. Through integrated bioinformatics approaches, including differential expression analysis, univariate Cox regression, and three machine learning algorithms (Boruta, GBM, and RFS), we identified prognosis-related MMCG. The Ward.D2 method was used to identify MMCG subtypes, while Lasso-cox regression analysis was performed to establish the MMCG risk model. The predictive performance was validated through time-dependent ROC analysis, calibration curves, and decision curve analysis.
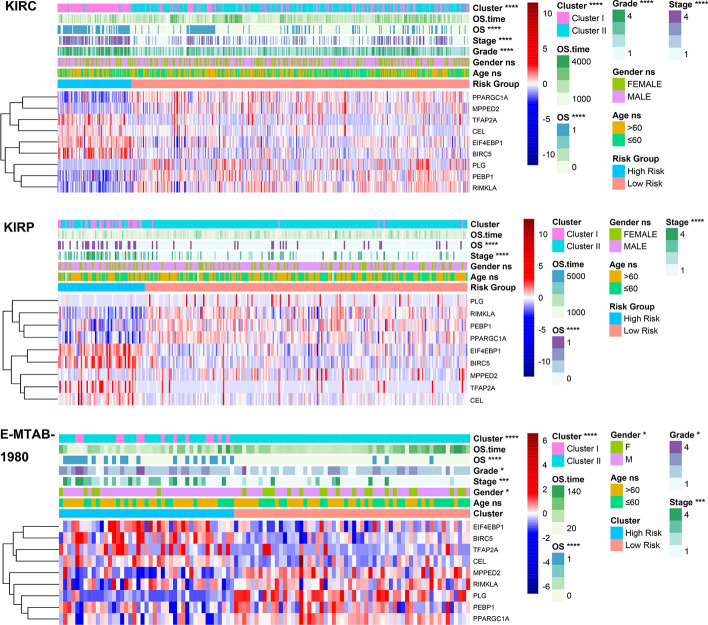
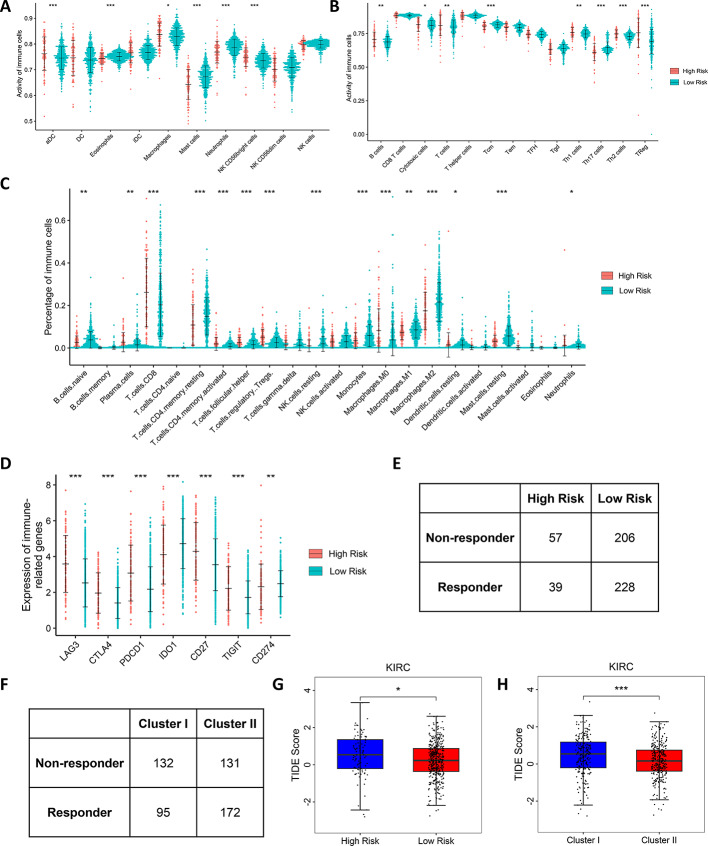
Results: We identified 11 prognosis-related manganese metabolism core genes (MMCGs). KIRC patients were stratified into two clusters based on MMCG expression levels. Patients in Cluster I showed poorer outcomes, which were associated with tumour progression. The MMCG risk score was subsequently developed using LASSO-Cox regression analysis, and patients were classified into high- and low-risk groups. Survival analysis revealed that the outcomes of high-risk group patients were poorer than those of the low-risk group. Univariate and multivariate analyses confirmed the MMCG risk score as an independent prognostic biomarker. Pathway enrichment analysis showed differential enrichment of immune and metabolic pathways across subtypes and risk groups. We constructed a clinical nomogram incorporating the MMCG risk score and other clinical parameters, which demonstrated highly accurate predictive capabilities. Immune infiltration analysis and immune therapy response predictions indicated that patients in Cluster I and the high-risk group showed low responses to immune therapy.
Conclusion: Our findings provide a basis for clinical stratification strategies and future research on manganese-based interventions for renal cell carcinoma (RCC).
Keywords: Machine learning; Manganese metabolism; RCC; Risk signature; Subtype.
© 2025. The Author(s).
Conflict of interest statement
Declarations. Ethics, approval and consent to participate: Not applicable. Consent for publication: Not applicable. Competing interests: The authors declare no competing interests.
Figures


Similar articles
-
Development and Validation of Anoiki-Related Lncrna Signature Prediction Model for KIRC Prognosis.Comb Chem High Throughput Screen. 2025;28(9):1524-1542. doi: 10.2174/0113862073271880231114100544. Comb Chem High Throughput Screen. 2025. PMID: 38305400
-
Bioinformatics identification and validation of m6A/m1A/m5C/m7G/ac4 C-modified genes in oral squamous cell carcinoma.BMC Cancer. 2025 Jul 1;25(1):1055. doi: 10.1186/s12885-025-14216-7. BMC Cancer. 2025. PMID: 40597017 Free PMC article.
-
Impact of residual disease as a prognostic factor for survival in women with advanced epithelial ovarian cancer after primary surgery.Cochrane Database Syst Rev. 2022 Sep 26;9(9):CD015048. doi: 10.1002/14651858.CD015048.pub2. Cochrane Database Syst Rev. 2022. PMID: 36161421 Free PMC article.
-
Cost-effectiveness of using prognostic information to select women with breast cancer for adjuvant systemic therapy.Health Technol Assess. 2006 Sep;10(34):iii-iv, ix-xi, 1-204. doi: 10.3310/hta10340. Health Technol Assess. 2006. PMID: 16959170
-
Computed tomography-based radiomics predicts prognostic and treatment-related levels of immune infiltration in the immune microenvironment of clear cell renal cell carcinoma.BMC Med Imaging. 2025 Jul 1;25(1):213. doi: 10.1186/s12880-025-01749-3. BMC Med Imaging. 2025. PMID: 40596969 Free PMC article.
References
-
- Sung H, Ferlay J, Siegel RL, Laversanne M, Soerjomataram I, Jemal A, Bray F. Global cancer statistics 2020 GLOBOCAN estimates of incidence and mortality worldwide for 36 cancers in 185 countries. CA Cancer J Clin. 2021;71(3):209–49. - PubMed
-
- Humphrey PA, Moch H, Cubilla AL, Ulbright TM, Reuter VE. The 2016 WHO classification of tumours of the urinary system and male genital organs-part b: prostate and bladder tumours. Eur Urol. 2016;70(1):106–19. - PubMed
-
- Barata PC, Rini BI. Treatment of renal cell carcinoma current status and future directions. CA Cancer J Clin. 2017;67(6):507–24. - PubMed
LinkOut - more resources
Full Text Sources