

Pattern Formation as a Resilience Mechanism in Cancer Immunotherapy
- PMID: 40591070
- PMCID: PMC12214011
- DOI: 10.1007/s11538-025-01485-3
Pattern Formation as a Resilience Mechanism in Cancer Immunotherapy
Abstract
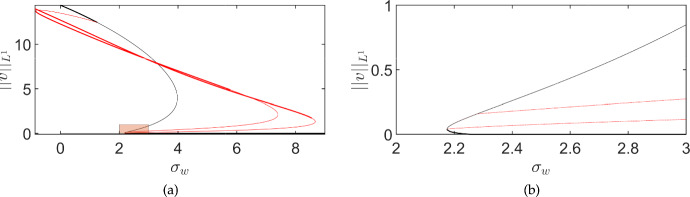
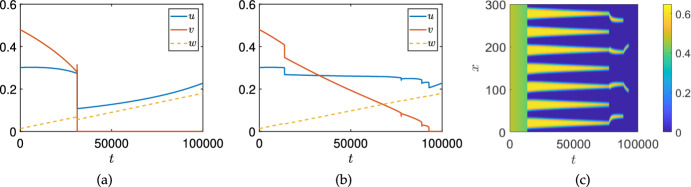
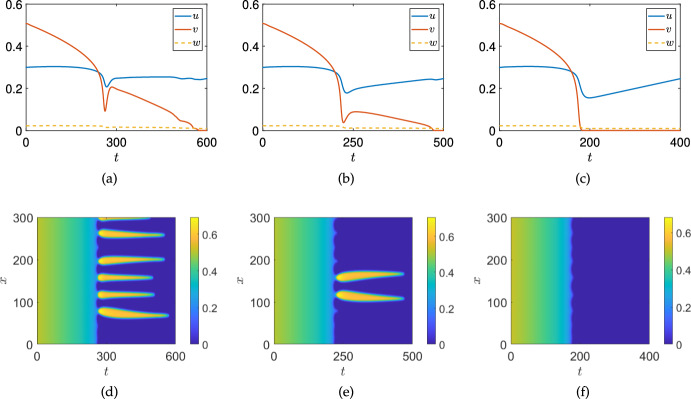
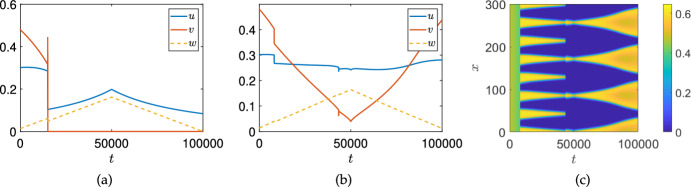
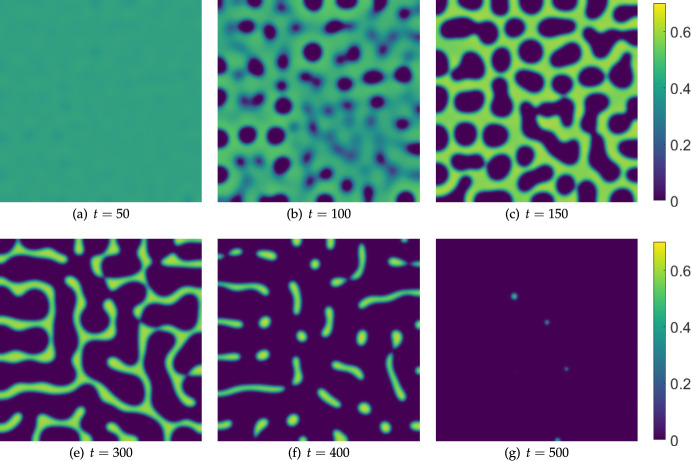
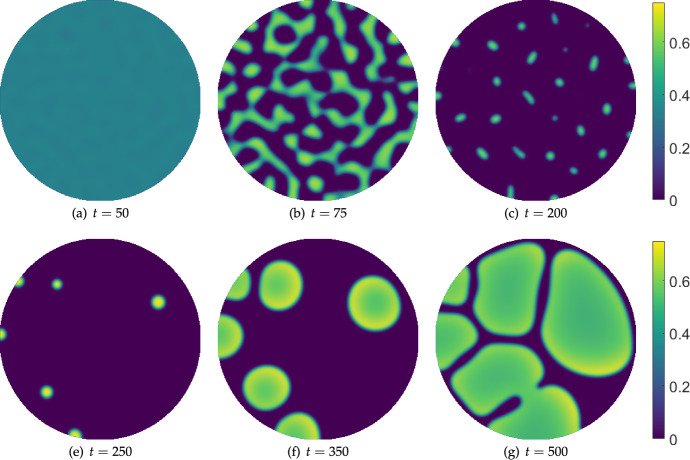
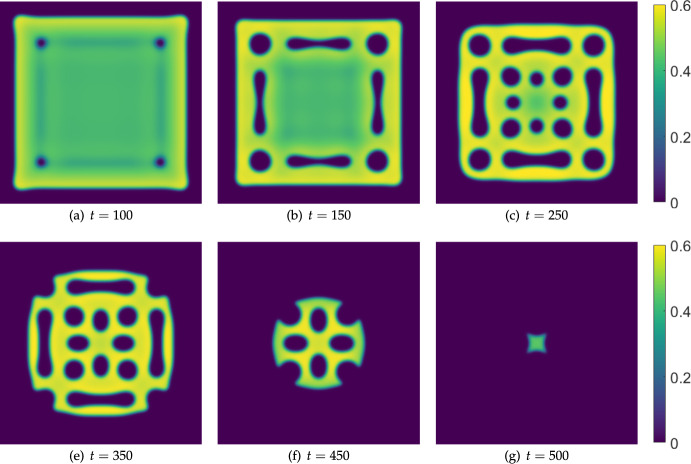
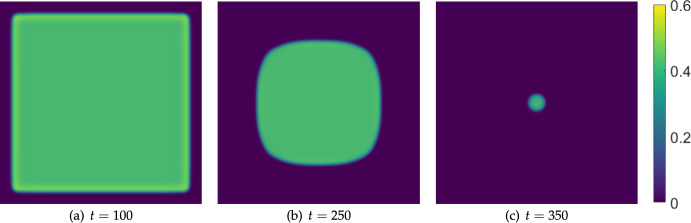
Mathematical and computational modelling in oncology has played an increasingly important role in not only understanding the impact of various approaches to treatment on tumour growth, but in optimizing dosing regimens and aiding the development of treatment strategies. However, as with all modelling, only an approximation is made in the description of the biological and physical system. Here we show that tissue-scale spatial structure can have a profound impact on the resilience of tumours to immunotherapy using a classical model incorporating IL-2 compounds and effector cells as treatment parameters. Using linear stability analysis, numerical continuation, and direct simulations, we show that diffusing cancer cell populations can undergo pattern-forming (Turing) instabilities, leading to spatially-structured states that persist far into treatment regimes where the corresponding spatially homogeneous systems would uniformly predict a cancer-free state. These spatially-patterned states persist in a wide range of parameters, as well as under time-dependent treatment regimes. Incorporating treatment via domain boundaries can increase this resistance to treatment in the interior of the domain, further highlighting the importance of spatial modelling when designing treatment protocols informed by mathematical models. Counter-intuitively, this mechanism shows that increased effector cell mobility can increase the resilience of tumours to treatment. We conclude by discussing practical and theoretical considerations for understanding this kind of spatial resilience in other models of cancer treatment, in particular those incorporating more realistic spatial transport. This paper belongs to the special collection: Problems, Progress and Perspectives in Mathematical and Computational Biology.
Keywords: Immunotherapy; Pattern Formation; Resilience; Solid Tumours.
© 2025. The Author(s).
Figures
Similar articles
-
Short-Term Memory Impairment.2024 Jun 8. In: StatPearls [Internet]. Treasure Island (FL): StatPearls Publishing; 2025 Jan–. 2024 Jun 8. In: StatPearls [Internet]. Treasure Island (FL): StatPearls Publishing; 2025 Jan–. PMID: 31424720 Free Books & Documents.
-
A rapid and systematic review of the clinical effectiveness and cost-effectiveness of paclitaxel, docetaxel, gemcitabine and vinorelbine in non-small-cell lung cancer.Health Technol Assess. 2001;5(32):1-195. doi: 10.3310/hta5320. Health Technol Assess. 2001. PMID: 12065068
-
Comparison of Two Modern Survival Prediction Tools, SORG-MLA and METSSS, in Patients With Symptomatic Long-bone Metastases Who Underwent Local Treatment With Surgery Followed by Radiotherapy and With Radiotherapy Alone.Clin Orthop Relat Res. 2024 Dec 1;482(12):2193-2208. doi: 10.1097/CORR.0000000000003185. Epub 2024 Jul 23. Clin Orthop Relat Res. 2024. PMID: 39051924
-
The Black Book of Psychotropic Dosing and Monitoring.Psychopharmacol Bull. 2024 Jul 8;54(3):8-59. Psychopharmacol Bull. 2024. PMID: 38993656 Free PMC article. Review.
-
Sexual Harassment and Prevention Training.2024 Mar 29. In: StatPearls [Internet]. Treasure Island (FL): StatPearls Publishing; 2025 Jan–. 2024 Mar 29. In: StatPearls [Internet]. Treasure Island (FL): StatPearls Publishing; 2025 Jan–. PMID: 36508513 Free Books & Documents.
References
-
- Ahmed R, Augustine R, Valera E, Ganguli A, Mesaeli N, Ahmad IS, Bashir R, Hasan A (2022) Spatial mapping of cancer tissues by omics technologies. Biochimica et Biophysica Acta (BBA)-Reviews on Cancer, 1877 (1): 188663 - PubMed
-
- Allison E, Colton A, Gorman A, Kurt R, Shainheit M (2004) A mathematical model of the effector cell response to cancer. Math Comput Model 39(11–12):1313–1327
-
- Altrock PM, Liu LL, Michor F (2015) The mathematics of cancer: integrating quantitative models. Nat Rev Cancer 15(12):730–745 - PubMed
-
- Andasari V, Gerisch A, Lolas G, South AP, Chaplain MAJ (2011) Mathematical modeling of cancer cell invasion of tissue: biological insight from mathematical analysis and computational simulation. J Math Biol 63:141–171 - PubMed
-
- Anderson ARA, Chaplain MAJ (1998) Continuous and discrete mathematical models of tumor-induced angiogenesis. Bull Math Biol 60(5):857–899 - PubMed
MeSH terms
Substances
Grants and funding
LinkOut - more resources
Full Text Sources
Medical
