

The multi-omics analysis identifies a novel endoplasmic reticulum stress and immune related genes signature in lung adenocarcinoma
- PMID: 40591103
- PMCID: PMC12214066
- DOI: 10.1007/s12672-025-03033-w
The multi-omics analysis identifies a novel endoplasmic reticulum stress and immune related genes signature in lung adenocarcinoma
Abstract
Background: Lung adenocarcinoma (LUAD), a prevalent and aggressive malignancy, necessitates improved prognostic tools and therapeutic insights. While endoplasmic reticulum stress (ERS) and tumor-immune interactions are recognized as key cancer hallmarks, their combined prognostic potential in LUAD remains insufficiently explored.
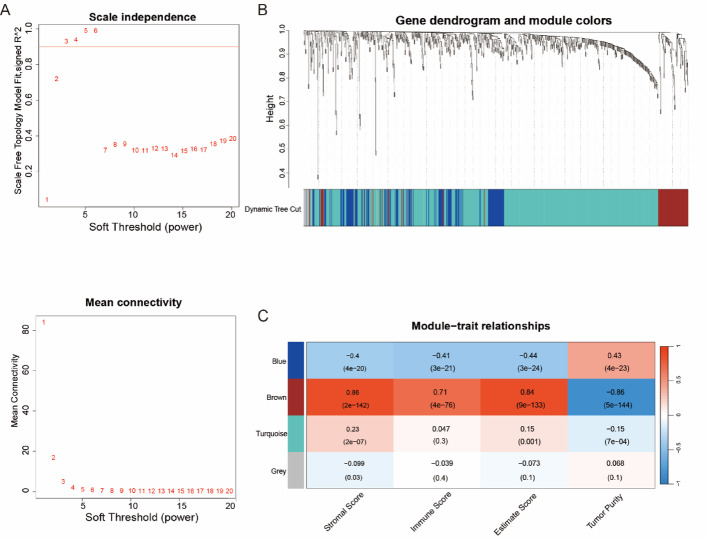
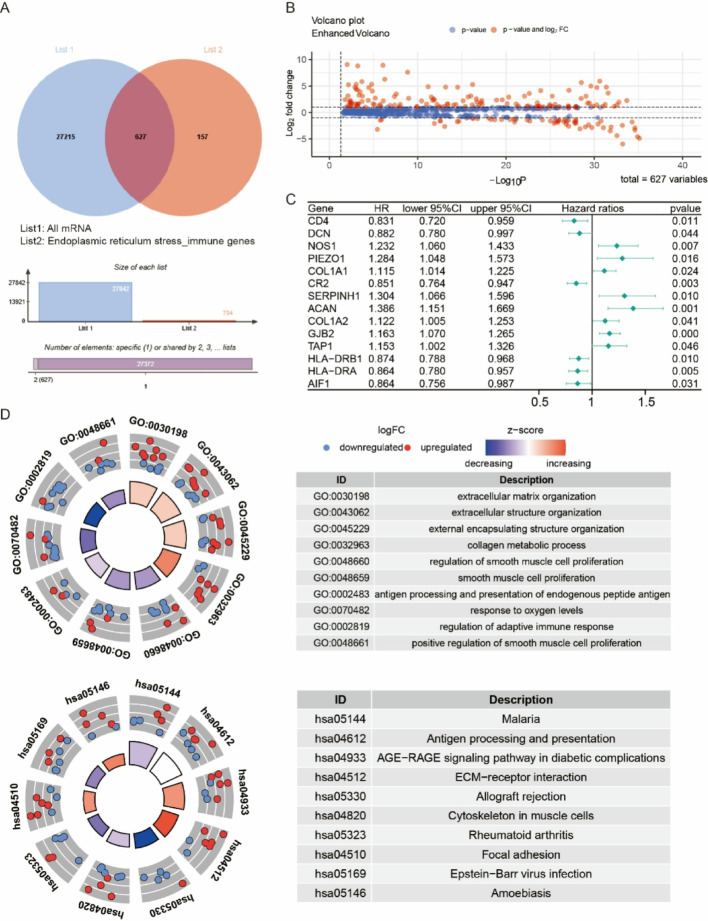
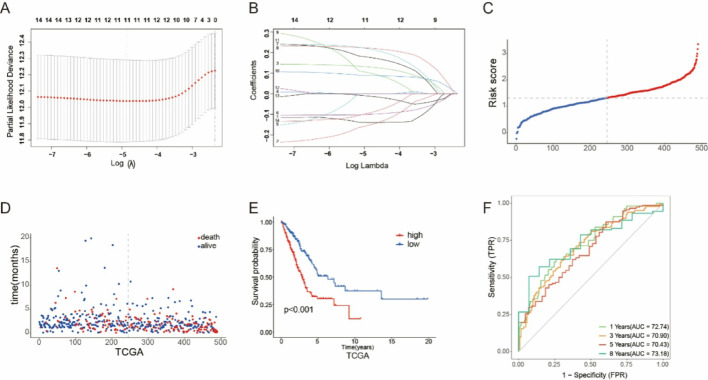
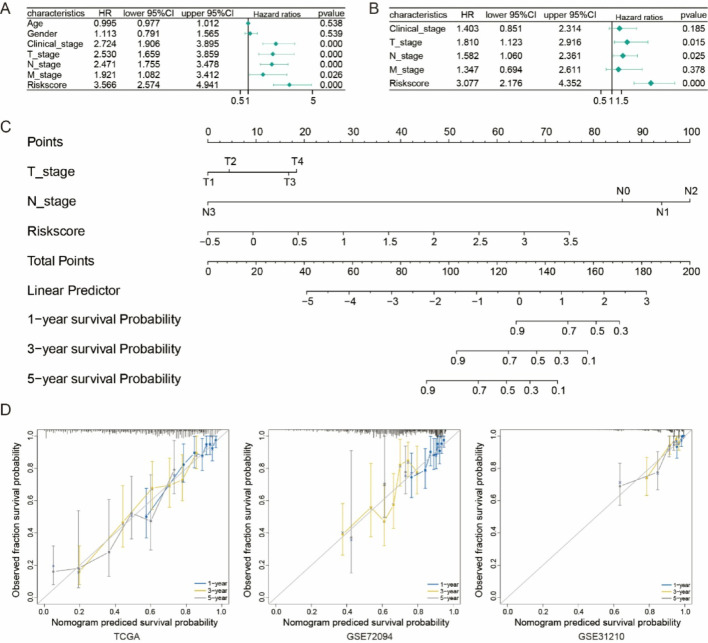
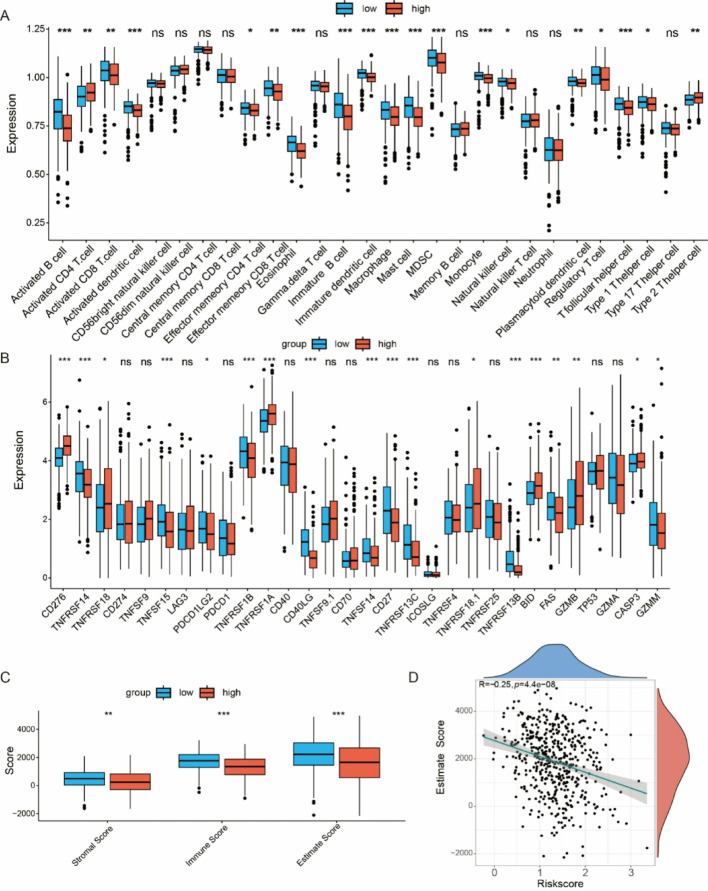
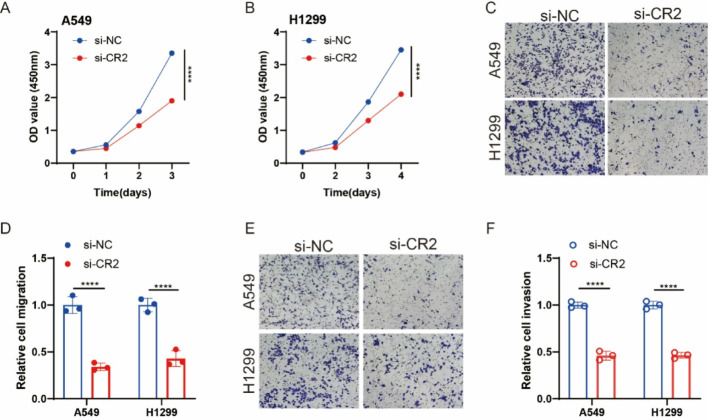
Methods: Utilizing transcriptomic and clinical data from the TCGA-LUAD cohort, we developed an ERS-immune prognostic signature through Least Absolute Shrinkage and Selection Operator algorithm. A clinical nomogram integrating risk scores with established prognostic factors was established. Tumor microenvironment characteristics were evaluated using the CIBERSORT and ESTIMATE algorithm. The changes following the CR2 gene knockdown in NSCLC cells were evaluated through CCK-8 assay and Transwell assays.
Results: The 10-gene signature effectively stratified patients into distinct risk groups with significant survival differences. The nomogram demonstrated enhanced predictive accuracy compared to traditional staging systems. High-risk patients exhibited immunosuppressive features. CR2 knockdown significantly reduced cellular proliferation and inhibited metastatic capacity.
Conclusion: This integrated ERS-immune signature provides clinically relevant prognostic stratification and reveals potential therapeutic vulnerabilities in LUAD, offering a framework for personalized treatment strategies.
Keywords: Endoplasmic reticulum stress; Immune microenvironment; LASSO; Lung adenocarcinoma; Prognostic.
© 2025. The Author(s).
Conflict of interest statement
Declarations. Ethics approval: This study did not involve human participants, animal experiments, or data requiring ethical approval. Competing interests: The authors declare no competing interests.
Figures
Similar articles
-
Unraveling the role of GPCR signaling in metabolic reprogramming and immune microenvironment of lung adenocarcinoma: a multi-omics study with experimental validation.Front Immunol. 2025 Jun 6;16:1606125. doi: 10.3389/fimmu.2025.1606125. eCollection 2025. Front Immunol. 2025. PMID: 40547013 Free PMC article.
-
Identification and validation of a KRAS-macrophage-associated gene signature as prognostic biomarkers and potential therapeutic targets in melanoma.Front Immunol. 2025 Jun 18;16:1566432. doi: 10.3389/fimmu.2025.1566432. eCollection 2025. Front Immunol. 2025. PMID: 40607411 Free PMC article.
-
Prognostic model of lung adenocarcinoma based on disulfidptosis-related genes and analysis of in vitro cell experiments for PPP1R14B in the model.Biol Direct. 2025 Jul 1;20(1):74. doi: 10.1186/s13062-025-00662-7. Biol Direct. 2025. PMID: 40598552 Free PMC article.
-
Cost-effectiveness of using prognostic information to select women with breast cancer for adjuvant systemic therapy.Health Technol Assess. 2006 Sep;10(34):iii-iv, ix-xi, 1-204. doi: 10.3310/hta10340. Health Technol Assess. 2006. PMID: 16959170
-
Systemic pharmacological treatments for chronic plaque psoriasis: a network meta-analysis.Cochrane Database Syst Rev. 2021 Apr 19;4(4):CD011535. doi: 10.1002/14651858.CD011535.pub4. Cochrane Database Syst Rev. 2021. Update in: Cochrane Database Syst Rev. 2022 May 23;5:CD011535. doi: 10.1002/14651858.CD011535.pub5. PMID: 33871055 Free PMC article. Updated.
References
-
- Siegel RL, Miller KD, Wagle NS, Jemal A. Cancer statistics, 2023. CA Cancer J Clin. 2023;73(1):17–48. - PubMed
-
- Nasim F, Sabath BF, Eapen GA. Lung Cancer. Med Clin North Am. 2019;103(3):463–73. - PubMed
-
- de Sousa VML, Carvalho L. Heterogeneity in lung Cancer. Pathobiology. 2018;85(1–2):96–107. - PubMed
LinkOut - more resources
Full Text Sources