. 2025 Jul 1;10(15):e182578.
doi: 10.1172/jci.insight.182578. eCollection 2025 Aug 8.

Impaired AMPK control of alveolar epithelial cell metabolism promotes pulmonary fibrosis

Affiliations

Impaired AMPK control of alveolar epithelial cell metabolism promotes pulmonary fibrosis

Luis R Rodríguez et al. JCI Insight. .

Abstract

Alveolar epithelial type II (AT2) cell dysfunction is implicated in the pathogenesis of familial and sporadic idiopathic pulmonary fibrosis (IPF). We previously demonstrated that expression of an AT2 cell-exclusive disease-associated protein isoform (SP-CI73T) in murine and patient-specific induced pluripotent stem cell-derived (iPSC-derived) AT2 cells leads to a block in late macroautophagy and promotes time-dependent mitochondrial impairments; however, how a metabolically dysfunctional AT2 cell results in fibrosis remains elusive. Here, using murine and human iPSC-derived AT2 cell models expressing SP-CI73T, we characterize the molecular mechanisms governing alterations in AT2 cell metabolism that lead to increased glycolysis, decreased mitochondrial biogenesis, disrupted fatty acid oxidation, accumulation of impaired mitochondria, and diminished AT2 cell progenitor capacity manifesting as reduced AT2 cell self-renewal and accumulation of transitional epithelial cells. We identify deficient AMPK signaling as a critical component of AT2 cell dysfunction and demonstrate that targeting this druggable signaling hub can rescue the aberrant AT2 cell metabolic phenotype and mitigate lung fibrosis in vivo.

Keywords: Adult stem cells; Fibrosis; Metabolism; Mitochondria; Pulmonology.


Figures

Figure 1
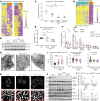
Figure 1. Increased glycolysis in murine AT2 cells expressing SftpcI73T.
(A) Unsupervised hierarchical clustering (Euclidean) heatmap of differentially expressed genes (DEGs; fold-change [FC] > 1.5; false discovery rate [FDR] < 0.05) in AT2I73T cells 3 days and 14 days after in vivo tamoxifen induction (n = 4 per group) versus AT2WT cells (age-matched C57B6/J mice, n = 8 by popRNA-Seq). A subset of DEGs is highlighted. STRING network analysis shows downregulation of genes associated with primary metabolic processes and lipid metabolism and upregulation of genes associated with proliferation and ECM organization in AT2I73T cells. (B) Reactome pathway analysis of DEGs in AT2I73T cells at 3 days and 14 days after tamoxifen induction demonstrates differential regulation of multiple metabolic pathways. (C) Schematic of rate-limiting enzymes in glycolysis pathway and individual graphs of normalized popRNA-Seq counts for highlighted genes in 3-day and 14-day AT2I73T and AT2WT cells. (D) Western blot of AT2WT and AT2I73T cells at peak of inflammation (14 days) and fibrosis (28 days) with densitometric quantification (mean±SEM; n = 3 biological replicates) showing differential LDHA and LDHB protein abundance. (E) Extracellular lactate and glucose concentrations (μM) in 48-hour ex vivo cultures of AT2I73T cells (28 days after in vivo tamoxifen) and AT2WT cells, measured by YSI biochemistry analyzer and normalized to total protein content (mean±SEM; n = 3 or 4 biological replicates). (F) Intracellular glucose, lactate, and pyruvate concentrations from 40,000 flow-sorted AT2 cells, reported as ratios to WT mean concentration (mean±SEM; n = 4 biological replicates). *P < 0.05, **P < 0.005, ***P < 0.0005, ****P < 0.00005 by ordinary 1-way ANOVA.
Figure 2
Figure 2. Defects in mitochondrial biogenesis and mitochondrial dynamics.
(A) Unsupervised hierarchical clustering (Euclidean) heatmap of DEGs (FDR < 0.05) in the Hallmark PPAR signaling pathway and MitoCarta gene sets (row-normalized z-score) by popRNA-Seq demonstrates downregulation in AT2I73T cells at days 3 & 14 after tamoxifen induction (n = 4 mice per I73T time point, n = 8 WT mice). (B) Western blot of phosphorylated and total PGC1α (n = 3 biological replicates). (C) Time-dependent reduction in mtDNA copy number in AT2I73T (n = 3 mice for WT, n = 10 mice for day 7, n = 7 mice for day 14, n = 4 mice for day 28). (D) Unsupervised hierarchical clustering (Euclidean) heatmap of differentially expressed mtDNA genes by popRNA-Seq shows decreased expression in AT2I73T cells at day 14 (n = 4 mice per I73T time point and n = 8 WT mice). (E) Flow cytometry analysis of mitochondrial membrane potential (ΔΨm) demonstrates a time-dependent reduction in tetramethylrhodamine, methylester, fluorescence in AT2I73T cells (n = 4–5 mice per condition). Box plots show the interquartile range, median (line), and minimum and maximum (whiskers). (F) Measurement of oxygen consumption rate (OCR) shows a time-dependent reduction in basal and maximal uncoupled mitochondrial respiration and spare respiratory capacity in AT2I73T cells (n = 4–9 mice per condition). (G) Representative transmission electron microscopy (TEM) images of murine AT2 cells from whole lung mounts. Scale bars: 600 nm. (H) MitoTracker staining of murine AT2 cells after 18 hours in culture shows altered mitochondrial network morphology in AT2I73T versus AT2WT cells. Scale bars: 10 nm. (I) Quantification of mitochondrial structure in AT2 cells using ImageJ (NIH) Mitochondrial Analyzer shows increased fragmentation, decreased branch length, and altered shape in AT2I73T cells (each point is an average of 1 field of view containing a minimum of 10 cells; cells were isolated and cultured from n = 4 mice per condition and 5–6 fields were quantified). (J) Western blot and densitometric quantification (n = 3 biological replicates) of mitochondrial dynamics proteins demonstrates altered regulation of dynamics and mitophagy in AT2I73T cells. All mean± SEM. *P < 0.05, **P < 0.005, ***P < 0.0005, ****P < 0.00005 by ordinary 1-way ANOVA.
Figure 3
Figure 3. Impaired fatty acid oxidation and mitochondrial respiration are linked to AMPK signaling.
(A) Graphical representation of AMPK as a key regulator of many cellular processes, including mitochondrial biogenesis, autophagy, and fatty acid oxidation (FAO). (B) Increased ATP accumulation in freshly isolated AT2I73T cells at 7 days and 14 days after in vivo tamoxifen induction (mean± SEM; 25,000 cells, n = 5–9 mice per condition). (C) Western blot and densitometric quantification (mean± SEM; n = 3 biological replicates) of key enzymes in AMPK signaling pathway demonstrates reduced AMPK signaling and FAO in AT2I73T cells. (D and E) Reduced OCR in AT2I73T cells isolated at 14 days and 28 days after tamoxifen induction and cultured overnight in media supplied with endogenous fatty acids (mean± SEM; n = 9–19 mice per condition). (F and G) OCR in AT2I73T cells isolated at 28 days after in vivo tamoxifen induction and cultured for 48 hours in the presence of the following small molecules: rosiglitazone (25 μM, n = 8) to stimulate PPAR-γ, PF-06409577 (100 nM, n = 7) to activate AMPK, and Torin 1 (100 nM, n = 4) to inhibit mTOR (mean±SEM). *P < 0.05, **P < 0.005, ***P < 0.0005, ****P < 0.00005 by ordinary 1-way ANOVA.
Figure 4
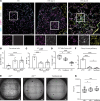
Figure 4. Metabolic alterations and emergence of an epithelial transitional state in response to in vivo SftpcI73T expression.
(A) Uniform manifold approximation and projection (UMAP) visualization of 35,002 lung cells profiled by scRNA-Seq in GSE234604 (56) color-coded by cell lineage with subset analysis of 2,500 distal epithelial cells. (B) Gradient dot plot of key distal epithelial genes used to annotate AT1 (cluster 1), AT2 (clusters 2, 4), and transitional subclusters (clusters 3, 5). (C) Dendrogram of top 20 DEGs and their associated log2FC for each cluster as determined by FDR. A subset of cluster-defining genes is highlighted. (D) Kyoto Encyclopedia of Genes and Genomes (KEGG) pathway enrichment analysis of DEGs (FDR < 0.05, log2FC > 1 & <–1) in cluster 2 compared with other clusters. (E) Gradient dot plot of KEGG pathway enrichment analysis of upregulated DEGs (FDR < 0.05, log2FC > 1) across clusters. (F) Color-coded UMAPs by genotype and time point and frequency table denoting cluster distributions within biological samples. (G) Volcano plot of differential expression analysis (FDR < 0.05, log2FC > 1 or <–1) comparing the early (cluster 3) and late (cluster 5) transitional clusters highlighting decreased expression of AT1 cell marker genes (Hopx, Ager, Cav1, Pdpn, Aqp5) and increased expression of transitional cell marker genes (Cldn4, Krt8, Krt18, Gdf15, Sppr1a) in the early transitional cell cluster. (H) Pseudotime trajectory analysis with starting node set in the AT2 cell cluster. (I) Gradient dot plot of indicated transitional state gene modules (Supplemental Table 1) (, , –69) across distal epithelial clusters. (J) KEGG pathway module scores for AMPK and PPAR signaling demonstrate progressive downregulation from the AT2 cell cluster to transitional cell clusters.
Figure 5
Figure 5. Persistence of an epithelial transitional state with diminished progenitor capacity in SftpcI73T lungs.
(A) Representative immunofluorescence staining of murine lung sections from WT or SftpcI73T mice 14 days and 28 days after tamoxifen induction stained with antibodies against pro–SP-C, KRT8, ASMA, and DAPI for nuclei counterstaining. Scale bars: 100 μm. (B) Flow cytometry quantification of CD51+ transitional cells shows a sustained increase of transitional cells after in vivo tamoxifen induction (mean±SEM; n = 6–12 mice per time point). (C) Flow cytometry quantification of EpCAM+CD51CD104 AT1 cells demonstrates a sustained loss of AT1 cells after in vivo tamoxifen induction (mean±SEM; n = 6–12 mice per time point). (D) MFI of MitoTracker dye accumulating in AT2, transitional, and AT1 cells isolated from SftpcI73T mice at 14 days after tamoxifen induction (mean± SEM; n = 6–9 mice per time point). Box plots show the interquartile range, median (line), and minimum and maximum (whiskers). (E) Representative light microscopy images of 21-day organoid cultures derived using WT PDGFRα+ fibroblasts and 1) AT2 WT cells, 2) AT2I73T cells, and 3) transitional cells isolated from SftpcI73T mice at 14 days after tamoxifen induction. Scale bars: 500 μm. (F) CFE of organoids with surface area > 10,000 μm2 (mean±SD; n = 3 biological replicates per condition). (G) Surface area quantification of organoids with surface area > 10,000 μm2 (each point represents an individual organoid mean±SEM; n = 3 biological replicates per condition). *P < 0.05, ***P < 0.0005, ****P < 0.00005 by ordinary 1-way ANOVA.
Figure 6
Figure 6. AMPK agonism ameliorates the metabolic alterations observed in human iAT2I73T cells.
(A and B) Western blot and densitometry quantification (normalized to loading control and presented as FC over iAT2WT of serially cultured human iAT2 cells (135–182 days) demonstrate increased LDHA/B ratio and decreased p-AMPK/AMPK ratio in iAT2I73T (SFTPCI73T/tdTomato) cells compared with syngeneic corrected iAT2WT cells (SFTPCWT/tdTomato) (mean±SEM; n = 3 biological replicates). (C) Measurement of extracellular lactate by YSI biochemistry analyzer shows increased extracellular lactate in iAT2I73T compared with iAT2WT cells. This increase is significantly reduced by treatment with AICAR (1 mM, 24 hours) (mean±SEM; n = 3 biological replicates for AICAR-treated and n = 5 biological replicates for vehicle-treated, each with 2 experimental replicates of independent wells). (D) Unsupervised hierarchical clustering (Euclidean) heatmap of all DEGs (FDR < 0.05) in iAT2WT and iAT2I73T cells treated with AICAR treatment (1 mM, 24 hours) or vehicle (row-normalized z-score). Gene ontology (GO) analysis of each subgroup using Database for Annotation, Visualization, and Integrated Discovery (DAVID) identifies increased expression of genes associated with fatty acid and lipid synthesis and reduced expression of transcripts linked to cell cycle regulation and glycolysis after AICAR treatment. A subset of sample genes from each GO term is highlighted. (E and F) Western blot of AMPK pathway targets in iAT2I73T cell lysates verifies AMPK signaling activation and increased PGC1α phosphorylation following AICAR treatment (1 mM, 24 hours). Bar graphs depict densitometric quantification (mean±SEM; n = 3 biological replicates). (G) Respirometry quantification depicted as OCR/ECAR ratio in iAT2I73T and iAT2WT cells following AICAR (1 mM, 24 hours) treatment (mean±SEM; n = 3 biological replicates). *P < 0.05, **P < 0.005, ***P < 0.0005, by ordinary 1-way ANOVA (C and G) and 1-tailed unpaired t test (B and F).
Figure 7
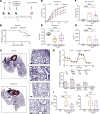
Figure 7. In vivo rescue of the SftpcI73T fibrotic phenotype via metformin intervention.
(A) Study design for metformin intervention in the SftpcI73T fibrosis mouse model. Metformin (150 mg/kg) or vehicle control was administered intraperitoneal (i.p.) daily on weekdays starting at 12 days after tamoxifen induction (n = 20 mice per group). (B) At 28 days, mortality was significantly (P = 0.0199) reduced in metformin-treated mice. (C) Representative Masson’s trichrome staining of SftpcI73T mouse lungs treated with either metformin or vehicle control and collected at 28 days after tamoxifen induction. (D and E) Static lung compliance, measured by SCIREQ Flexivent, increased significantly in metformin-treated mice compared with vehicle control (mean±SEM; n = 14 mice for vehicle group and n = 12 for WT and metformin groups). (F and G) Markers of inflammation and lung injury in the bronchoalveolar lavage fluid (BALF) collected from mice at 28 days after tamoxifen were significantly reduced in metformin-treated mice (mean±SEM; n = 12 mice per group). (H) OCR measurement and quantification in AT2 cells isolated from WT and SftpcI73T mice at 28 days after in vivo tamoxifen induction. AT2 cells were seeded overnight before respirometry was performed (mean±SEM; n = 8 mice per group). (I) ELISA quantification of CCL17 and CCL2 concentrations in BALF of WT and SftpcI73T mice at 28 days after in vivo tamoxifen induction (mean±SEM; n = 4 WT, 9 vehicle, and 10 I73T mice). *P < 0.05, **P < 0.005, ***P < 0.0005, ****P < 0.00005 by ordinary 1-way ANOVA.
Figure 8
Figure 8. Metformin enhances AT2 cell transcriptional program and reduces fibrotic fibroblast population.
(A) Schematic of experimental design and UMAP visualization of 39,327 lung cells from WT (age-matched C57B6/J; n = 2) and SftpcI73T mice, treated with either metformin (n = 1) or vehicle control (n = 1), collected at 28 days after tamoxifen induction, profiled by scRNA-Seq, and color-coded by cell lineage. Subset analysis of 4,040 distal epithelial cells is shown. (B) UMAPs color-coded by genotype and time point and frequency table showing the distribution of each cluster within treatment groups. (C) Dendrogram of top 50 DEGs and their associated log2FC for each cluster as determined by FDR. A subset of cluster-defining genes is highlighted. (D) KEGG pathway enrichment analysis of DEGs (FDR < 0.05, log2FC > 1 and <–1) comparing vehicle versus metformin treatment. (E) Gradient dot plots demonstrating expression of select gene modules (Supplemental Table 1) in alveolar epithelium and transitional cell clusters and fibrosis-associated genes in activated AT2 cells. (F) Subclustering of the mesenchymal compartment (24,853 cells) identifies 8 mesenchymal clusters, defined by marker genes, depicted in a gradient dot plot. (G) UMAPs color-coded by genotype and time point, with a frequency table highlighting a decrease in the fibrotic fibroblast population after metformin treatment.

Update of

References

    1. Blackwell TS, et al. Future directions in idiopathic pulmonary fibrosis research. An NHLBI workshop report. Am J Respir Crit Care Med. 2014;189(2):214–222. doi: 10.1164/rccm.201306-1141WS. - DOI - PMC - PubMed
    1. Selman M, Pardo A. Revealing the pathogenic and aging-related mechanisms of the enigmatic idiopathic pulmonary fibrosis. an integral model. Am J Respir Crit Care Med. 2014;189(10):1161–1172. doi: 10.1164/rccm.201312-2221PP. - DOI - PubMed
    1. Bringardner BD, et al. The role of inflammation in the pathogenesis of idiopathic pulmonary fibrosis. Antioxid Redox Signal. 2008;10(2):287–301. doi: 10.1089/ars.2007.1897. - DOI - PMC - PubMed
    1. Barkauskas CE, Noble PW. Cellular mechanisms of tissue fibrosis. 7. New insights into the cellular mechanisms of pulmonary fibrosis. Am J Physiol Cell Physiol. 2014;306(11):C987–C996. doi: 10.1152/ajpcell.00321.2013. - DOI - PMC - PubMed
    1. Winters NI, et al. Epithelial injury and dysfunction in the pathogenesis of idiopathic pulmonaryfibrosis. Am J Med Sci. 2019;357(5):374–378. doi: 10.1016/j.amjms.2019.01.010. - DOI - PMC - PubMed

MeSH terms

Substances

LinkOut - more resources