. 2025 Jul 1;135(16):e184043.
doi: 10.1172/JCI184043. eCollection 2025 Aug 15.

Targeting immune checkpoint LAIR1 with antibody blockade or 3-in-1 CAR T cells enhances antitumor response

Affiliations

Targeting immune checkpoint LAIR1 with antibody blockade or 3-in-1 CAR T cells enhances antitumor response

Haipeng Tao et al. J Clin Invest. .

Abstract

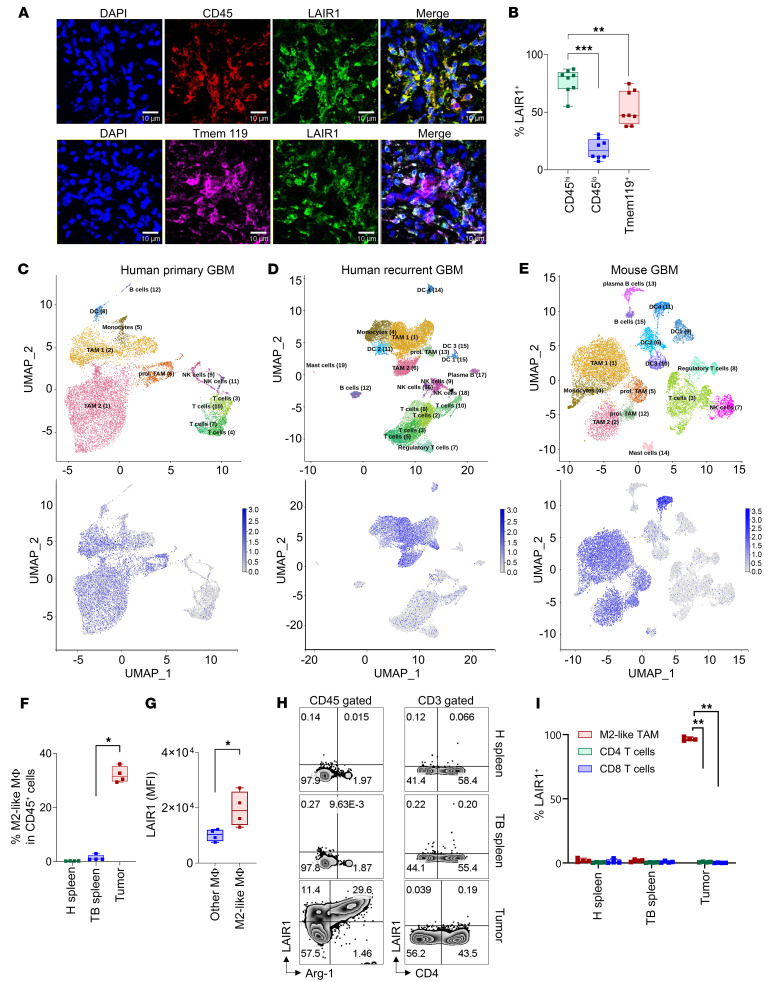
Tumor-associated macrophages (TAMs) are abundant in the tumor microenvironment (TME) and dampen the immune response, negatively affecting patient survival. Therefore, targeting TAMs could address the limitations of current cancer treatments. However, drug development in this area remains limited. The leukocyte-associated Ig-like receptor 1 (LAIR1), also called CD305, is prominently expressed on the surface of TAMs. We have uncovered what we believe to be a previously unrecognized immunosuppressive LAIR1/factor XIII A/collagen IV pathway across various cancer types. Inhibition of LAIR1, either through knockout (Lair1-/-), antibody blockade (anti-Lair1 antibody), or a chimeric antigen receptor (CAR) design (3-in-1 CAR by combining tumor targeting, T cell trafficking, and remodeling of the immunosuppressive TME in 1 CAR construct) provided an enhanced antitumor response. LAIR1 inhibition enhanced peripheral and intratumoral CD8 memory T cell populations, induced a phenotypic shift of M2-like macrophages toward M1 macrophages, and normalized tumor collagen IV and structural components in the TME, facilitating effective tumor-T cell interactions and tumor suppression. Enhanced antitumor responses were observed when Lair1-/- or anti-Lair1 antibody was used alone or in combination with CAR T cells or when the 3-in-1 CAR T cells were used solely in tumor models resistant to chemotherapy-radiation-programmed cell death protein 1 (PD-1) blockade. These findings position LAIR1 inhibition as a promising strategy for cancer immunotherapies.

Keywords: Cancer immunotherapy; Macrophages; Oncology; T cells; Therapeutics.


Conflict of interest statement

Conflict of interest: The University of Florida has filed 3 patent applications related to this project (US Patent Application no. 18/276,916, inventors: JH, HT, LJ, AK, and DAM; US Provisional Patent Application no. 63/820,419, inventors: JH, HT; US Patent Application no. 1178893, inventors: JH, LJ).

Figures

Figure 1
Figure 1. LAIR1 is mainly on CD45hi myeloid cells in human GBM.
(A) IF images of tumors from a patient with GBM. Scale bars: 10 μm. (B) Summary of the percentage of LAIR1+ cells on CD45hi, CD45lo, and Tmem119+ cells across 8 human GBMs. The numbers of LAIR1+, CD45+, and Tmem119+ cells were assessed individually. CD45+ cells were divided into CD45hi (top 50%) and CD45lo (bottom 50%) populations. The counts of CD45hiLAIR1+, CD45loLAIR1+, and Tmem119+LAIR1+ cells were determined. (C) Uniform manifold approximation and projection (UMAP) presents scRNA-Seq analysis of CD45+ cells from 7 human primary GBMs. (D and E) Results for 4 recurrent human GBMs and 3 GL261 GBMs were obtained using the same approach. The upper panels represent the cell subset maps, and the lower panels show enriched cell populations expressing LAIR1 (blue dots). (F) Four C57BL/6 female mice were i.c. injected with cells from the KR158B-Luc GBM line (1 × 10⁴ cells/mouse). Splenic (TB spleen) and tumor tissues were collected on day 35 following tumor implantation. Spleens obtained from healthy (H) age- and sex-matched mice (H spleens, n = 4) were used as a control. The samples were evaluated by flow cytometry (FC) to determine the percentage of M2-like TAMs among total CD45+ cells, with gating on CD45+CD11b+F4/80+Arg-1+ cells. (G) M2-like TAMs expressed relatively higher LAIR1 levels than did other MΦ in tumors (all non-M2-like TAMs). (H and I) High levels of LAIR1 were detected on M2-like TAMs in tumors, whereas minimal-to-no LAIR1 was detected on CD4+ or CD8+ T cells. The samples in F were analyzed by FC for LAIR1 expression in GI. The experiments shown in FI were repeated at least twice. Data in B, F, G, and I are shown as box-and-whisker plots. Statistical significance in B, F, G, and I was assessed by Mann-Whitney U test. FDR correction was applied in B, F, and I). *P < 0.05, **P < 0.01, and ***P < 0.001.
Figure 2
Figure 2. Lair1 knockout enhances antitumor immunity.
(A) Experimental design. Female and male LAIR1 WT (Lair1+/+) and knockout (Lair1–/–) C57/B6 mice were respectively implanted i.c. with KR158B-CD70-Luc murine glioma cells (1 × 10⁴ cells/mouse, n = 8 mice/group) on day 0. (B) Survival of the mice was measured. (C) Comparison of CD45+CD11b+ cells in the blood of mice from the 2 groups. Blood was collected from the facial vein 30 days after tumor implantation. (D) Experimental design. Lair1+/+ and Lair1–/– mice were implanted via i.c. with KR158B-CD70-Luc line (1 × 10⁴/mouse, n = 8–9/group) 10 days before the treatment (day –10). Mice were treated with either control or mouse CD70CAR T cells (1 × 10⁷/mouse) on day 0 through the tail vein. (E) IVIS monitored tumor sizes on the indicated days (left), and a percentage increase was calculated relative to baseline on the day –1 (right). (F) Survival was estimated for the groups, with the median overall survival (mOS) shown. (G) Evaluation of all-MΦ and M2-like TAMs in tumors. The treatment described in D was used. The tumors were collected from mice (n = 3 mice/group) 48 days after treatment. (H) Comparison of intratumoral immune cells between Lair1+/+ and Lair1–/– TB mice using ChIP cytometry. Forty days after tumor implantation, tumors were collected from a randomly selected mouse in each group in A. Cell types in Lair1+/+ and Lair1–/– tumors are shown. Scale bars: 250 µm (left) and 20µm (middle and right). (I) CD45+ cells were analyzed in the 10 ROIs within each tumor. (J and K) Each cell type was compared between Lair1+/+ and Lair1–/– TB mice. The in vivo experiments were repeated at least twice. Data are represented as box-and-whiskers plots (C, G, J, and K) and the mean ± SEM (E). Statistical significance was determined by log-rank test (B and F), Mann-Whitney U test (C, G, J, and K), and GEE models (E). FDR correction was applied (EG). *P < 0.05, **P < 0.01, and ***P < 0.001. Schematics in A and D were created using BioRender.com.
Figure 3
Figure 3. Human aLAIR1 reverses M2-like, MΦ-mediated T cell suppression.
(A) Experimental design (2D). Human PBMCs were used for autologous 8R-70CAR T cells and the generation of M2-like MΦ. (B) CellTrace Violet–labeled T cells were cocultured (n = 4/group) without M2-like MΦ (left) or with M2-like MΦ (right) in the presence of PBS/IgG/LAIR1 agonist/anti-LAIR1 antibody (aLAIR1) (5 μg/mL/day). T cell proliferation (CellTrace Violet) was assessed 72 hours after stimulation. (C) M2-like MΦ, 8R-70CAR T cells, and CD70+ U87 cells were cocultured (ratio: 2 × 10⁵ to 4 × 10⁴ to 1 × 10⁵, respectively) overnight (n = 4), and IFN-γ production by CAR T cells was measured. (D) PBMCs and CAR T cells derived for coculturing were tested for LAIR1 expression by FC. (E) Experimental design (3D). M2-like MΦ, 8R-70CAR T cells, and CD70+ U87 cells were cultured (ratio: 8 × 10³ to 1.6 × 10³ to 4 × 10³, respectively) with or without IgG or aLAIR1 (5 μg/mL/day) for 105 hours. (F) Video image at 60 hours after coculturing, showing enhanced CAR T cell–tumor interactions in aLAIR1-treated groups (yellow arrows) (see full, live videos in Supplemental Videos 1 and 2). Scale bars: 100 μm. (G and H) Mean velocity of CAR T cells (0–72 hours) with IgG or aLAIR1. (I and J) Kinetics of CAR T cell/M2-like MΦ and CAR T cell–tumor interaction in the presence of aLAIR1. The parameter was measured according to the overlapping region of CAR T, M2-like MΦ or according to CAR T/tumor signals as a percentage of total CAR T cells. (K) aLAIR1 suppressed tumor growth. Similarly, NAS T cells were analyzed in the presence of IgG or aLAIR1 (Supplemental Figure 8, A–E, and Supplemental Videos 3 and 4). (L) Chemokine and cytokine production was influenced by aLAIR1. The culture superannuants were collected 72 hours after the 3D coculture and tested using the Luminex 200. The experiments were repeated at least twice. Data are represented as box-and-whiskers plots (BD), the mean ± SD (G and H), or as points and connecting lines (HJ). Statistical significance was determined by Mann-Whitney U test (B, C, G, H, L) and GEE models (IK, P < 0.001). FDR correction was applied (B and C). ***P < 0.001. Schematics in A and E were created using BioRender.com.
Figure 4
Figure 4. Mouse aLAIR1 enhances antitumor response in tumor models.
(A) Experimental design for BH. The GBM cell lines KR158B-CD70-Luc (1 × 10⁴ cells/mouse, females, n = 8/group) and GL-261-Luc (1 × 10⁵ cells/mouse, female, n = 8/group) were i.c. implanted. LLC1 (1 × 10⁵ cells/mouse, n = 9/group) was s.c. injected into female C57BL/6 mice 7 days before treatment. TB mice received a 5-dose treatment (200 μg/dose/mouse) of aLAIR1, aPD-1, or IgG via i.p. injection every other day from day 0 to day 8. (B and C) IVIS was performed to monitor tumor size on the indicated days before and after treatment. (D) Tumor increase after treatment was compared by IVIS relative to baseline values recorded on day –1. (E and F) Survival of KR158B-CD70-Luc and GL261-Luc mice after aLAIR1, aPD-1, or IgG treatment. (G and H) aLAIR1 improved the antitumor response in the LLC1 model. Tumor volume was calculated by the ellipsoidal formula: V = ½ (width2 × length) from day –7 to day 12 after aLAIR1 or IgG treatment. Tumors were collected on day 13 after treatment. (I) Experimental design for the combination therapy using aLAIR1 with mouse CD70CAR T cells. The KR158B-CD70-Luc cells were i.c. implanted (1 × 10⁴ cells/mouse, n = 8/group) into female C57BL/6 mice 10 days before the CAR T cell treatment. Subsequently, 1 × 10⁷ mouse CD70CAR T cells were injected via the tail vein on day 0, following 5 doses of aLAIR1 or IgG (200 μg/dose/mouse) administered to the mice by i.p. injection every other day from days 1–9. (J) Tumor increase following the indicated treatment at day 39 after treatment. All experiments were repeated at least twice. Data are represented as the mean ± SEM (C, D, and H) and box-and-whiskers plots (J). Statistical significance was determined using GEE models (C and D), the log-rank test (E, F, and K), GEE models (H), and the Mann-Whitney U test (J). FDR correction was applied (CE, J, and K). *P < 0.05, **P < 0.01, and ***P < 0.001. Schematics in A and I were created using BioRender.com.
Figure 5
Figure 5. L2-8R-70CAR T cells enhance the antitumor response.
(A) Diagram of human L2-8R-70CAR and 8R-70CAR constructs. (B) Schematic representation of the 3-in-1 functionality of L2-8R-70CAR T cells. (C) T cells derived from a donor’s PBMCs were transduced with L2-8R-70CAR T cells (n = 3), 8R-70CAR T cells (n = 1), or untransduced T cells (UTT) (n = 1), respectively. Supernatants from T cell cultures were collected over a 27-day period for LAIR2 secretion by ELISA. (D and E) GZMB and TNF-α expression in T cells was assessed by FC following coculturing of CAR T cells (1 × 10⁵) with CD70+U87 (1 × 10⁵) cells (n = 4) overnight. (F and G) Human (h) and mouse (m) CAR T cells specifically recognized their respective CD70-expressing tumor origins (hTumor: CD70+U87 and CD70 pGBM1; mTumor: KR158B-CD70-Luc and KR158B-Luc). (H) Experimental design. C57BL/6 splenic T cells were transduced with 8R-70CAR or L2-8R-70CAR T cells. Mice (n = 3 groups, n = 8 mice/group) received i.c. injections of 1 × 10⁴ CD70+ mTumor cells. Two of the groups were i.v. administered 1 × 10⁷ CAR T cells on days 0 and 3, and the third group was untreated. (I and J) The percentage of tumor increase (day 38 a treatment) and survival were monitored. (K and L) mTumor sections (day 39 after treatment, H) were stained for collagen I and collagen IV. MFI was calculated as follows: (total intensity – background)/nuclei. (M) Comparison of intratumoral T cell infiltration after treatment. IF images of intratumoral CAR T cells were visualized, showing mouse CD8, human CXCR2, and DAPI staining in tumor sections. Scale bars: 10 μm. (N) Summary of tumor samples from 3 mice (n = 3 randomly selected sections per mouse) in each treatment group, showing the percentage of CD8+CXCR2+ cells relative to total nuclei. All experiments were repeated twice. Data are represented as the mean ± SEM (C) and box-and-whiskers plots (DG, I, and KM). Statistical significance was determined using GEE (C, K, L, and N), the Mann-Whitney U test (DG, and I), and the log-rank test (J). FDR correction was applied for all comparisons. **P < 0.01 and ***P < 0.001. Schematics in A, B, and H were created using BioRender.com.
Figure 6
Figure 6. LAIR1 inhibition reduces tumor collagen IV by lowering FXIII-A in M2-like TAMs and MΦ.
(A and B) Collagen IV IF staining was performed on normal brain tissues from Lair1+/+ and Lair1–/– mice, and MFI was quantified. Scale bars: 10 μm. (C and D) Tumors from Lair1+/+ and Lair1–/– TB mice (KR158B-CD70-Luc) were collected 40 days after treatment (Figure 2A) and stained for collagen IV. Scale bars: 10 μm (top), 5 μm (bottom). (E and F) IF images showing collagen IV staining of tumor tissue from C57BL/6 TB mice (LLC1) treated with IgG or aLAIR1, and tumors were collected on post-treatment day 13 (Figure 4G). Scale bars: 10 μm (top), 5 μm (bottom). The 3D image reconstruction (A, C, and E) and quantification (B, D, and F) were based on 2D images (n = 3 mice/group, n = 9 sections total) were performed. (G and H) C57BL/6 TB mice (KR158B-CD70-Luc, 3/group) with or without IgG or aLAIR1 (experimental design as in Figure 4A). Tumor scRNA-Seq was performed 49 days after treatment. UMAPs illustrate immune cell clusters with population summaries (>1%) shown. (I) Heatmap of the top 5 up- and downregulated genes in all-MΦ clusters comparing the aLAIR1- versus IgG-treated groups. (J) Volcano plot highlighting DEGs in M2-like TAMs, identifying F13a1, which encodes FXIII-A. (K) BM monocytes from Lair1+/+ and Lair1–/– C57BL/6 mice were cultured with M-CSF (100 ng/mL, 7 days), followed by IL-4, IL-10, and IL-13 (20 ng/mL, 2 days) to induce M2-like MΦ. Control cells were cultured without cytokines. Cells were harvested on day 9, and FXIII-A expression was assessed by Western blotting. (L) Arg-1 MFI was measured by FC in BM-derived M2-like MΦ (n = 3~4) treated with or without 10 μg/mL murine FXIII-A for 48 hours. M2-like MΦ were gated on CD45+CD11b+F4/80+Arg-1+cells. (M and N) KR158B-CD70-Luc cells (n = 9/group) were incubated with or without 10 μg/mL FXIII-A for 24 hours, and collagen IV levels were quantified and expression imaged. Scale bars: 4 μm. All data were reproduced 2 or more times. Data are shown as box-and-whisker plots (B, D, F, H, L, and N). Statistical significance was determined by GEE (B, D, and F), a 2-sample t test (H and J), and the Mann-Whitney U test (L). FDR correction was applied (J). *P < 0.05, **P < 0.01 and ***P < 0.001.

Comment in

  • Targeting LAIR1-mediated immunosuppression adds a new weapon to our immunotherapy arsenal

References

    1. Hanahan D, Weinberg RA. Hallmarks of cancer: the next generation. Cell. 2011;144(5):646–674. doi: 10.1016/j.cell.2011.02.013. - DOI - PubMed
    1. Robert C, et al. Durable complete response after discontinuation of pembrolizumab in patients with metastatic melanoma. J Clin Oncol. 2018;36(17):1668–1674. doi: 10.1200/JCO.2017.75.6270. - DOI - PubMed
    1. Sampson JH, et al. Immunotherapy for brain tumors. J Clin Oncol. 2017;35(21):2450–2456. doi: 10.1200/JCO.2017.72.8089. - DOI - PubMed
    1. Ribas A, Wolchok JD. Cancer immunotherapy using checkpoint blockade. Science. 2018;359(6382):1350–1355. doi: 10.1126/science.aar4060. - DOI - PMC - PubMed
    1. Sharma P, Allison JP. The future of immune checkpoint therapy. Science. 2015;348(6230):56–61. doi: 10.1126/science.aaa8172. - DOI - PubMed

MeSH terms

Substances