. 2025 Jul 1;135(17):e190539.
doi: 10.1172/JCI190539. eCollection 2025 Sep 2.

Cingulate retinoic acid signaling regulates neuropathic pain and comorbid anxiodepression via extracellular matrix homeostasis

Affiliations

Cingulate retinoic acid signaling regulates neuropathic pain and comorbid anxiodepression via extracellular matrix homeostasis

Zhen-Zhen Li et al. J Clin Invest. .

Abstract

Neuropathic pain is often comorbid with affective disorders. Synaptic plasticity in anterior cingulate cortex (ACC) is assumed to be a crucial interface for pain perception and emotion. Laminin 1 (LAMB1), a key element of extracellular matrix (ECM) in ACC was recently revealed to convey extracellular alterations to intracellular synaptic plasticity and underlie neuropathic pain and aversive emotion. However, it remains elusive what triggers activity-dependent changes of LAMB1 and ECM remodeling after nerve injury. Here, we uncovered a key role of retinoic acid (RA)/RA receptor β (RARB) signaling in neuropathic pain and associated anxiodepression via regulation of ECM homeostasis. We showed that nerve injury reduced RA levels in the serum and ACC in mice and humans, which brought about downregulation of RA's corresponding receptor, RARB. Overexpressing RARB relieved pain hypersensitivity and comorbid anxiodepression, while silencing RARB exacerbated pain sensitivity and induced anxiodepression. Further mechanistic analysis revealed that RARB maintained ECM homeostasis via transcriptional regulation of LAMB1, reversing abnormal synaptic plasticity and eventually improving neuropathic pain and aversive emotion. Taken together with our previous study, we revealed an intracellular-extracellular-intracellular feed-forward regulatory network in modulating pain plasticity. Moreover, we identified cingulate RA/RARB signaling as a promising therapeutic target for treatment of neuropathic pain and associated anxiodepression.

Keywords: Cell biology; Extracellular matrix; Neuroscience; Pain; Synapses.


Figures
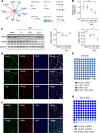
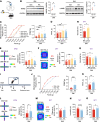
Figure 1
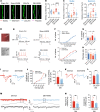
Figure 1. Peripheral neuropathy decreases RARB expression in the ACC.
(A) Potential transcription factors (TF) of Lamb1 with differentially expressed genes in RNA-Seq data of contralateral ACC from SNI-treated versus sham-treated mice. The line color and size indicate the relativity with Lamb1 (n = 3–4 mice per group). (B and C) RARB expression in the ACC after SNI surgery at both the mRNA (B) (n = 3) and protein level (C) (n = 3). (D and E) Representative examples (D) and quantitative summary (E) of RARB coexpressing with neuronal nuclear antigen (NeuN), glial fibrillary acidic protein (GFAP), or ionized calcium–binding adapter molecule 1 (Iba1) (n = 3). (F and G) Representative examples (F) and quantitative summary (G) of RARB coexpressing with CaMKII or GAD67 neurons (n = 3). Scale bars: 30 μm in D and F. *P < 0.05, **P < 0.01. Statistical analysis was performed by 1-way ANOVA (B and C for RARB/GAPDH) and Kruskal-Wallis H test (C for RARA/GAPDH).
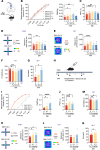
Figure 2
Figure 2. RARB overexpression in ACC relieves pain hypersensitivity and anxiodepression.
(A) Schematic diagram showing intra-ACC virus injection. Scale bar: 1 mm. (B and C) Double immunofluorescence (B) and Western blotting (C) showing efficient RARB overexpression in ACC (n = 4). Scale bars: 30 μm in B. (D) Experimental schematic diagram showing virus injection in ACC and behavioral test. (E and F) Ipsilateral stimulus-response curve and mechanical threshold (E), and thermal sensitivity (F) in SNI-treated mice after ACC RARB overexpression (n = 10). (G and H) Contralateral stimulus-response curve and mechanical threshold (G), and thermal sensitivity (H) in SNI-treated mice after ACC RARB overexpression (n = 10). (I) Traveling trajectory in the EPM and quantitative summary of mice overexpressing RARB in the open arm (n = 9–10). (J) TST summary in mice after overexpression of RARB in the ACC (n = 8–11). (K) SPT in RARB-overexpressing Sham- and SNI-treated mice (n = 10). *P < 0.05, **P < 0.01, ***P < 0.001, ****P < 0.0001. Statistical analysis was performed by 2-tailed unpaired t test (C, F, and H), Mann-Whitney U test (E and G), 1-way ANOVA (J and K), and Kruskal-Wallis H test (I). PWMT, paw withdrawal mechanical threshold; PWTL, paw withdrawal thermal latency.
Figure 3
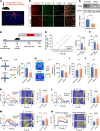
Figure 3. RARB overexpression in ACC normalizes abnormal structural and functional plasticity induced by SNI.
(A) Representative images of apical dendrites of ACC pyramidal neurons obtained from mice overexpressing RARB and control virus in both sham and SNI conditions. Scale bar: 5 μm. (B) Summary of spine density on the apical dendrites in the above 4 conditions (n = 17–20). (C) Summary of the density of stubby and mushroom-shaped spines (n = 17–20). (D) Whole-cell patch-clamp recording from ACC layer II/III pyramidal neurons. Scale bar: 50 μm. (E) APs in neurons after overexpressing RARB in both genotypes of mice. (F and G) Input-output curve (F) and typical summary at intensity of 120 pA (G) after overexpressing RARB in sham- and SNI-treated mice (n = 8–11). (H) Rheobase after RARB overexpression in both types of mice (n = 8–11). (I and J) Representative traces (I) and input-output curve (J) of AMPAR-eEPSCs after overexpressing RARB in SNI-treated mice (n = 8–10). (K and L) Typical examples (K) and quantitative summary (L) of PPR of eEPSCs after RARB overexpression in the SNI condition (n = 10–12). (M and N) Representative traces (M), and mEPSC frequency and amplitude (N) after RARB overexpression in SNI-treated mice (n = 12). *P < 0.05, **P < 0.01, ***P < 0.001, ****P < 0.0001. Statistical analysis was performed by Kruskal-Wallis H test (B and C), 2-way ANOVA (F and left panel in J), 1-way ANOVA (G and H), 2-tailed unpaired t test (L and left panel in N), and Mann-Whitney U test (right panels in J and N).
Figure 4
Figure 4. RARB overexpression in ACC alleviates neuronal hyperactivity induced by SNI.
(A) Experimental schematic diagram showing virus injection, optical fiber implantation in the ACC, and fiber photometry recording during behavioral test in mice expressing control virus and RARB. SAC, sacrifice. Scale bar: 1 mm (left), 200 μm (right). (BG) Representative photometry traces as shown in heat maps and quantitative summary from 5 independent experiments of peak GCaMP6s signals locked to the 0.4 g mechanical stimuli (B), 2 g mechanical stimuli (C), brush stimuli (D), pinprick nociception (E), and radiant heat stimulation (F) and the onset of struggling during tail suspension (G). ***P < 0.001, ****P < 0.0001. Statistical analysis was performed by Mann-Whitney U test (B, C, E, and F) and 2-tailed unpaired t test (D and G).
Figure 5
Figure 5. RARB knockdown in ACC induces pain hypersensitivity and anxiodepression.
(A) Schematic diagram showing intra-ACC virus injection. Scale bar: 1 mm. (B and C) Double immunofluorescence (B) and Western blotting (C) showing efficient RARB knockdown (n = 4). Scale bars: 30 μm in B. (D) Schematic diagram showing virus injection in ACC and behavioral test in mice expressing scrambled shRNA and shRarb. (E and F) Ipsilateral stimulus-response curve and mechanical threshold (E), and thermal sensitivity (F) after ACC RARB knockdown in sham-treated mice (n = 12–16). (G) Traveling trajectory in the EPM and quantitative summary of sham-treated mice expressing shRarb in the open arm (n = 11–13). (H) Traveling trajectory in the OFT and quantitative summary of sham-treated mice expressing shRarb in the center area (n = 11–13). (I) TST after expression of AAV-shRarb in sham-treated mice (n = 9–11). (J) SPT in shRarb-expressing Sham-treated mice (n = 10). (KN) Representative photometry traces as shown in heat maps and quantitative summary from 5 independent experiments of peak GCaMP6s signals locked to von Frey hair stimuli (0.4–2 g) (K and L), radiant heat stimuli (M), and the onset of struggling during tail suspension (N). *P < 0.05, **P < 0.01, ***P < 0.001, ****P < 0.0001. Statistical analysis was performed by Mann-Whitney U test (C, E, I, K, and N) and 2-tailed unpaired t test (FH, J, L, and M).
Figure 6
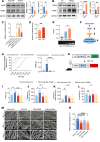
Figure 6. RARB regulates ECM remodeling via LAMB1 to modulate pain sensitivity and anxiodepression.
(A and B) Representative immunoblots and quantitative summary of RARB and LAMB1 levels in ACC from mice expressing scrambled shRNA and shRarb (n = 4) (A) as well as control virus and RARB (n = 4) (B). (C) Luciferase activity after cotransfection of RARB-overexpressing plasmid and luciferase reporter plasmid connected with Lamb1 promoter/Lamb1 promoter mutant (n = 6–10). (D) Luciferase activity of vehicle and RA addition after cotransfection of RARB and Lamb1-Luc (n = 7–8). (E) ChIP assay of levels of RARB binding with the Lamb1 promoter fragment in the ACC from mice expressing control (Ctrl) and RARB (n = 5). (F) A schematic model proposing the RARB regulatory mechanism in the process of chronic pain. (G) Schematic diagram showing virus injection in ACC. (H and I) Stimulus-response curve and mechanical threshold (H) and thermal hyperalgesia (I) in SNI-treated mice followed by shLamb1 and/or RARB overexpression treatment (n = 9–10). (JL) OFT (J), EPM (K), and TST (L) in SNI-treated mice expressing shLamb1 and/or RARB (n = 8–10). (M and N) Representative scanning electron micrographs (M) and fiber diameter (N) in control mice, SNI-treated mice, SNI-treated mice overexpressing RARB, and sham-treated mice expressing shRarb (n = 3 mice per group). Scale bars: 5 μm (original magnification, ×5,000), 1.2 μm (original magnification, ×20,000), and 500 nm (original magnification, ×50,000). *P < 0.05, **P < 0.01, ***P < 0.001, ****P < 0.0001. Statistical analysis was performed by Mann-Whitney U test (A for RARB), 2-tailed unpaired t test (A for LAMB1, B, and D), Kruskal-Wallis H test (C, H, K, L, and N), and 1-way ANOVA (E, I, and J).
Figure 7
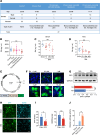
Figure 7. RA levels are decreased in chronic pain comorbid with anxiodepression.
(A) A table summarizing the patient information. The groups met the following conditions: healthy volunteers: NRS < 3, GAD7 ≤ 4, HAMA ≤ 6, HAMD ≤ 8, PHQ-9 ≤ 4; chronic pain: NRS ≥ 3, GAD7 ≤ 4, HAMA ≤ 6, HAMD ≤ 8, PHQ-9 ≤ 4; chronic pain comorbid with anxiety: NRS ≥ 3, GAD7 > 4 and/or HAMA > 6, HAMD ≤ 8, PHQ-9 ≤ 4; chronic pain comorbid with depression: NRS ≥ 3, GAD7 ≤ 4, HAMA ≤ 6, HAM > 8, and/or PHQ-9 > 4; and chronic pain comorbid with anxiodepression: NRS ≥ 3, GAD7 > 4 and/or HAMA > 6, HAMD > 8 and/or PHQ9 > 4. (B) ELISA of RA level in serum from patients (n = 2–22). (C and D) ELISA of RA level in serum (C) (n = 5–6) and the ACC (D) (n = 4–8) after SNI surgery. (E) Schematic diagram showing construction of AAV2/9 expressing RARE–TK promoter–EGFP. TK, thymidine kinase. (F) Fluorescence images of GFP expression in 293FT cells transfected with AAV-RARE plasmid after RA treatment. Scale bars: 20 μm. (G) Immunoblots and quantitative summary of GFP expression in 293FT cells transfected with AAV-RARE plasmid after RA (5 μM) treatment (n = 3). Veh, vehicle. (H and I) Immunofluorescence (H) and quantitative summary (I) of GFP and RARB expression in ACC from SNI-treated mice expressing AAV-RARE (n = 4). Scale bars: 30 μm. (J) Luciferase activity of vehicle and RA addition in the transfection of Rarb-Luc (n = 6–12). *P < 0.05, **P < 0.01. Statistical analysis was performed by Kruskal-Wallis H test (B, D, and J), 1-way ANOVA (C), 2-tailed unpaired t test (G and I for RARB density), and Mann-Whitney U test (I for GFP density).
Figure 8
Figure 8. Administration of RA relieves established pain hypersensitivity and anxiodepression after SNI.
(A) Schematic diagram of intra-ACC injection of RA in SNI-treated mice. (B) Immunoblots and quantitative summary of LAMB1 and RARB protein level after ACC injection of RA. Veh, vehicle. (C and D) Ipsilateral stimulus-response curves and mechanical threshold (C), and thermal latency (D) in SNI-treated mice followed by intra-ACC injection of RA (n = 10). (E) Open-arm exploring in the EPM test of SNI-treated mice after ACC delivery of RA (n = 7–10). (F) Center area exploring in the OFT of SNI-treated mice after ACC delivery of RA (n = 7–10). (G and H) TST (G) and SPT (H) in SNI-treated mice after intra-ACC injection of RA (n = 7–15). (I) Schematic diagram of oral intake of RA (0.6 mg/kg) in SNI-treated mice. (J and K) Ipsilateral stimulus-response curves and mechanical threshold (J), and thermal latency (K) in SNI-treated mice followed by oral intake of RA (n = 12). (L) Open-arm exploring in EPM test in SNI-treated mice after oral RA (n = 12). (M) Center area exploring in the OFT of SNI-treated mice after RA intake (n = 12). (N and O) TST (N) and SPT (O) of SNI-treated mice after RA intake (n = 9–12). *P < 0.05, **P < 0.01, ***P < 0.001, ****P < 0.0001. Statistical analysis was performed by 2-tailed unpaired t test (B, H, and KO), Kruskal-Wallis H test (C and E), 1-way ANOVA (D, F, and G), and Mann-Whitney U test (J).
Figure 9
Figure 9. RA alleviates neuronal overexcitation by regulating ECM microstructure through RARB after SNI.
(A) Whole-cell patch-clamp recording from ACC layer II/III pyramidal neurons. Scale bar: 50 μm. (B and C) APs at 100 pA (B) and input-output curve (C) after bath-applied RA (20 μM) (n = 10). (D) Rheobase of neurons after delivery of RA (n = 10). (E and F) Representative traces (E) and input-output curve (F) of AMPAR-eEPSCs in SNI-treated mice prior to, during, and after washout of RA (n = 10–11). (G and H) Representative traces (G), and time course and quantitative summary (H) of ACC LTP evoked by conditioning stimulus (CS) in the presence of RA (20 μM) and vehicle (Veh) (n = 7–8). (I and J) Confocal images (I) and quantitative summary (J) of GFP and RARB expression after delivery of TTX + AP5 in ACC from SNI-treated mice expressing AAV-RARE (n = 4). Scale bars: 200 μm (left), 30 μm (right). (K and L) Representative scanning electron micrographs (K) and quantitative summary (L) in SNI-treated mice with treatments at different magnification (n = 4 mice per group). Scale bars: 5 μm (original magnification, × 5,000), 1.2 μm (original magnification, ×20,000), and 500 nm (original magnification, ×50,000). **P < 0.01, ***P < 0.001, ****P < 0.0001. Statistical analysis was performed by 2-way ANOVA (left panels in C and F), 1-way ANOVA (right panel in C), Kruskal-Wallis H test (D, right panel in F and L), and 2-tailed unpaired t test (H and J).
Figure 10
Figure 10. Administration of TLZ relieves established pain hypersensitivity and anxiodepression after SNI.
(A) Schematic diagram of intra-ACC injection of TLZ in SNI-treated mice. (B and C) Ipsilateral stimulus-response curves and PWMT (B), and PWTL (C) in SNI-treated mice followed by intra-ACC injection of TLZ (n = 8–12). (D) Open-arm exploring in EPM test of SNI-treated mice after ACC delivery of TLZ (n = 8–12). (E) Center area exploring in the OFT of SNI-treated mice after ACC delivery of TLZ (n = 8–12). (F and G) TST (F) (n = 8–12) and SPT (G) (n = 5–6) in SNI-treated mice after intra-ACC injection of TLZ. (H) Schematic diagram of i.p. injection of TLZ in SNI-treated mice. (I and J) Ipsilateral stimulus-response curves and PWMT (I), and PWTL (J) in SNI-treated mice followed by administration of TLZ (n = 12). (K) Open-arm exploring in EPM test in SNI-treated mice after injection of TLZ (n = 12). (L) Traveling trajectory in the OFT and quantitative summary after TLZ injection in SNI-treated mice (n = 12). (M and N) TST (M) and SPT (N) in SNI-treated mice after i.p. TLZ (n = 9–12). *P < 0.05, **P < 0.01, ***P < 0.001, ****P < 0.0001. Statistical analysis was performed by Kruskal-Wallis H test (B, F, I, L, and M), 1-way ANOVA (CE, G, J, and K), and 2-tailed unpaired t test (N).
Figure 11
Figure 11. A schematic model proposing how cingulate RA/RARB homeostasis modulates neuropathic pain and associated anxiodepression via interaction with ECM LAMB1 through an intracellular-extracellular-intracellular feed-forward regulatory network.
See Discussion for details.

References

    1. Bushnell MC, et al. Cognitive and emotional control of pain and its disruption in chronic pain. Nat Rev Neurosci. 2013;14(7):502–511. doi: 10.1038/nrn3516. - DOI - PMC - PubMed
    1. Barthas F, et al. The anterior cingulate cortex is a critical hub for pain-induced depression. Biol Psychiatry. 2015;77(3):236–245. doi: 10.1016/j.biopsych.2014.08.004. - DOI - PubMed
    1. Vogt BA. Pain and emotion interactions in subregions of the cingulate gyrus. Nat Rev Neurosci. 2005;6(7):533–544. doi: 10.1038/nrn1704. - DOI - PMC - PubMed
    1. Meng F, et al. Neural mechanisms of social empathy in the anterior cingulate cortex. Adv Neurol. 2023;2(1):281. doi: 10.36922/an.281. - DOI
    1. Bliss TV, et al. Synaptic plasticity in the anterior cingulate cortex in acute and chronic pain. Nat Rev Neurosci. 2016;17(8):485–496. doi: 10.1038/nrn.2016.68. - DOI - PubMed

MeSH terms