. 2024 Aug 13;121(33):e2401996121.
doi: 10.1073/pnas.2401996121. Epub 2024 Aug 6.

UPF1 deficiency enhances mitochondrial ROS which promotes an immunosuppressive microenvironment in pancreatic ductal adenocarcinoma

Affiliations

UPF1 deficiency enhances mitochondrial ROS which promotes an immunosuppressive microenvironment in pancreatic ductal adenocarcinoma

Wenjuan Su et al. Proc Natl Acad Sci U S A. .

Abstract

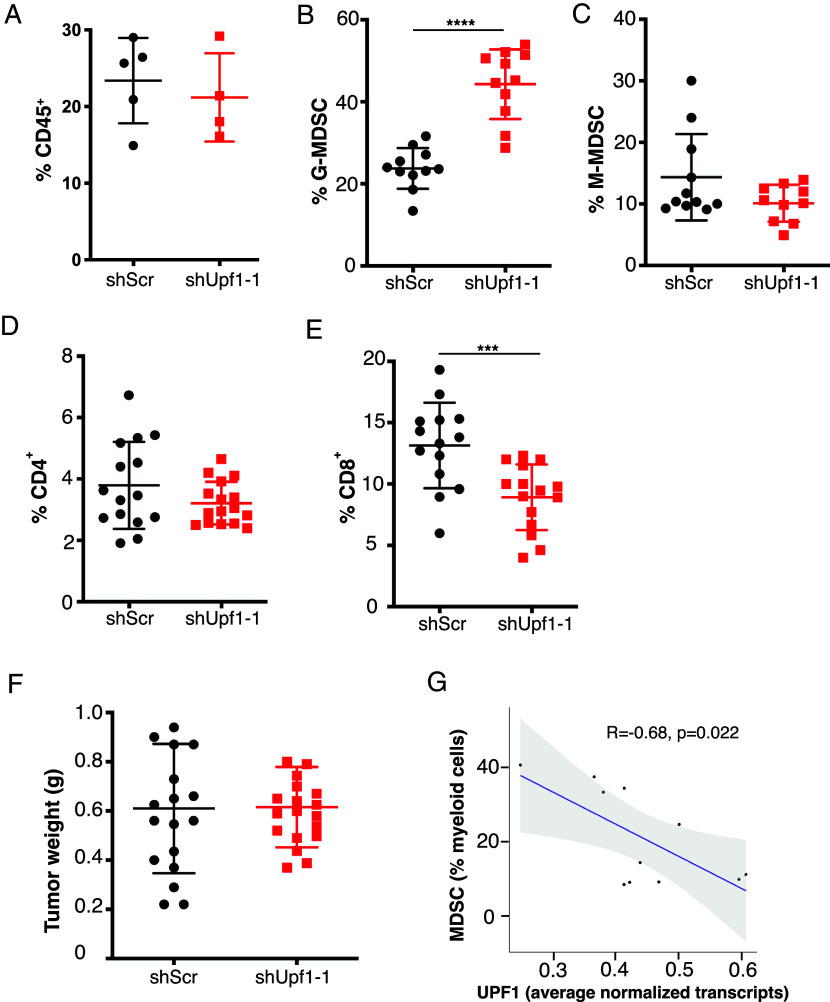
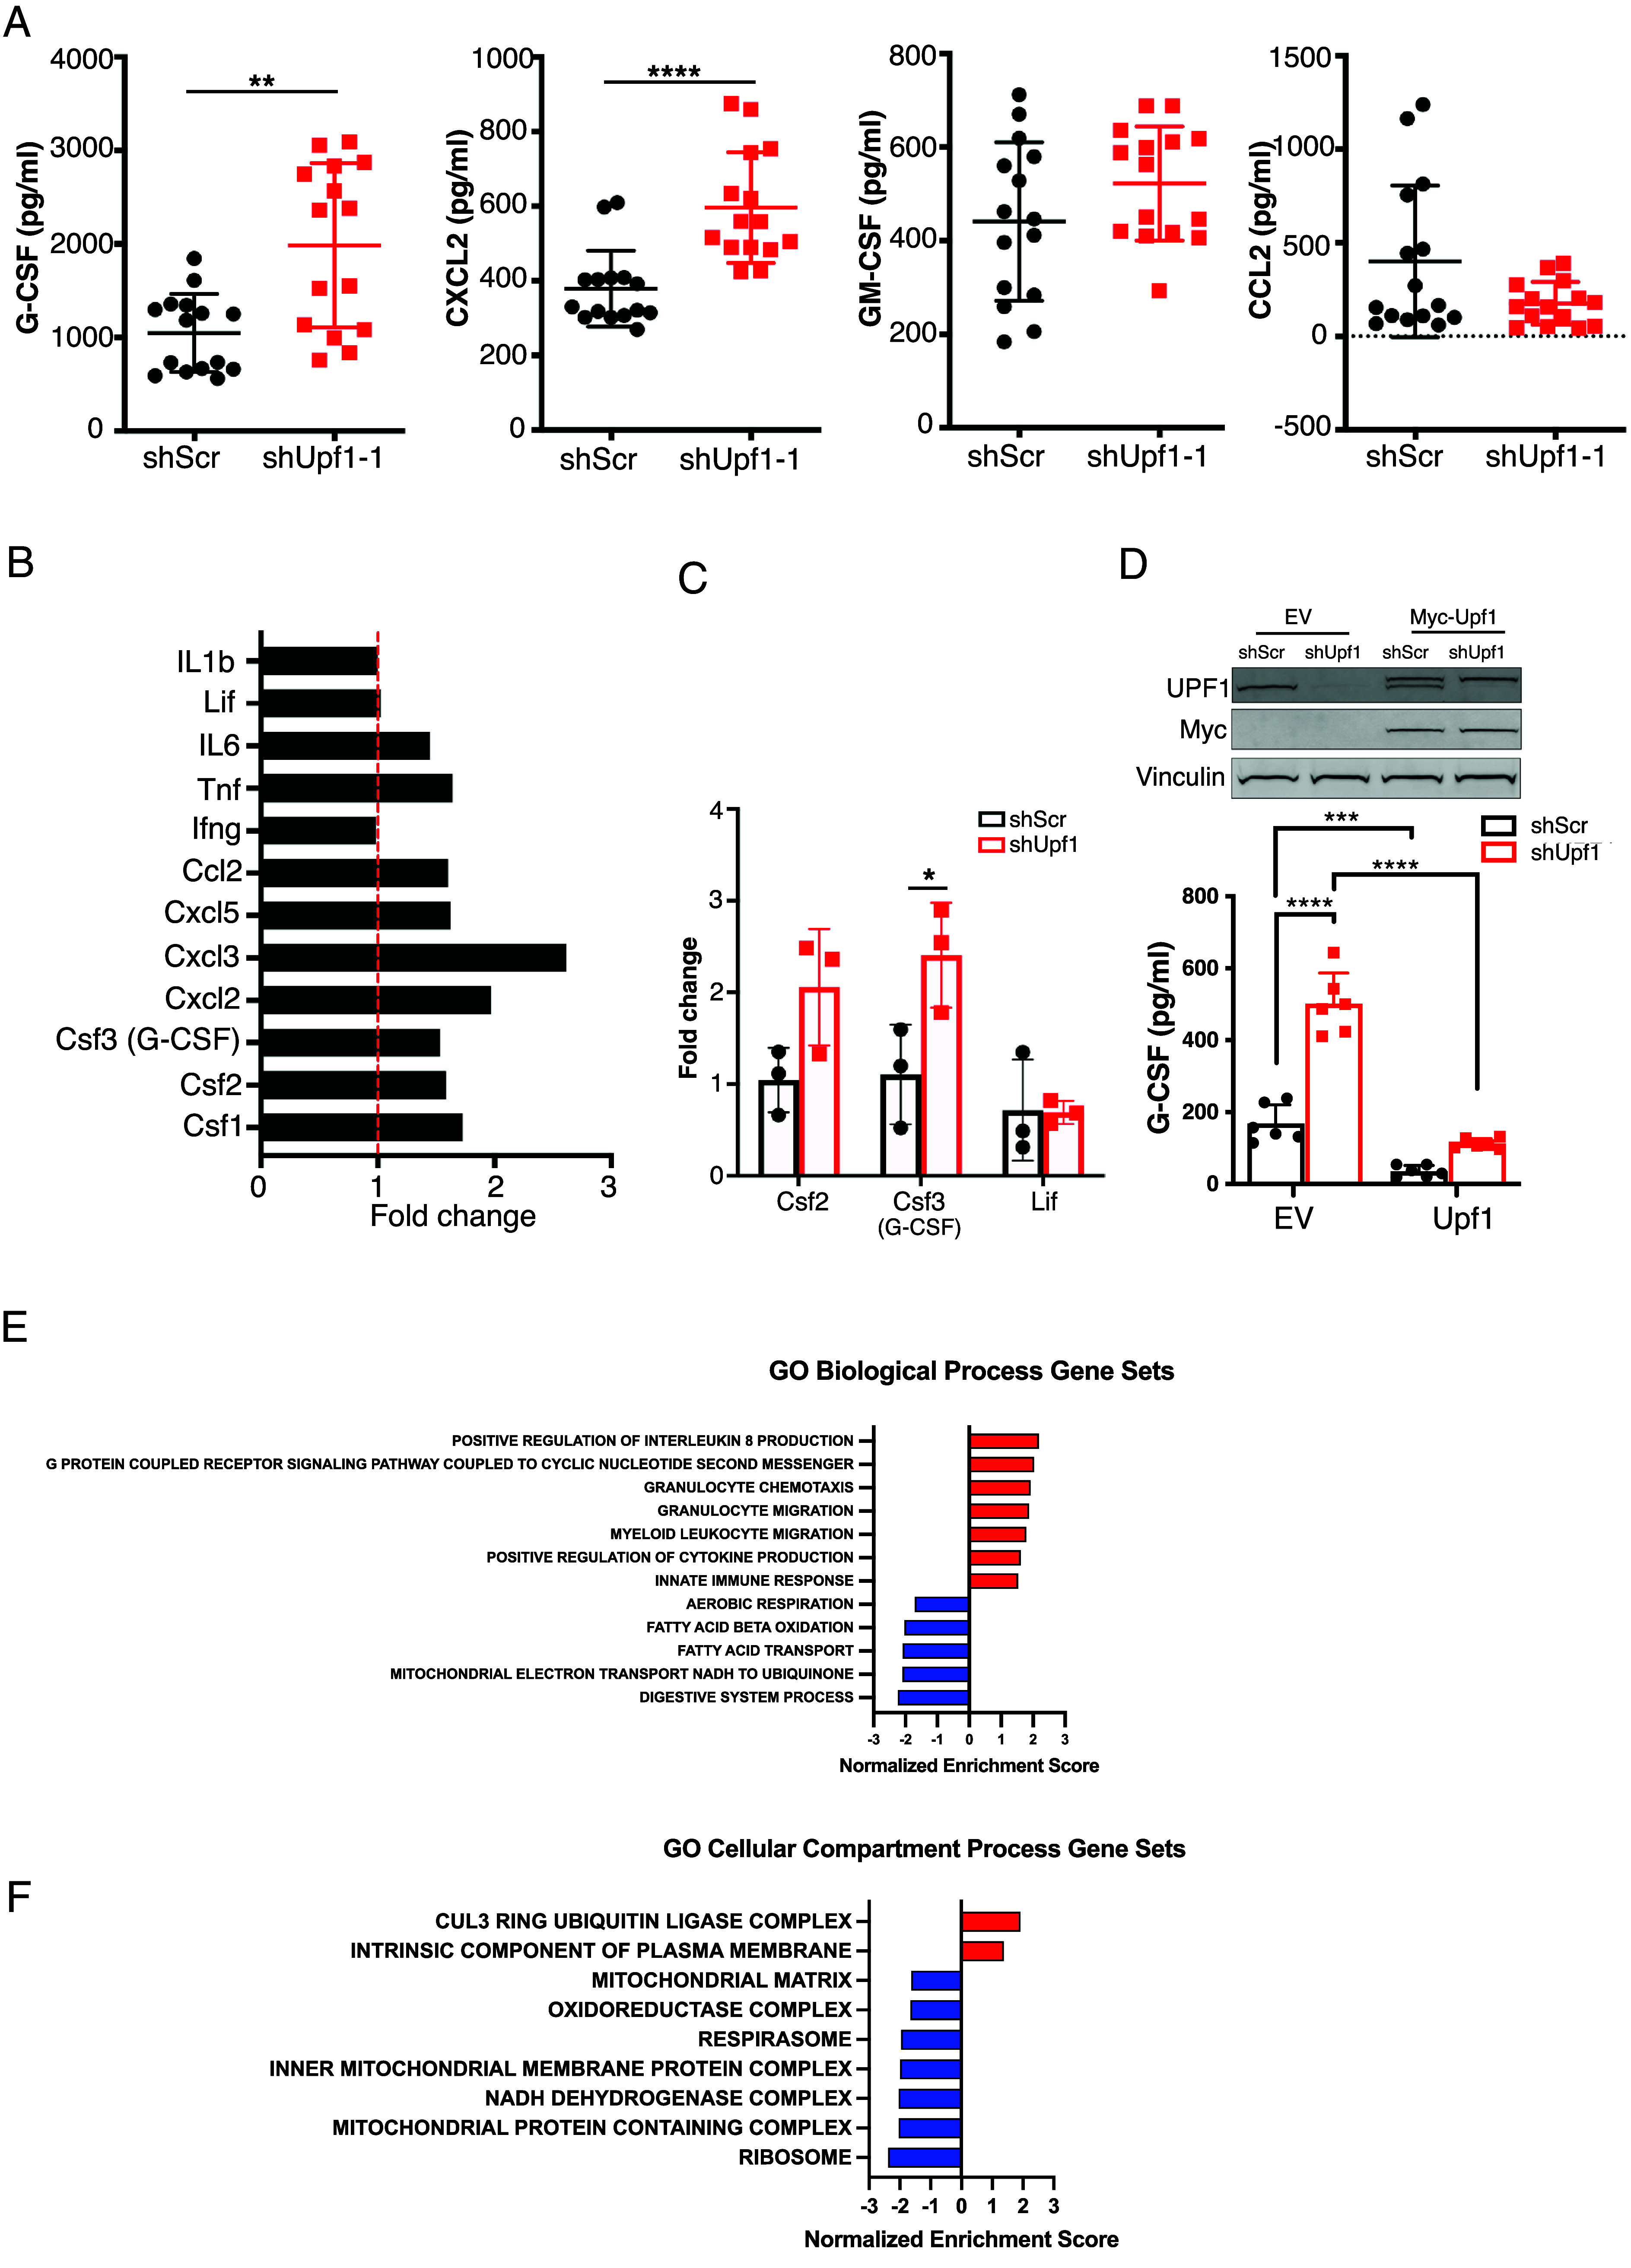
Upstream frameshift 1 (UPF1) is an RNA helicase involved in a number of mRNA regulatory processes including nonsense-mediated decay. Mutations in the UPF1 locus that reduce its expression have been associated with adenosquamous carcinoma of the pancreas, a particularly aggressive form of the disease. To determine the effect of Upf1 suppression in a murine model of pancreatic adenocarcinoma, we silenced with shRNA Upf1 in cells derived from an autochthonous tumor in an LSL-KrasG12D/+; Trp53R172H/+; Pdx-1Cre/+ mouse (KPC) and orthotopically implanted these cells in the pancreas of C57BL/6 mice. Tumors derived from Upf1-deficient cells were markedly larger than those derived from control cells, a difference observed only in immunocompetent mice. The immune infiltrate of Upf1-deficient tumors was enriched in myeloid-derived suppressor cells (MDSCs) and depleted of CD8+ cells compared to control KPC tumors. Upf1-deficient KPC cells secreted inflammatory cytokines including G-CSF and CXCL2, known to recruit MDSCs. Cytokine secretion from Upf1-deficient KPC cells was induced by increased levels of mitochondrial reactive oxygen species (ROS), which in turn were due to an increase in complex I activity in the electron transport chain. Thus, Upf1 helicase deficiency leads to increased mitochondrial complex I activity which produces ROS that signals for cytokine release that drives immune suppression and enhanced tumor growth.

Keywords: UPF1; complex I; mitochondrial ROS; myeloid-derived suppressor cells; tumor microenvironment.


Conflict of interest statement

Competing interests statement:The authors declare no competing interest.

Figures

Fig. 1.
Fig. 1.
Silencing Upf1 increases tumor size in a murine orthotopic PDAC model. (A) Upf1 KD in KPC cells with two different shRNAs was confirmed by immunoblot. (B) Representative images of tumors harvested at day 21 after orthotopic injection of 105 shScr or shUpf1-1 KPCs into the pancreas of C57BL/6 mice. (C) Weights of explanted tumors harvested after orthotopic injection as indicated in B. ***P < 0.001, ****P < 0.0001, by Mann–Whitney. (D) Cell proliferation of indicated KPC cell lines in 2D culture.
Fig. 2.
Fig. 2.
Upf1-deficient tumors manifest an immunosuppresive TME, lose their growth advantage in nude mice, and recapitulate the relationship between the immune TME and UPF1 expression in human disease. (A) Percentage of CD45+ cells in dissociated tumors 21 d after orthotopic injection. (BE) Percentage of CD45+ cells characterized by flow cytometry (FC) as B, G-MDSCs (CD45+CD11b+Ly-6GhighLy-6C+), C, M-MDSCs (CD45+CD11b+Ly-6GlowLy-6C+), D, CD4+ cells, E, CD8+ cells. ***P < 0.001, ****P < 0.0001, by Mann–Whitney. (F) Weight of tumors harvested at day 21 after orthotopic injection of 105 shScr or shUpf1-1 KPCs into the pancreas of Nude mice. (G) scRNA-Seq transcriptomic analysis of treatment-naive human primary pancreatic adenocarcinomas plotting percent of myeloid cells that demonstrate an MDSC transcriptomic signature as a function of average tumor cell UPF1 expression. Each point represents one sample. The correlation coefficient and significance are shown, which indicate an inverse correlation. Gray area depicts the 95% confidence region.
Fig. 3.
Fig. 3.
Upf1 deficiency is associated with increased secretion of inflammatory cytokines and bulk RNA-seq implicates associated mitochondrial dysfunction. (A) Representative cytokines (G-CSF/Csf3, CXCL2/MIP-2, GM-CSF/Csf2, CCL2/MCP-1) measured by Multiplex Luminex assays in the conditioned media of shScr and shUpf1 KPCs after 3 d in culture. (B) mRNA levels of indicated cytokines in KPCs were measured by RNAseq. The fold change in expression in shUpf1 relative to shScr cells is plotted. (C) mRNA levels of Csf2, Csf3, and Lif were measured by RT-PCR in shScr versus shUpf1 cells. (D) The increase in G-CSF in the conditioned media of shUpf1 cells measured by ELISA is abrogated by re-expression of Upf1. Immunoblot in the Upper panel shows silencing of Upf1 and re-expression of a myc-tagged Upf1. *P < 0.05, **P < 0.01, ***P < 0.001, ****P < 0.0001, by Mann–Whitney. (E and F) Significantly different (FDR < 0.05) MSigDB GO Biological Process and MSigDb GO Cellular Compartment gene sets in shUpf1 versus shScr KPC cell-based genes that were differentially expressed in RNA-Seq analysis.
Fig. 4.
Fig. 4.
The effect of Upf1 deficiency on the activities of ETC complexes I to IV, mitochondrial ROS, and phosphorylation and assembly of complex I. (A) Complex I, II, III, and IV activities measured in mitochondria isolated from shScr and shUpf1 KPC cells. (B and C) Mitochondrial ROS production measured with MitoSOX relative to the total mitochondrial mass measured with MitoTracker Green. Results are shown as arbitrary units of fluorescence. (B) Upf1 expression was stably rescued with a cDNA resistant to the short harpin (Upf1 cDNA) or an empty vector as a control (EV). (C) Cells were treated with the mitochondrial ROS scavenger MitoTEMPO (3 d, 1 μM) or the vehicle. (D) G-CSF levels measured by ELISA in cells with or without treatment with MitoTEMPO (3 d, 1 μM) or the vehicle. Results are normalized to the shScr. (AD) Bars indicate mean ± SEM. *P < 0.05, **P < 0.01, and ***P < 0.001 when compared by one-way ANOVA. (E) Immunocapture of Complex I from mitochondria isolated from shScr or shUpf1 cells analyzed by antiphosphoserine/threonine immunoblot. NDUFA6 immunoblot and a Coomassie-stained gel are shown as loading controls. (F) Representative Blue Native (BN) gels of mitochondrial membrane proteins blotted with the antibodies to the indicated subunits of OXPHOS complexes. The blots reveal complex I and In + IIIn (NDUFS1), complex III2 and In + IIIn (UQCRC2), and complex IV (COX5A). A VDAC immunoblot is shown as loading control.

References

    1. Halbrook C. J., Lyssiotis C. A., Pasca di Magliano M., Maitra A., Pancreatic cancer: Advances and challenges. Cell 186, 1729–1754 (2023). - PMC - PubMed
    1. Mukherji R., Debnath D., Hartley M. L., Noel M. S., The role of immunotherapy in pancreatic cancer. Curr. Oncol. 29, 6864–6892 (2022). - PMC - PubMed
    1. Ho W. J., Jaffee E. M., Zheng L., The tumour microenvironment in pancreatic cancer—Clinical challenges and opportunities. Nat. Rev. Clin. Oncol. 17, 527–540 (2020). - PMC - PubMed
    1. Bailey P., et al. , Genomic analyses identify molecular subtypes of pancreatic cancer. Nature 531, 47–52 (2016). - PubMed
    1. Andricovich J., et al. , Loss of KDM6A activates super-enhancers to induce gender-specific squamous-like pancreatic cancer and confers sensitivity to BET inhibitors. Cancer Cell 33, 512–526.e518 (2018). - PMC - PubMed

MeSH terms