. 2025 Jul 1;23(7):e3003248.
doi: 10.1371/journal.pbio.3003248. eCollection 2025 Jul.

Altered auditory feature discrimination in a rat model of Fragile X Syndrome

Affiliations

Altered auditory feature discrimination in a rat model of Fragile X Syndrome

D Walker Gauthier et al. PLoS Biol. .

Abstract

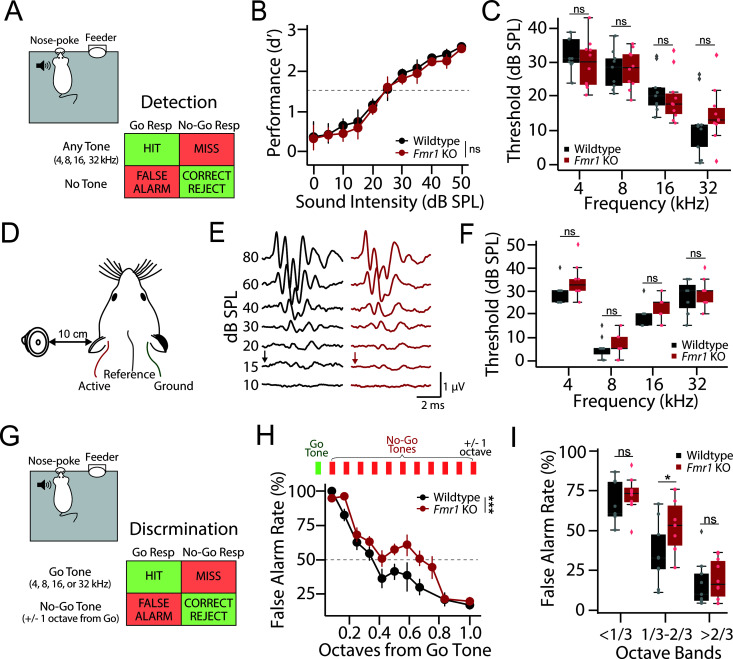
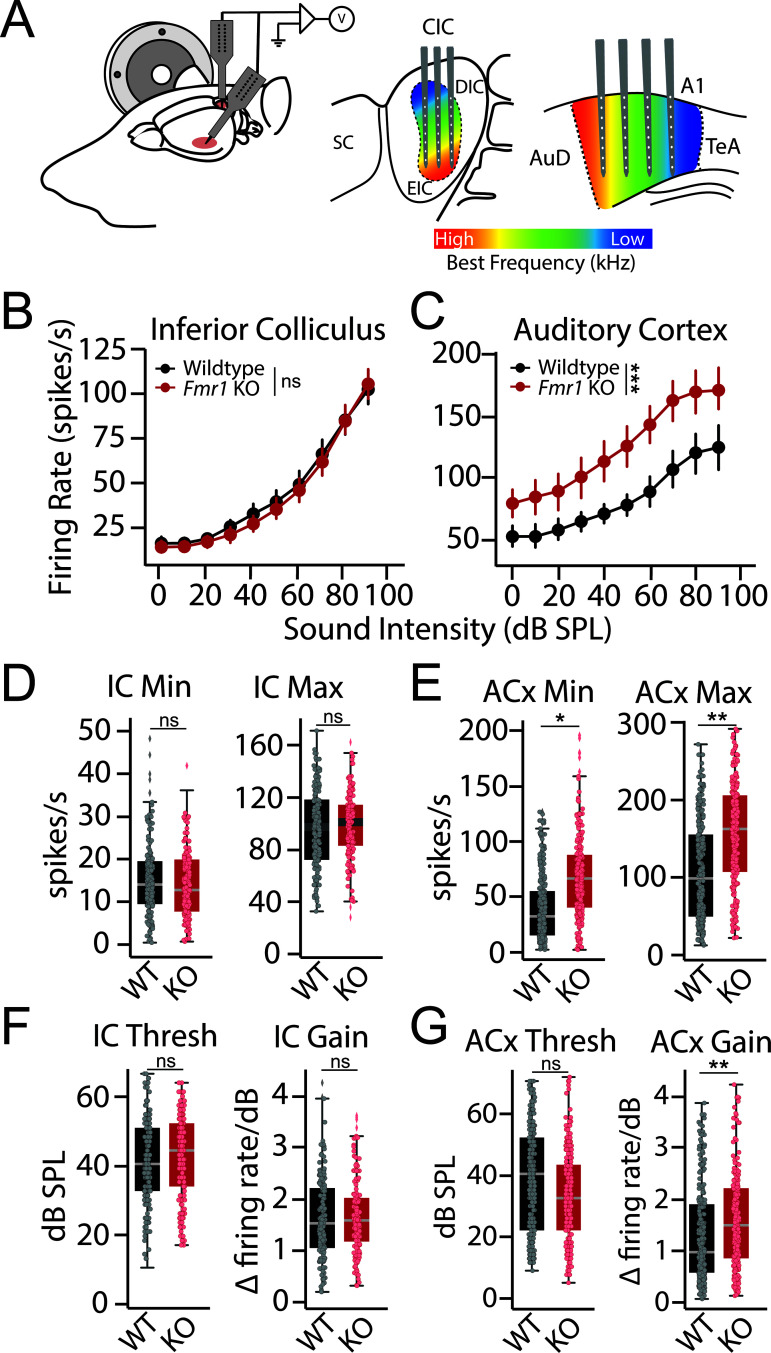
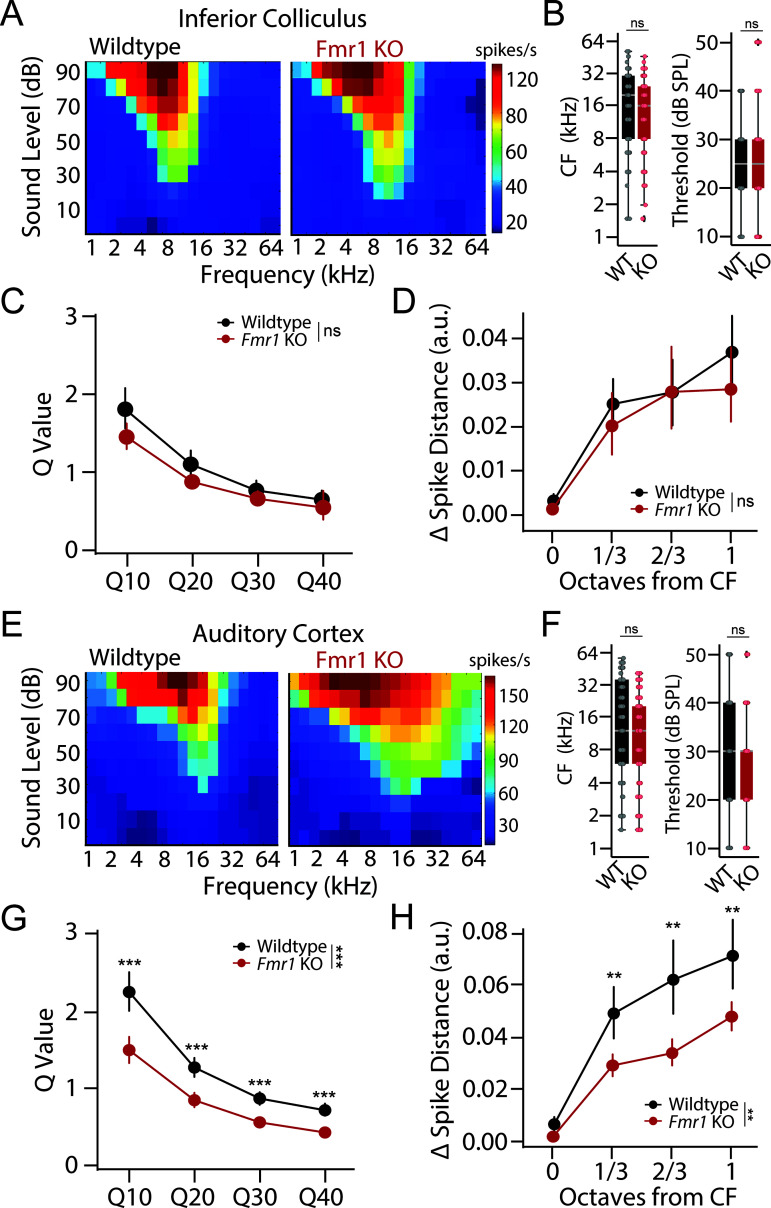
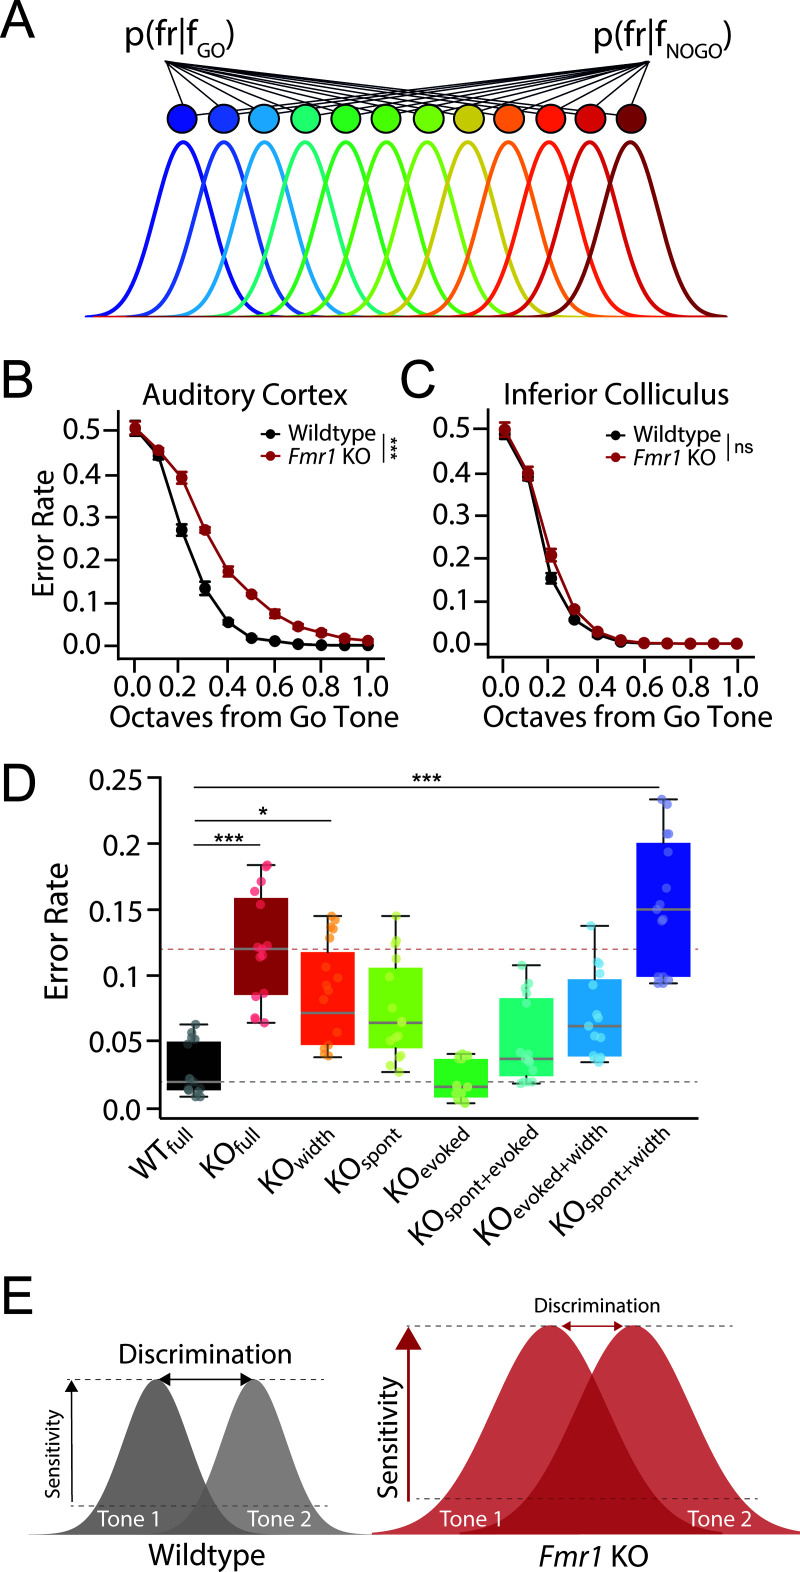
Atypical sensory processing, particularly in the auditory domain, is one of the most common and quality-of-life affecting symptoms seen in autism spectrum disorders (ASD). Fragile X Syndrome (FXS) is a leading inherited cause of ASD and a majority of FXS individuals present with auditory processing alterations. While auditory hypersensitivity is a common phenotype observed in FXS and Fmr1 knockout (KO) rodent models, it is important to consider other auditory coding impairments that could contribute to sound processing difficulties and disrupted language comprehension in FXS. We have shown previously that a Fmr1 KO rat model of FXS exhibits heightened sound sensitivity that coincided with abnormal perceptual integration of stimulus bandwidth, indicative of altered spectral processing. Frequency discrimination is a fundamental aspect of sound encoding that is important for a range of auditory processes, such as source segregation and speech comprehension, and disrupted frequency coding could thus contribute to a range of auditory issues in FXS and ASD. Here we explicitly characterized spectral processing deficits in male Fmr1 KO rats using an operant conditioning tone discrimination assay and in vivo electrophysiological recordings from the auditory cortex and inferior colliculus. We found that Fmr1 KO rats exhibited poorer frequency resolution, which corresponded with neuronal hyperactivity and broader frequency tuning in auditory cortical but not collicular neurons. Using an experimentally informed population model, we show that these cortical physiological differences can recapitulate the observed behavior discrimination deficits, with decoder performance being tightly linked to differences in cortical tuning width and signal-to-noise ratios. Together, these findings indicate that cortical hyperexcitability in Fmr1 KO rats may act to preserve signal-to-noise ratios and signal detection threshold at the expense of sound sensitivity and fine feature discrimination, highlighting a potential mechanistic locus for a range of auditory behavioral phenotypes in FXS.


Conflict of interest statement

The authors have declared that no competing interests exist.

Figures

Fig 1
Fig 1. Normal tone detection but impaired discrimination in Fmr1 KO rats.
(A) Schematic of Go/No-Go operant tone detection task. 9 wildtype (black) and 10 Fmr1 KO (red) rats were trained to report the detection of any tone burst (HIT), with failure to do so resulting in a MISS. On 30% of trials no sound was presented (catch trials). Responding on catch trials resulted in a false alarm (FA), while refraining from responding resulted in a correct rejection (CR). (B) Average tone detection performance across animals for all tone frequencies (4, 8, 16, and 32 kHz). Detection performance was comparable between wildtype (black) and Fmr1 KO (red) animals. (C) Behavioral detection thresholds for each tone frequency using a criterion of d′ = 1.5 (dashed line in Fig 1B). No genotype difference was observed at any test frequency. (D) Schematic of auditory brainstem response (ABR) recording setup. (E) Representative ABR waveforms from a wildtype (black) and Fmr1 KO (red) rat. ABR threshold was defined as the lowest intensity that evoked a discernable ABR waveform (black and red arrows) (F) No difference in ABR thresholds between wildtype (black) and Fmr1 KO (red) rats was observed at any sound frequency tested. (G) Schematic of Go/No-Go operant discrimination task. In this task, rats were trained to report the detection of a single Go-tone frequency (4, 8, 16, or 32 kHz) and inhibit their response to a No-Go tone either 1 octave above or below the Go tone. (H) Fine-frequency discrimination task where No-Go tone frequency was varied in 1/12 octave steps from Go tone. Top: Schematic showing the addition of multiple octave steps between the Go and No-Go tones (1/12 of an octave per step). Bottom: FA rate as a function of No-Go tone frequency in wildtype (black) and Fmr1 KO (red) rats. (I) FA rates grouped by 1/3 octaves from Go showing a significant reduction in Fmr1 KO performance only in the optimally difficult middle band, while performance is comparable at the most difficult and easy 1/3 octave bands. Box plots represent the median, 25th, and 75th percentiles. Whiskers represent the minimum and maximum values except for outliers. Boxplots dots represent individual animals. All other values are means ± SEM. *p < 0.05, ***p < 0.001, ns = not significant. Source data for panels C, F, and I are in S1 Data, Fig 1 sheet.
Fig 2
Fig 2. Altered cortical response properties in Fmr1 KO rats.
(A) Schematic of recording set-up. Simultaneous recordings with multichannel electrodes were made from across the tonotopic axis of contralateral auditory cortex (ACx) and inferior colliculus (IC) of 5 wildtype and 5 Fmr1 KO rats. Recordings were made with single shank linear silicon probes that spanned the dorsal-ventral axis of the IC or ACx, with multiple penetrations being made at different positions along the rostral-caudal axis of each area. (B–C) Rate level functions showing relationship between firing rate and sound intensity at characteristic frequency (CF) for each multi-unit cluster in the (B) IC and (C) ACx of wildtype (black) and Fmr1 KO (red) rats. (D–E) Interpolated response minimum (Min) and maximum (Max) from (D) IC and (E) ACx response functions. (F–G) Interpolated response threshold (Thresh) and slope (Gain) from (F) IC and (G) ACx response functions. Box plots represent the median, 25th, and 75th percentiles. Whiskers represent the minimum and maximum values except for outliers. Boxplot dots represent individual multiunit clusters. All other values are means ± SEM. *p < 0.05, **p < 0.01, ***p < 0.0001, ns = not significant. Data and code underlying this figure can be found at http://doi.org/10.5281/zenodo.15559344. Source data for panels D–G are in S1 Data, Fig 2 sheet.
Fig 3
Fig 3. Broader frequency tuning in auditory cortex of Fmr1 KO rats despite unaltered subcortical tuning properties.
(A) Example tuning curves recorded from the inferior colliculus (IC) of a wildtype (left) and Fmr1 KO (right) rat. Each cell represents 30 trials for a given frequency-intensity combination. (B) Distributions of characteristic frequency (CF, left) and minimum threshold (right) for multi-unit clusters from the IC of wildtype (black) and Fmr1 KO (red) rats. (C) Q-value measure of tuning precision at 10, 20, 30, and 40 dB above response threshold for IC units. (D) Neural discriminability of sound frequency in IC as assessed by changes in spike train dissimilarity (Δ Spike-Distance) in response to CF and neighboring tone frequencies. (E) Example tuning curves recorded from the auditory cortex (ACx) of a wildtype (left) and Fmr1 KO (right) rat. Each cell represents 30 trials for a given intensity frequency combination. (F) Distributions of characteristic frequency (CF, left) and minimum threshold (right) for multi-unit clusters from the ACx of WT (black) and Fmr1 KO (red) rats. (G) Q-value measure of tuning precision at 10, 20, 30, and 40 dB above response threshold for ACx units. Lower Q-values in the ACx of Fmr1 KO rats are indicative of broader tuning. (H) Neural discriminability of sound frequency as assessed by changes in spike train dissimilarity (Δ Spike-Distance) in response to CF and neighboring tone frequencies. Decreased Spike-Distance in the ACx of Fmr1 KO rats is indicative of poorer neural discriminability. Box plots represent the median, 25th, and 75th percentiles. Whiskers represent the minimum and maximum values except for outliers. Boxplots dots represent individual multiunit clusters. All other values are means ± SEM. **p < 0.01, ***p < 0.0001, ns = not significant. Data and code underlying this figure can be found at http://doi.org/10.5281/zenodo.15559344. Source data for panels B and F are in S1 Data, Fig 3 sheet.
Fig 4
Fig 4. Modeling Fmr1 KO discrimination deficits using a population decoder.
(A) Schematic of Bayesian decoding from a simulated network of tonotopically organized neurons whose tuning parameters are derived from the population data recorded from the auditory cortex (ACx) or inferior colliculus (IC) of either WT or Fmr1 KO rats. (B–C) Error rates from model readout layer as a function of octave distance using tuning parameters from the (B) ACx or (C) IC of WT (black) or Fmr1 KO (red) rats. (D) Decoder performance for No-Go tones 1/3–2/3 octave from Go tone as a function of model parameters in ACx. Error rate was determined for models using all WT (WTfull) or KO (KOfull) parameters, as well as for each unique combination of individual KO parameters for spontaneous firing rates (spont), peak sound-evoked firing rate (evoked), and tuning width (width). Changing model parameters significantly impacted decoder performance (Kruskal–Wallis Test, ***p < 0.0001), with KOfull (Dunn’s test, ***p < 0.0001), KOwidth (Dunn’s test, *p = 0.0144) and KOspont + width (Dunn’s test, ***p < 0.0001) permutations being significantly different from WTfull. Gray and pink dashed lines represent median WTfull and KOfull error rates. Box plots represent the median, 25th, and 75th percentiles. Whiskers represent the minimum and maximum values except for outliers. Boxplots dots represent separate model runs (10,000 repeats each). All other values are means ± SEM. *p < 0.05, **p < 0.01, ***p < 0.0001, ns = not significant. (E) Schematic summarizing results. Cortical gain enhancement in FXS may act to preserve signal-to-noise ratios and signal detection threshold at the expense of sound sensitivity and fine feature discrimination. Data and code underlying this figure can be found at http://doi.org/10.5281/zenodo.15559344. Source data for panel D are in S1 Data, Fig 4 sheet.

Update of

Similar articles

References

    1. Hagerman RJ, et al. Fragile X syndrome. Nat Rev Dis Primer. 2017;3:1–19. 10.1038/nrdp.2017.65 . - DOI - PubMed
    1. Rais M, Binder DK, Razak KA, Ethell IM. Sensory Processing Phenotypes in fragile X syndrome. ASN Neuro. 2018;10. doi: 10.1177/1759091418801092 . - DOI - PMC - PubMed
    1. Thye MD, Bednarz HM, Herringshaw AJ, Sartin EB, Kana RK. The impact of atypical sensory processing on social impairments in autism spectrum disorder. Dev Cogn Neurosci. 2018;29:151–67. doi: 10.1016/j.dcn.2017.04.010 . - DOI - PMC - PubMed
    1. Lovelace JW, Wen TH, Reinhard S, Hsu MS, Sidhu H, Ethell IM, et al. Matrix metalloproteinase-9 deletion rescues auditory evoked potential habituation deficit in a mouse model of fragile X syndrome. Neurobiol Dis. 2016;89:126–35. doi: 10.1016/j.nbd.2016.02.002 . - DOI - PMC - PubMed
    1. Lovelace JW, Ethell IM, Binder DK, Razak KA. Translation-relevant EEG phenotypes in a mouse model of fragile X syndrome. Neurobiol Dis. 2018;115:39–48. doi: 10.1016/j.nbd.2018.03.012 . - DOI - PMC - PubMed

MeSH terms

Substances