. 2025 Jul;18(893):eadv0970.
doi: 10.1126/scisignal.adv0970. Epub 2025 Jul 1.

A PKCη missense mutation enhances Golgi-localized signaling and is associated with recessively inherited familial Alzheimer's disease

Affiliations

A PKCη missense mutation enhances Golgi-localized signaling and is associated with recessively inherited familial Alzheimer's disease

Maria Celeste Gauron et al. Sci Signal. 2025 Jul.

Abstract

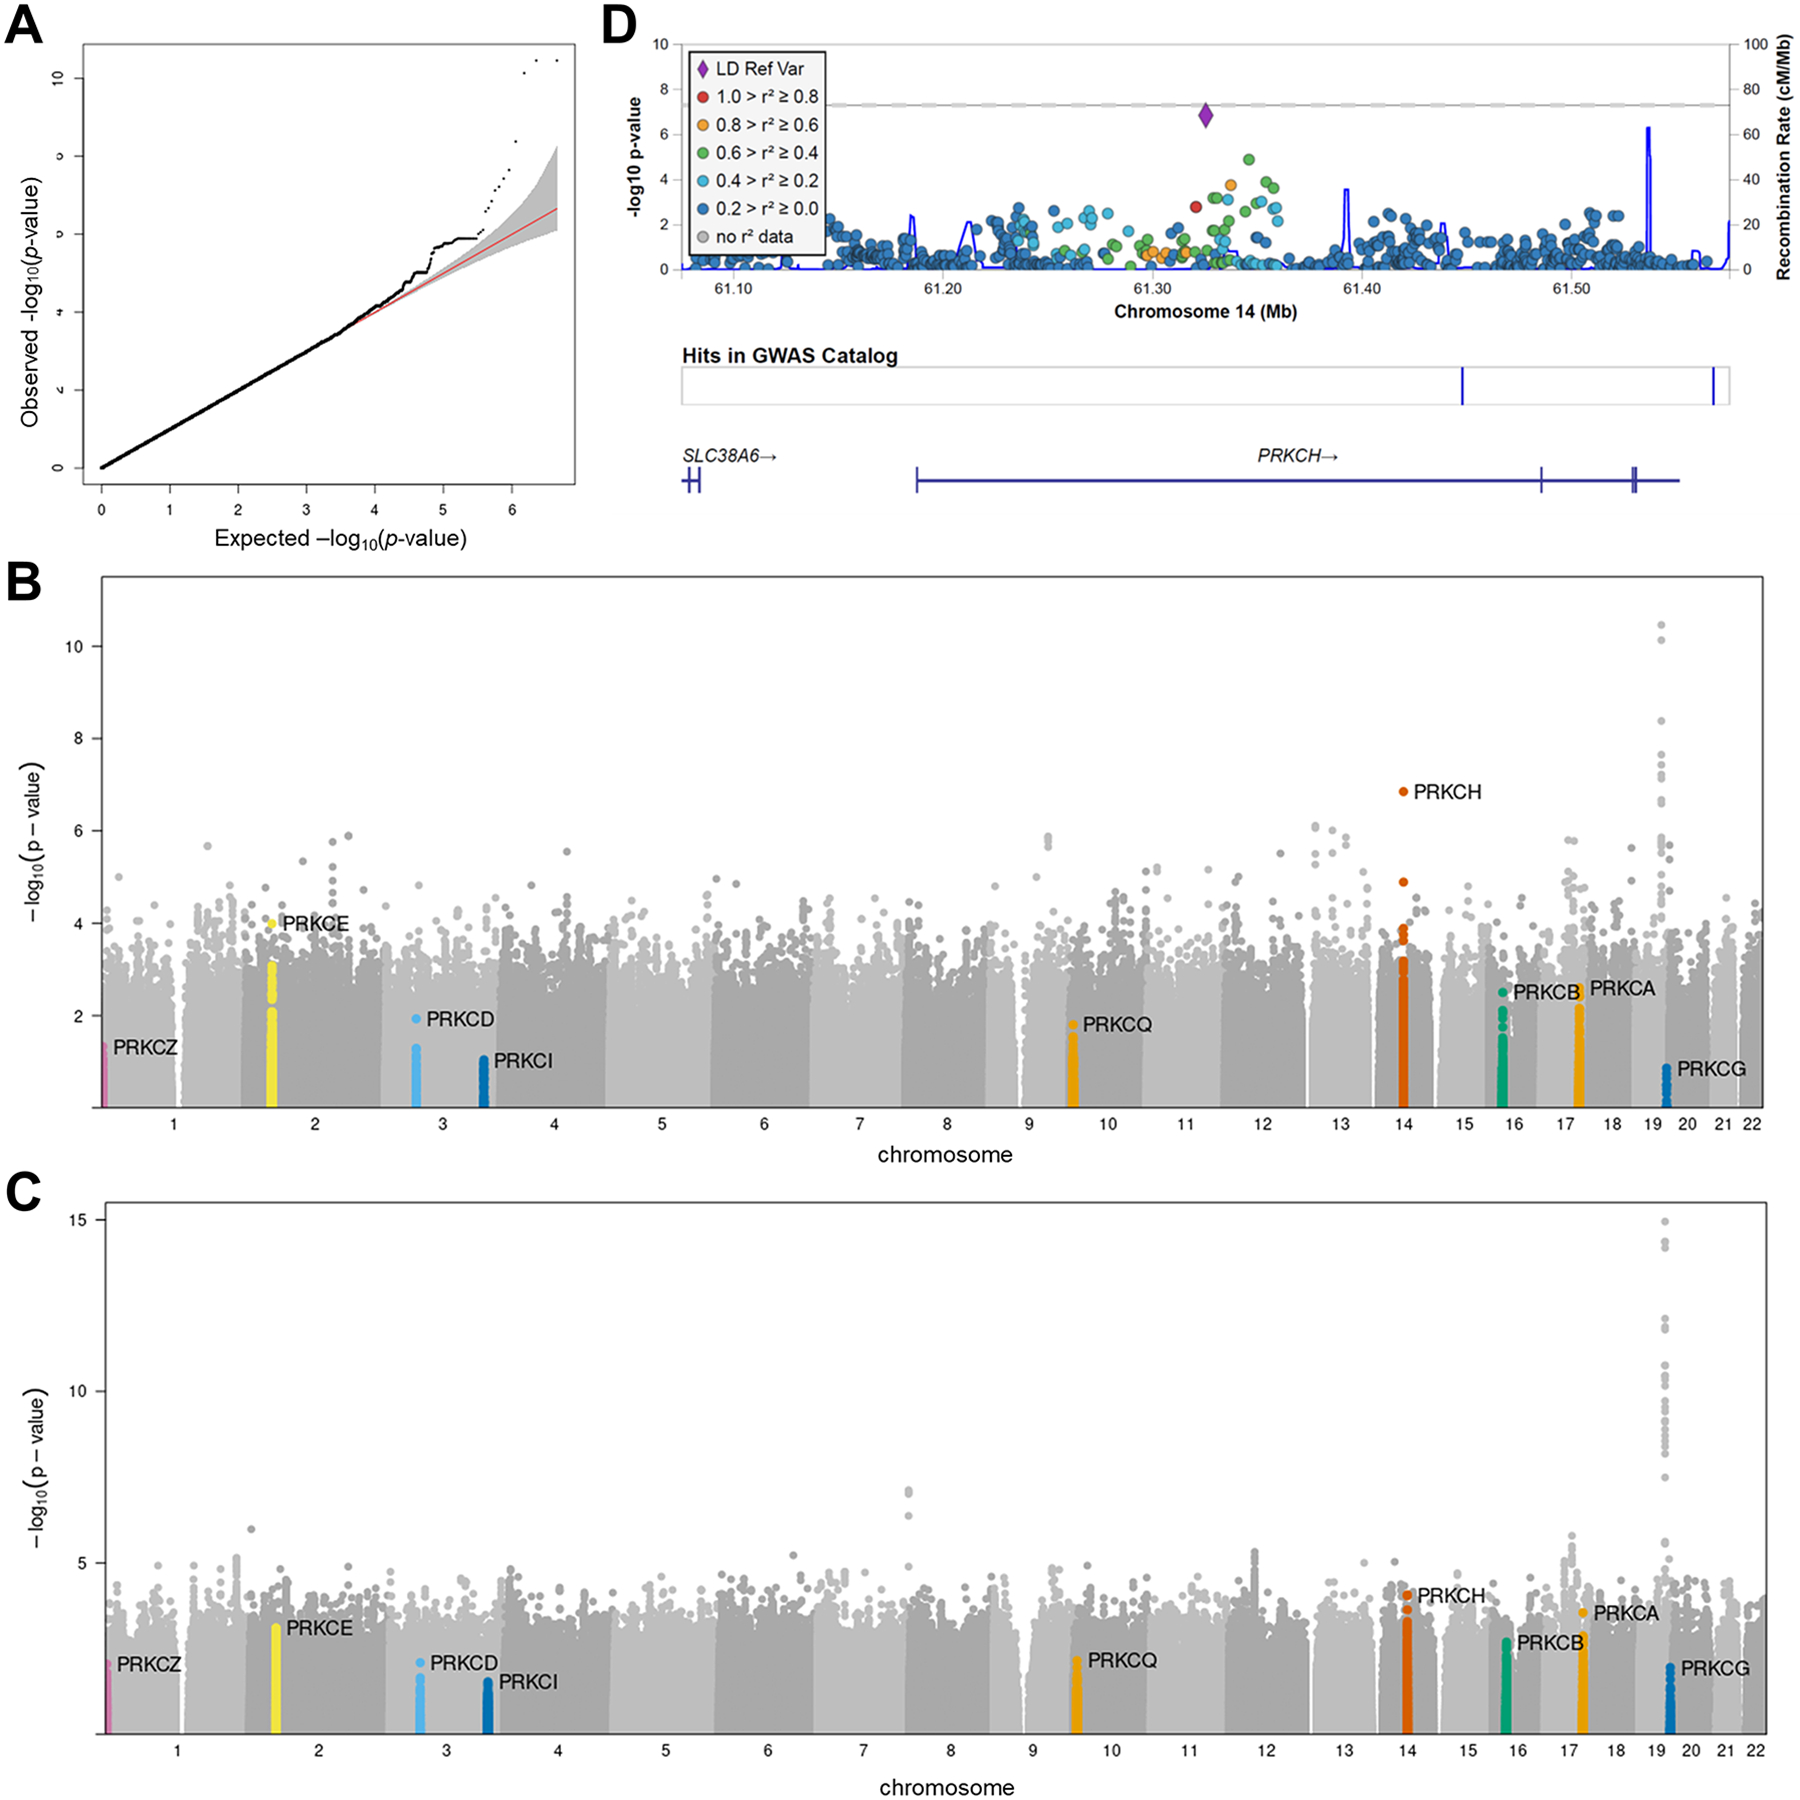
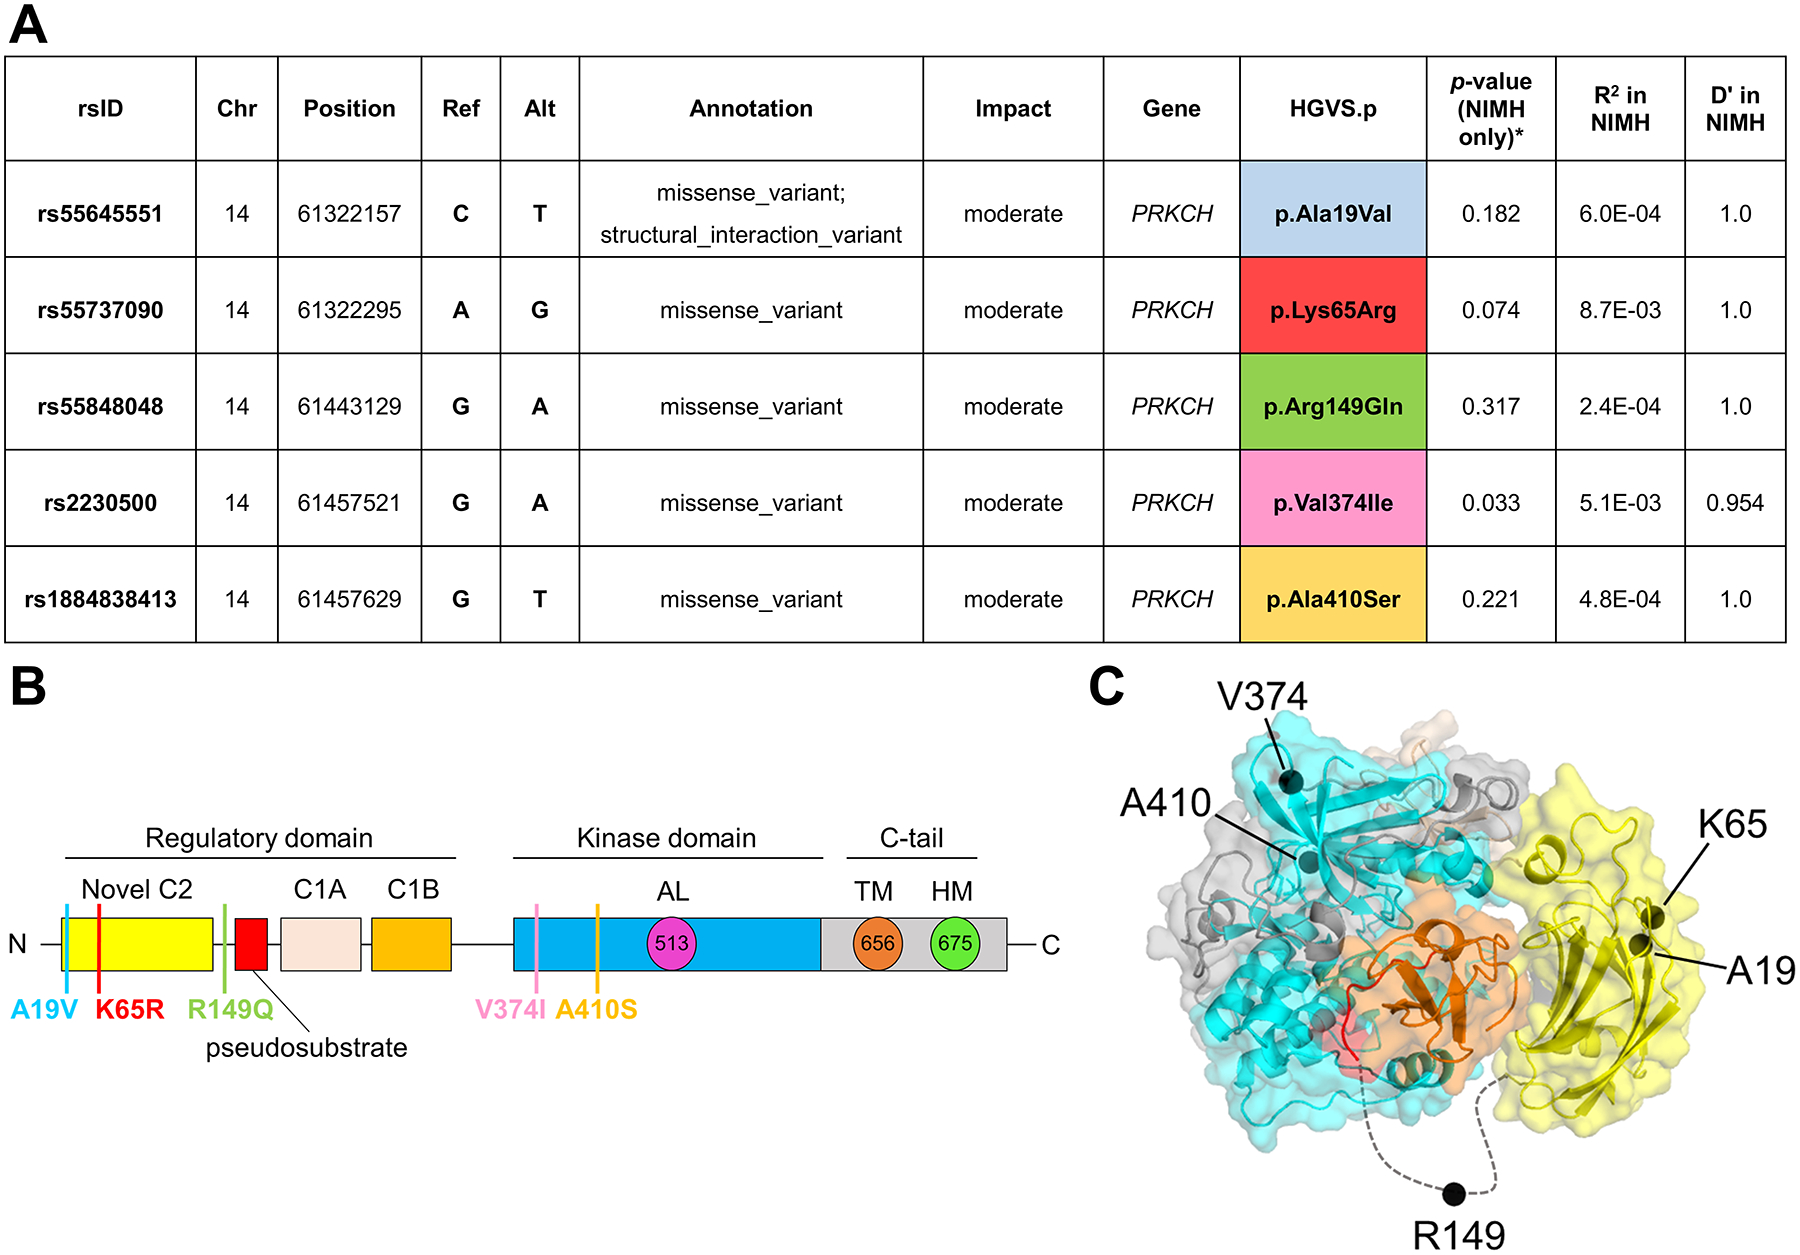
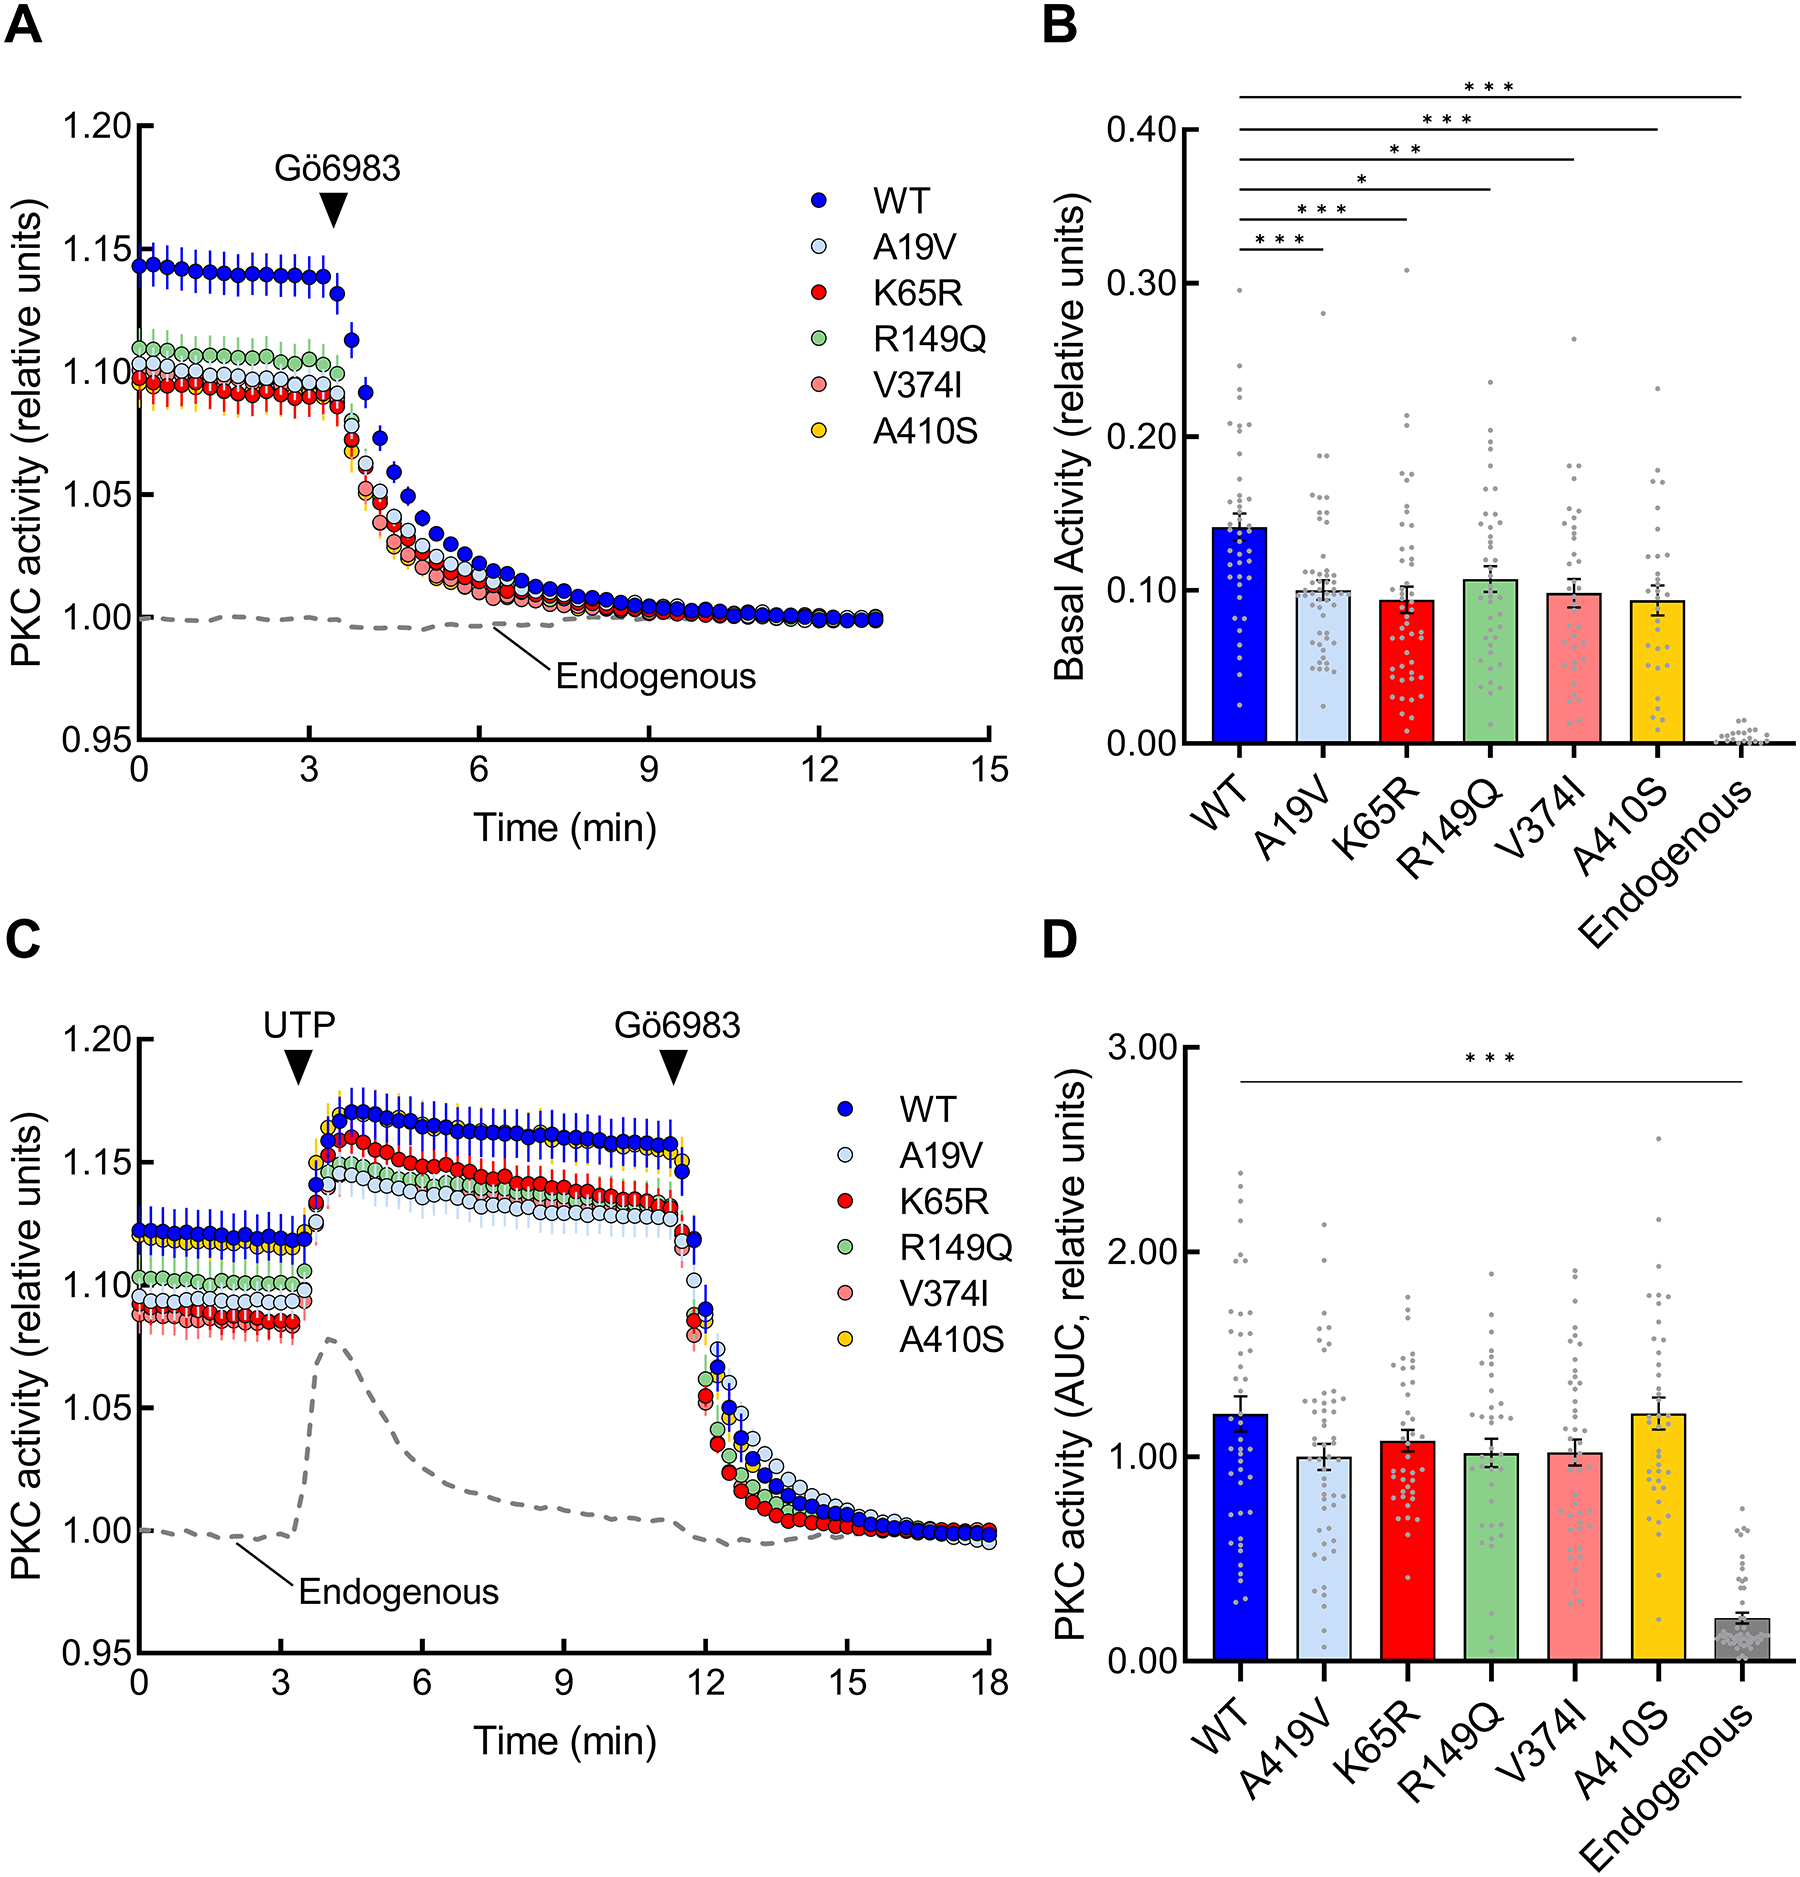
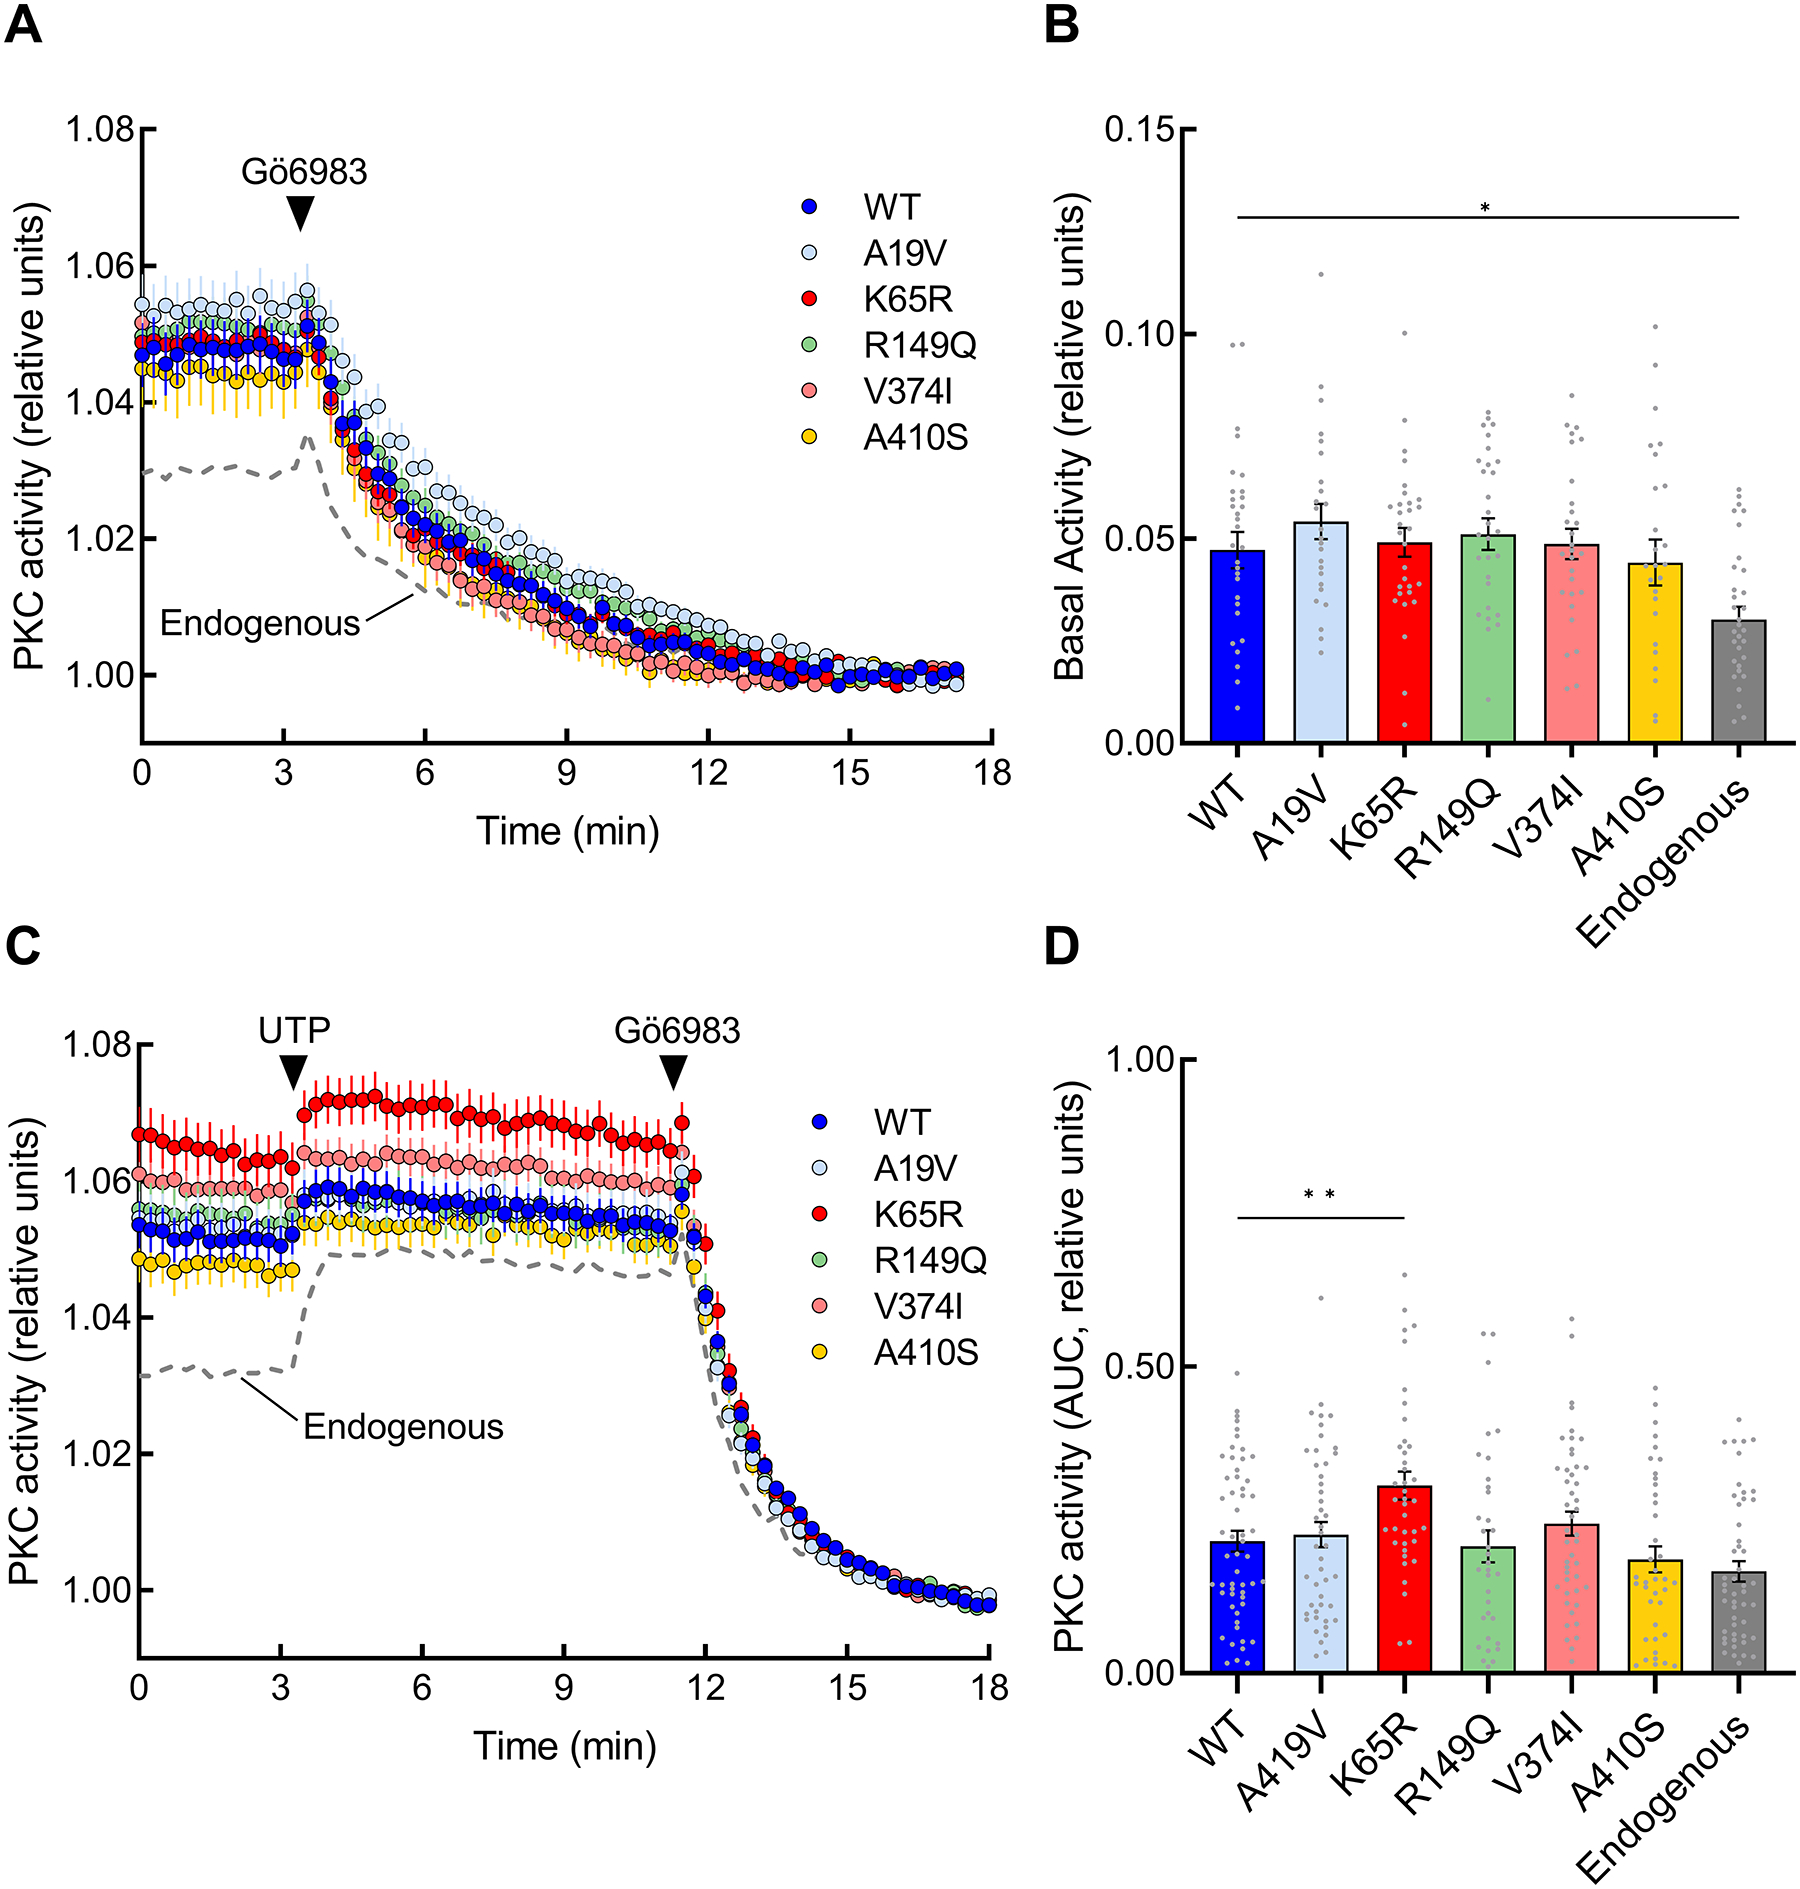
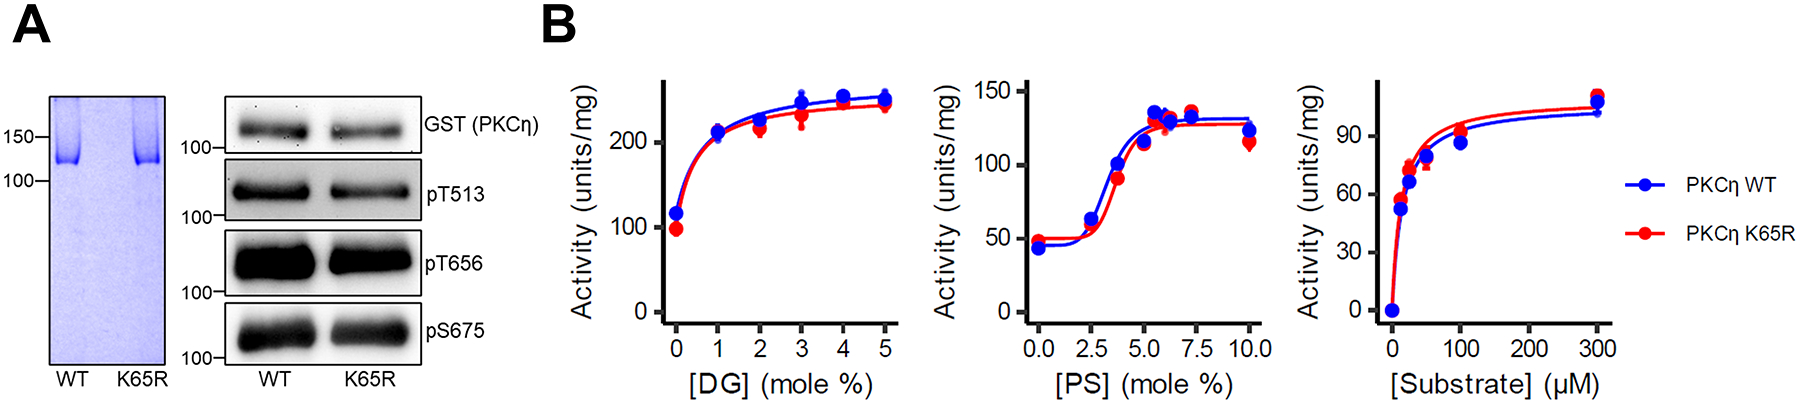
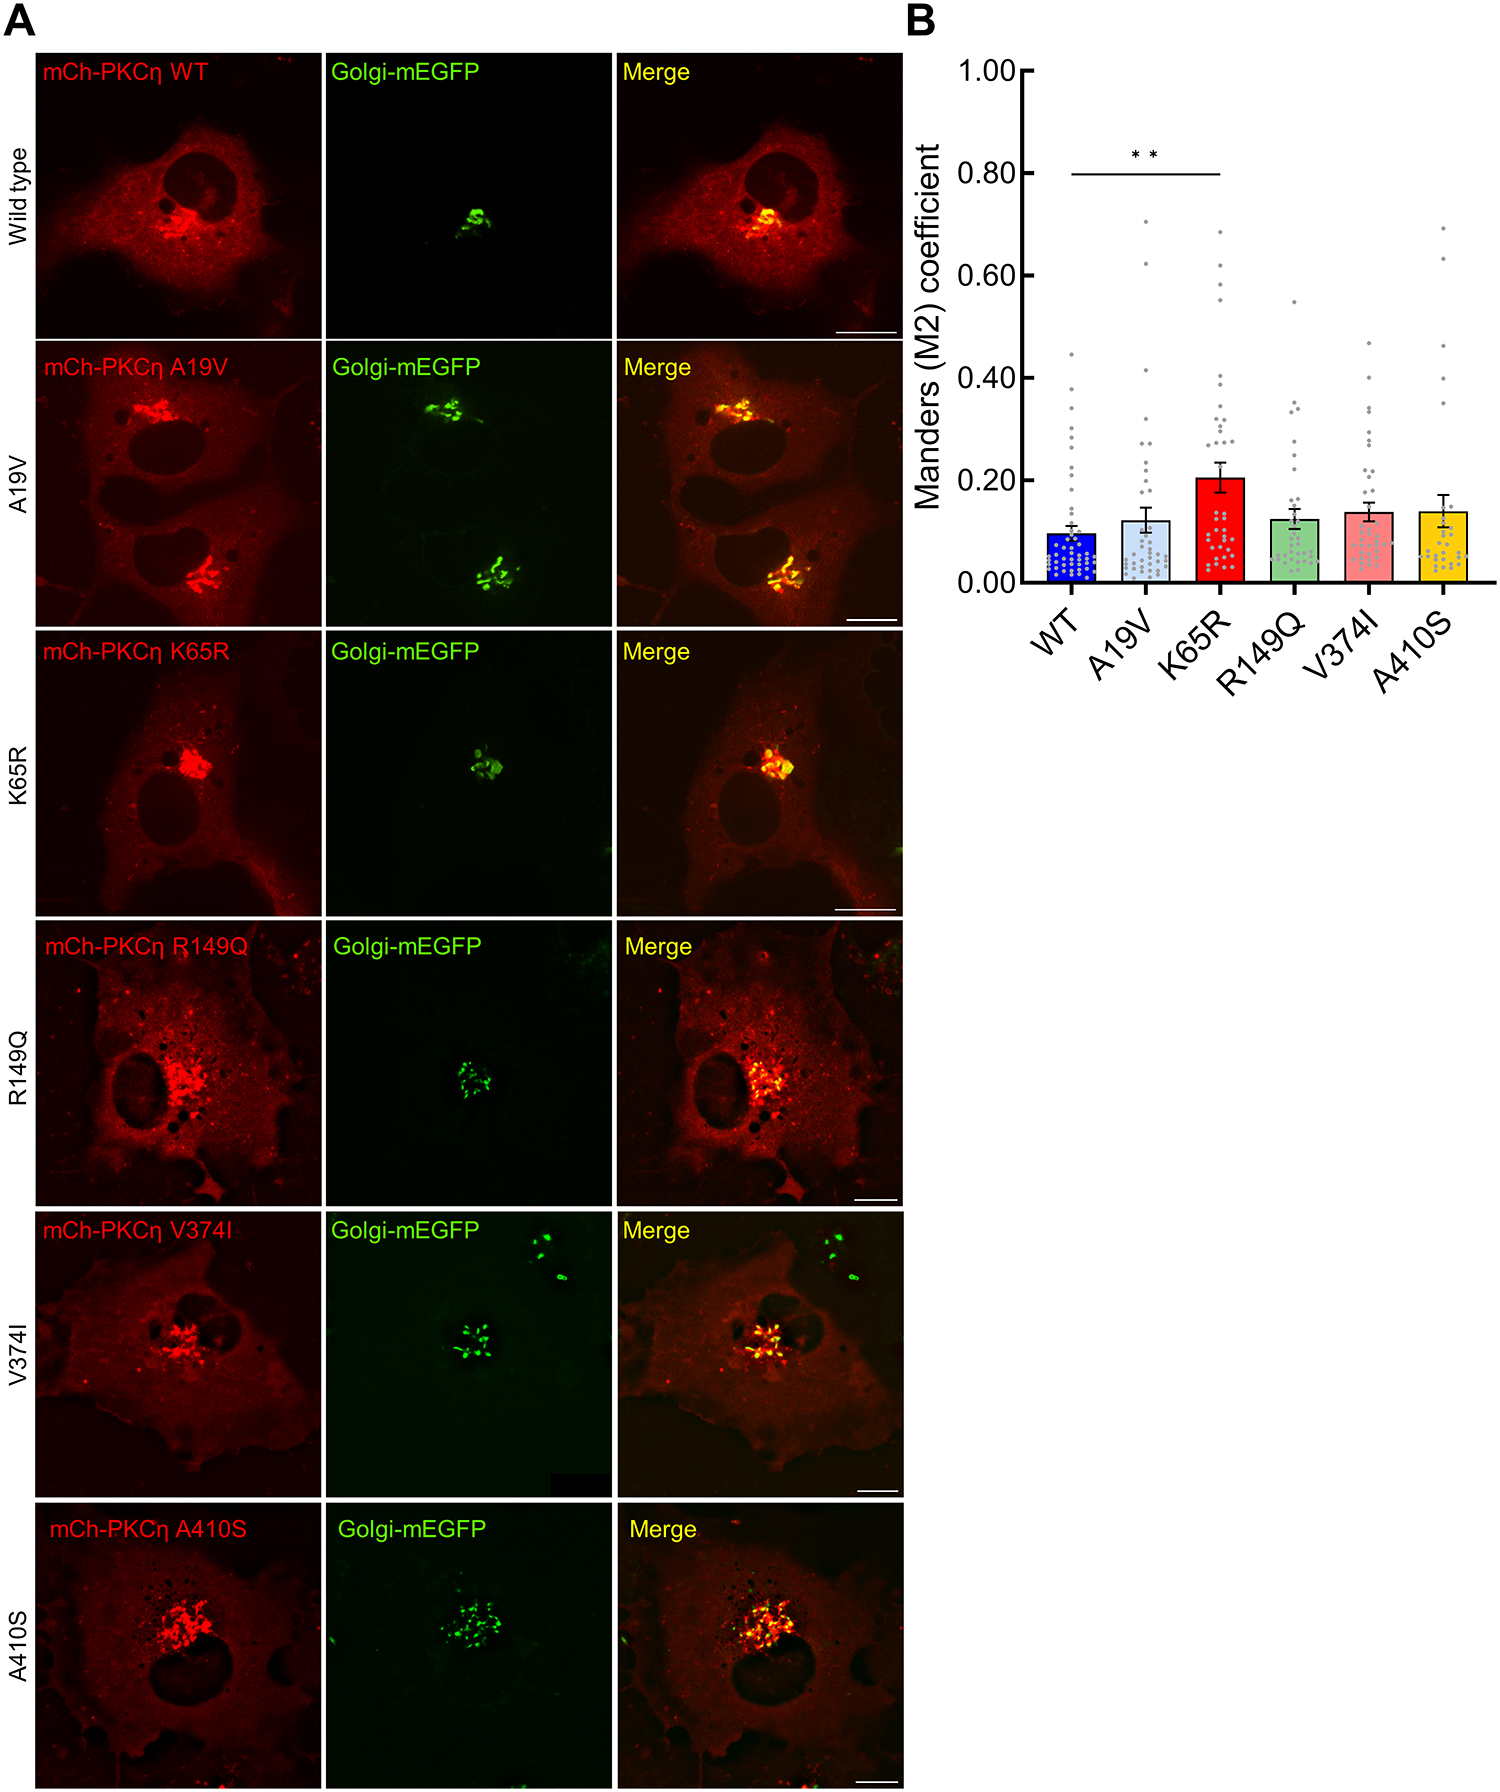
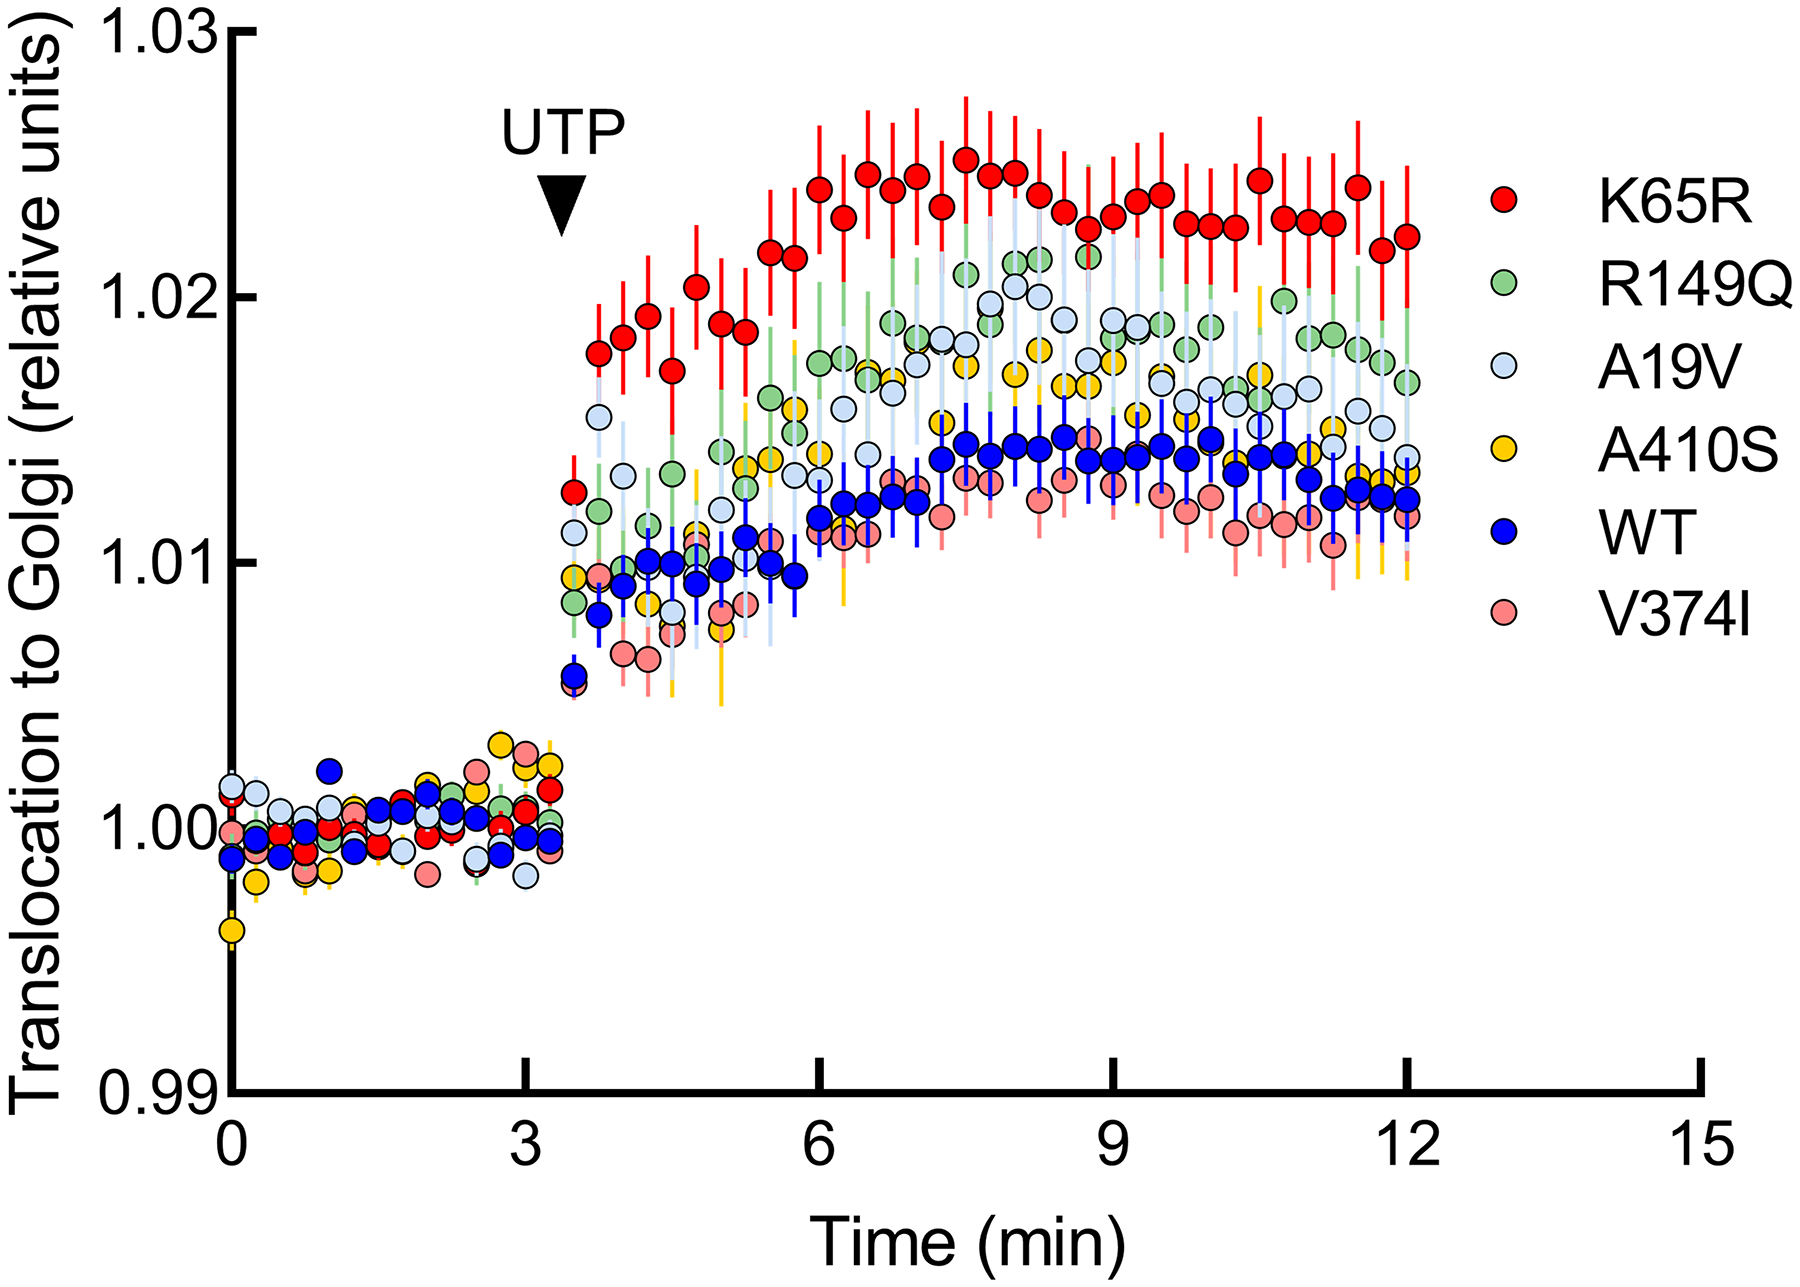
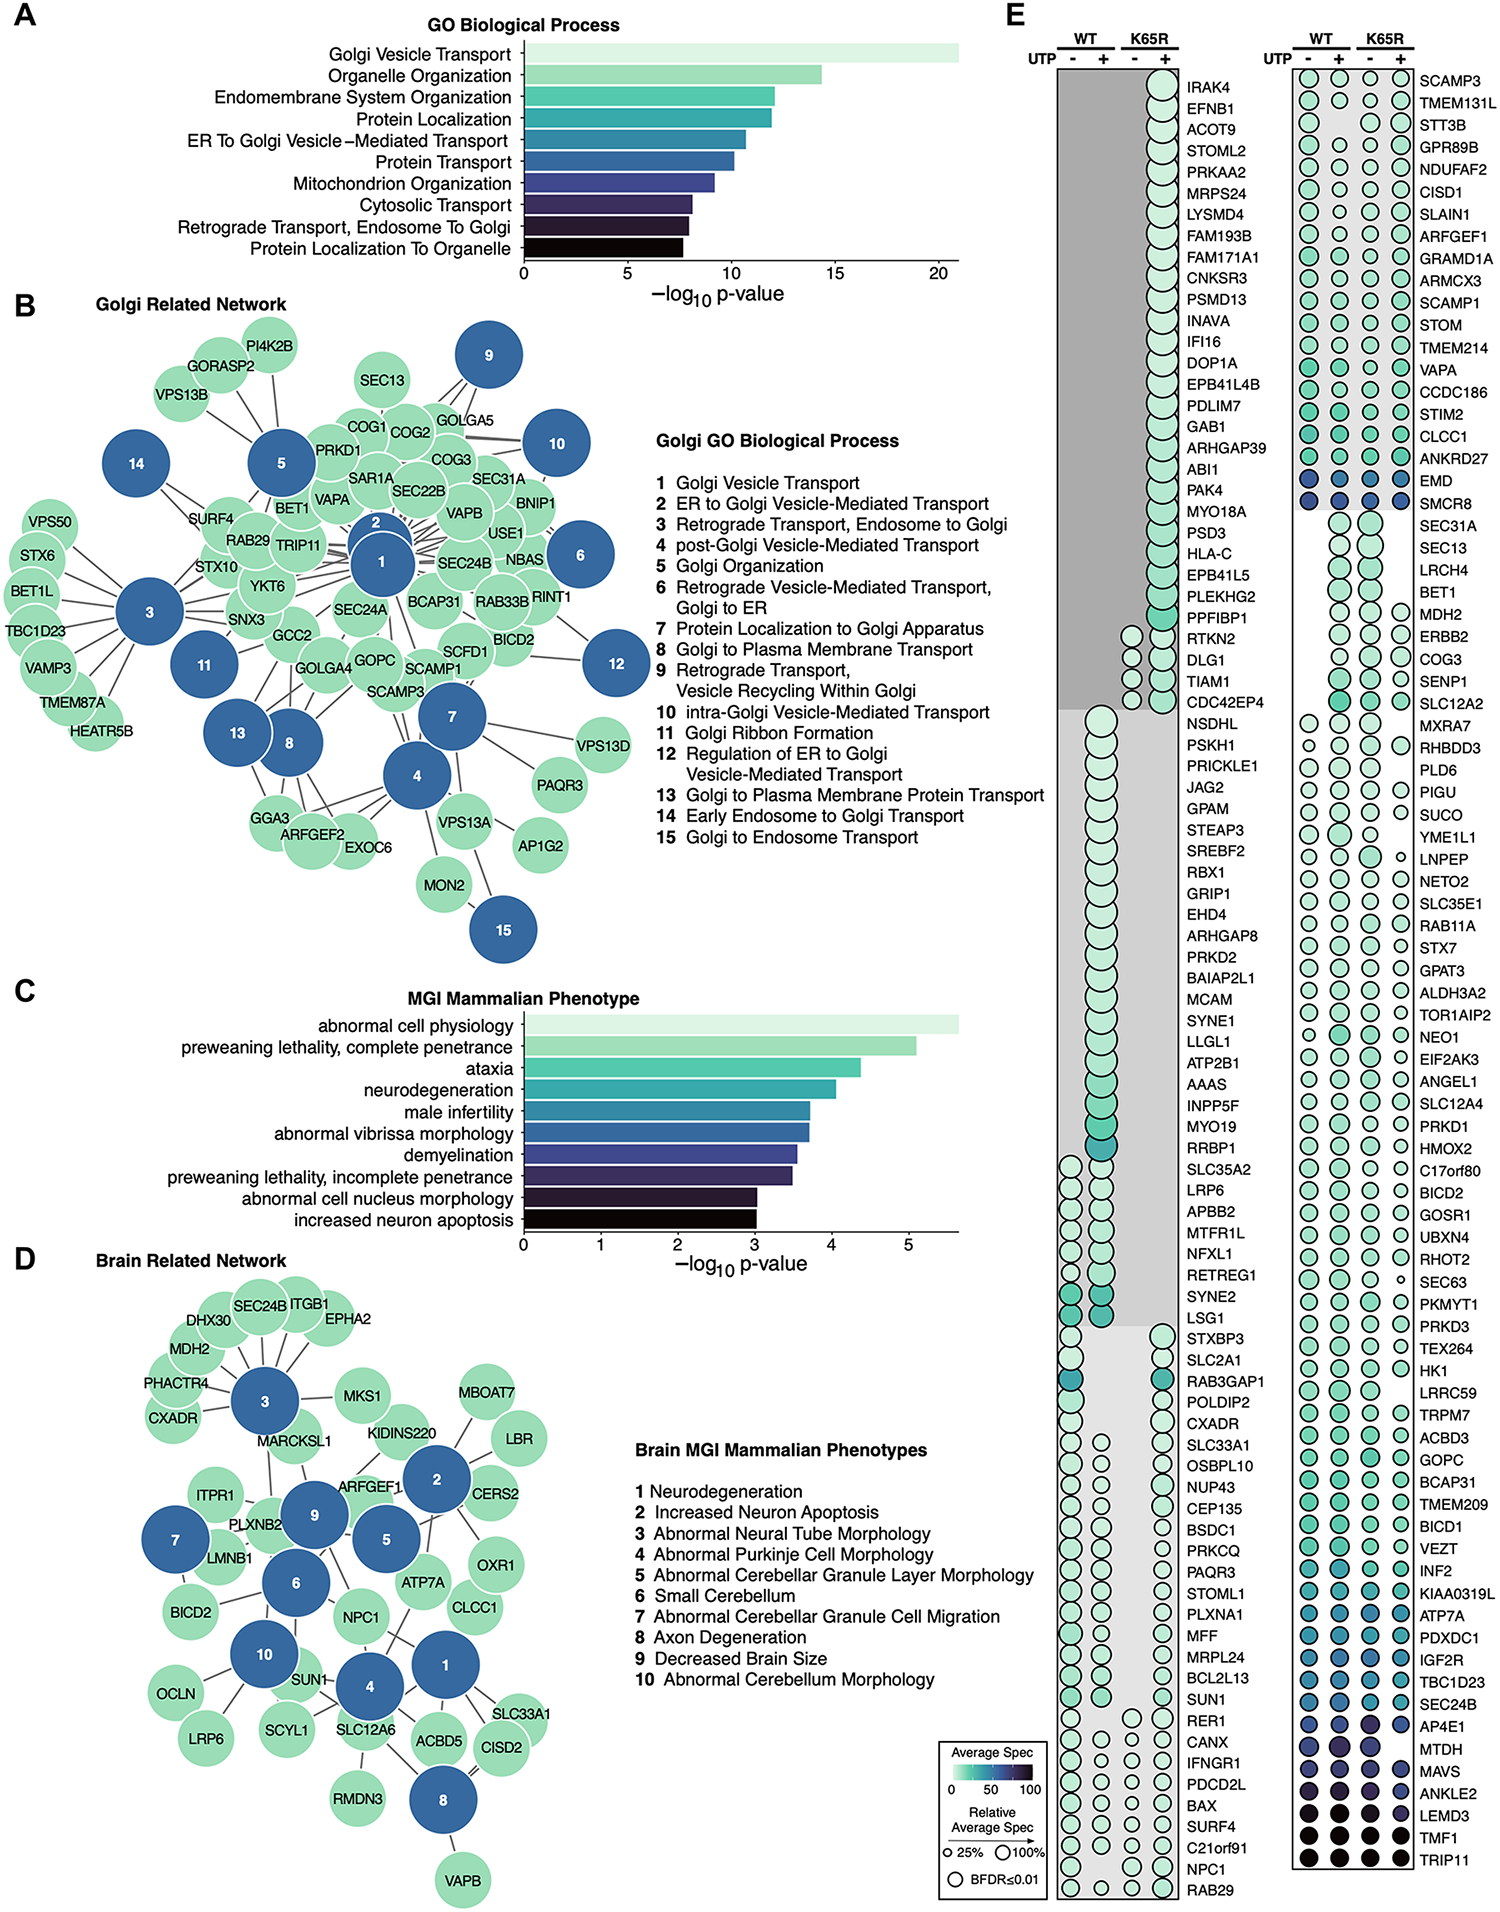
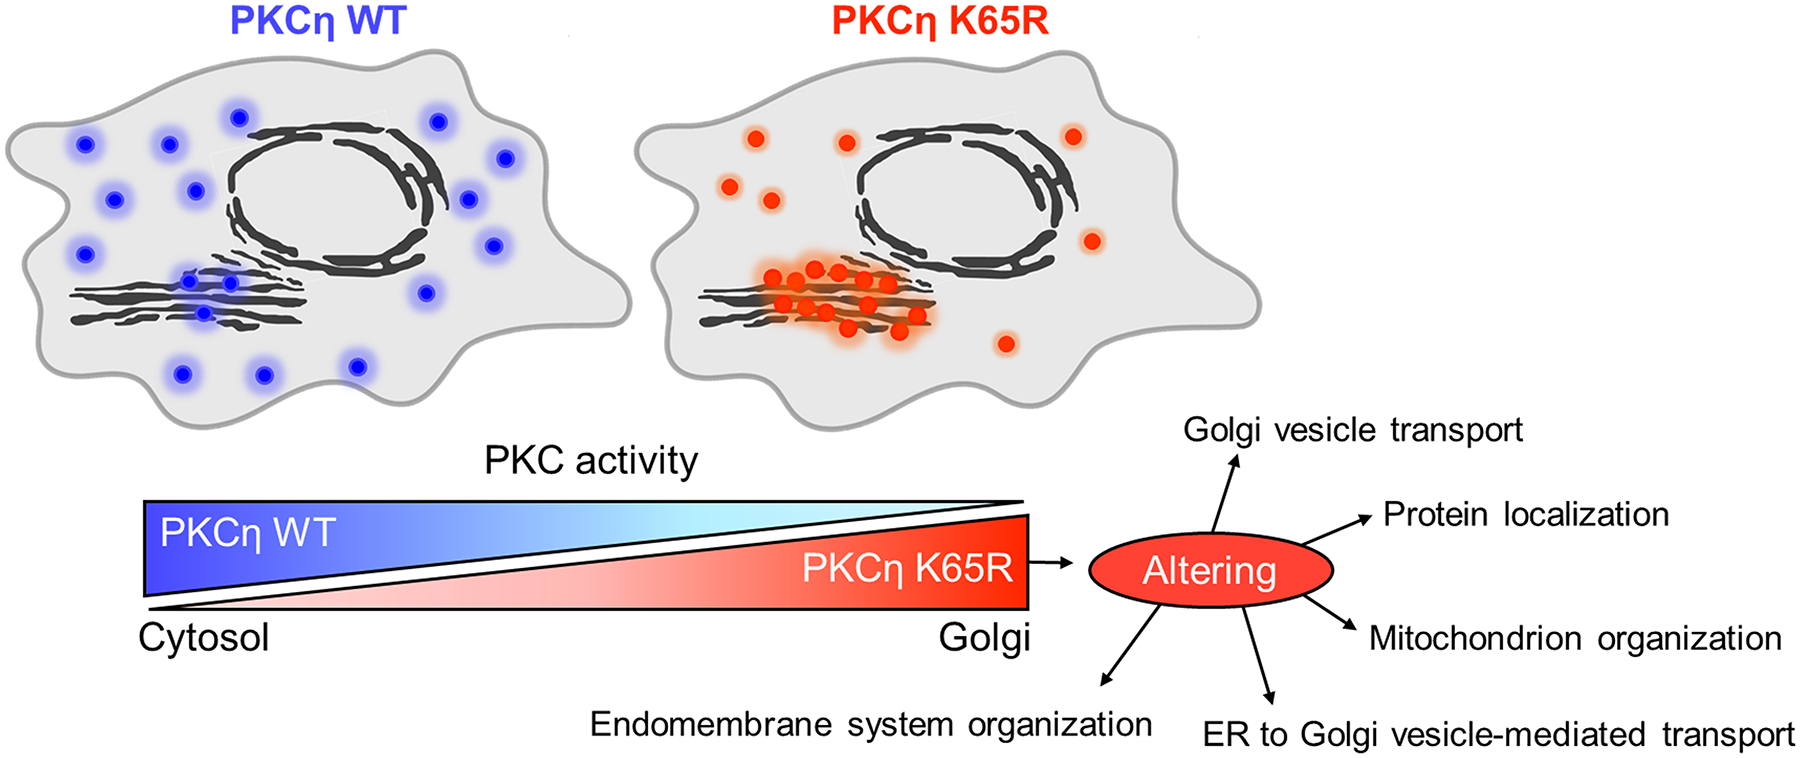
The identification of Alzheimer's disease (AD)-associated genomic variants has provided powerful insight into disease etiology. Genome-wide association studies (GWASs) of AD have successfully identified previously unidentified targets but have almost exclusively used additive genetic models. Here, we performed a family-based GWAS of a recessive inheritance model using whole-genome sequencing from families affected by AD. We found an association between AD risk and the variant rs7161410, which is located in an intron of the PRKCH gene encoding protein kinase C eta (PKCη). In addition, a rare PRKCH missense mutation, K65R, was in linkage disequilibrium with rs7161410 and was present in homozygous carriers of the rs7161410 risk allele. In vitro analysis revealed that the catalytic rate, lipid dependence, and peptide substrate binding of the purified variant were indistinguishable from those of the wild-type kinase. However, cellular studies revealed that the K65R PKCη variant had reduced cytosolic activity and, instead, enhanced localization and signaling at the Golgi. Moreover, the K65R variant had altered interaction networks in transfected cells, particularly with proteins involved in Golgi processes such as vesicle transport. In human brain tissue, the AD-associated recessive genotype of rs7161410 was associated with increased expression of PRKCH, particularly in the amygdala. This association of aberrant PKCη signaling with AD and the insight into how its function is altered may lead to previously unidentified therapeutic targets for prevention and treatment.


Conflict of interest statement

Competing interests: The authors declare that they have no competing interests. Furthermore, the funding body had no role in the design of the study and collection, analysis, and interpretation of data or in writing the manuscript.

Figures

Figure 1:
Figure 1:. Identification of PRKCH as an AD marker. (A to D)
GWAS on 2,247 subjects from 558 families according to AD affection status under recessive and additive models. (A) Quantile-Quantile plot of the recessive GWAS; (B) Manhattan plot of the recessive GWAS; (C) Manhattan plot of the additive GWAS; (D) Regional plot of the recessive significant variant, rs7161410 on PRKCH. Protein kinase C family members were highlighted in each Manhattan plot.
Figure 2:
Figure 2:. PKCη AD-associated variants.
(A) Single nucleotide variants in linkage disequilibrium (LD, D’>0.9) with rs7161410 with a moderate or high functional impact. (B) Primary structure of PKCη showing domain composition and position of AD-associated variants; novel C2 domain (yellow), autoinhibitory pseudosubstrate (red), C1A domain (tan), diacylglycerol-sensing C1B domain (orange), kinase domain (cyan), and C-terminal tail (grey). Processing phosphorylation sites at the activation loop (Thr513), turn motif (Thr656) and hydrophobic motif (Ser675) are indicated. (C) Model for autoinhibited conformation of the novel PKCη isozyme showing position of AD variants; residues are all surface exposed.
Figure 3:
Figure 3:. AD-associated PKCη mutations have reduced activity in the cytosol.
(A) Normalized FRET ratios representing PKC activity in COS7 cells co-expressing the indicated mCherry-tagged PKCη (WT, blue trace; A19V, cyan trace; K65R, red trace; R149Q, green trace; V374I, pink trace; A410S, yellow trace), or mCherry empty vector (Endogenous PKCs, grey trace) and the PKC activity reporter, cytosolic CKAR2. After establishing a baseline for 3 minutes, cells were treated with 1 μM PKC inhibitor Gö6983, indicated by the black arrow. Data are representative of 30–53 cells per condition, from three independent experiments. (B) Relative basal activity quantified using the traces in (A) by subtraction of the average of the last 2.5 min minus the average of the baseline registered pre-inhibitor treatment. Data are the mean ± SEM of three independent experiments; ***p ≤ 0.0001, **p ≤ 0.001, *p ≤ 0.05 by one-way ANOVA. (C) Normalized FRET ratios of PKC activity in COS7 cells co-expressing the indicated mCherry-tagged PKCη, or mCherry empty vector and CKAR2. After establishing a baseline for 3 minutes, PKCs were activated with 100 μM uridine 5′-triphosphate (UTP), after plateau cells were treated with 1μM Gö6983. Data are representative of 38–52 cells per condition, from four independent experiments. (D) Relative PKC activity, quantified as area under the curve (AUC) from 3 min to 11 min as a measure of signaling output. Data are the mean ± SEM of four independent experiments; ***p ≤ 0.0001, **p ≤ 0.001, *p ≤ 0.05 by one-way ANOVA.
Figure 4:
Figure 4:. PKCη K65R has enhanced activity at Golgi.
(A) Normalized FRET ratios representing PKC activity in COS7 cells co-expressing the indicated mCherry-tagged PKCη, or mCherry empty vector (endogenous PKCs, grey trace) and the CKAR targeted to Golgi. After 3 minutes, cells were treated with 1 μM Gö6983 to study PKC basal activity in the organelle. Data are representative of 26–30 cells per condition, from three independent experiments. (B) Relative basal activity quantified using the traces obtained in (A) by subtraction of the average of the last 2.5 minutes from the average of the baseline registered pre-treatment. Data are the mean ± SEM of three independent experiments; *p ≤ 0.05 by one-way ANOVA. (C) Normalized FRET ratios of PKC activity in COS7 cells co-expressing the indicated mCherry-tagged PKCη, or mCherry empty vector and the Golgi-CKAR. After 3 minutes, PKCs were activated with 100 μM UTP, and subsequently inhibited with 1μM Gö6983. Data are representative of 40–62 cells per condition, from four independent experiments. (D) Relative PKC activity, quantified as area under the curve (AUC) from 3 min to 11 min as a measure of signaling output. Data are the mean ± SEM of four independent experiments; **p ≤ 0.001, *p ≤ 0.05 by one-way ANOVA.
Figure 5:
Figure 5:. K65R mutation does not alter the intrinsic catalytic properties of PKCη.
(A) Left: Coomassie Blue-stained SDS/PAGE gel of purified GST-PKCη wild-type and GST-PKCη K65R. Right: Western blot of pure proteins probed with specific antibodies for total PKCη, or the constitutive phosphorylation sites: the activation loop Thr513 (pT513), the turn motif Thr656 (pT656) and the hydrophobic motif Ser675 (pS675). (B) The activity of PKCη WT (blue) or K65R (red) (typically 2.4 nM) was measured as a function of mol% diacylglycerol (DG) or phosphatidylserine (PS), or concentration of peptide substrate, as described in Methods. Data are graphed in units (nmol phosphate per minute) per mg GST-PKC. Data represent the mean ± SD of triplicate samples. Curves represent best nonlinear least squares fit as described in the Methods.
Figure 6:
Figure 6:. Increased Golgi localization of PKCη K65R compared with WT protein.
(A) Representative images from confocal microscopy of unstimulated COS7 cells expressing Golgi-mEGFP (green) together with mCherry-PKCη WT or the indicated AD-variant (red). Scale bar is 10 μm. Images are representative of three independent experiments. (B) Bar graph indicating the M2 Mander’s colocalization coefficients for each mutant or WT PKCη and Golgi marker. Data are the mean ± SEM of three independent experiments; **p = 0.002 by one-way ANOVA.
Figure 7:
Figure 7:. PKCη K65R migrates more to the Golgi after UTP treatment.
Traces indicate PKCη translocation to Golgi in COS7 cells co-transfected with Golgi-CFP and the indicated YFP-PKCη. Translocation was monitored by measuring FRET/CFP ratio changes after stimulation with 100 μM UTP. Data for each cell were normalized to the average of the FRET before UTP addition and represent 27 to 55 cells per condition. Data are the mean ± SEM of three independent experiments.
Figure 8:
Figure 8:. Identification of PKCη WT and K65R protein interactors with miniTurboID.
(A to D) Gene ontology (GO) enrichment analysis identified (A) the top 10 most significant ontologies and (B) 15 significant Golgi-related processes from GO Biological Process (p ≤ 0.05), and (C) the top 10 most significant ontologies and (D) 10 significant brain-related phenotypes from MGI Mammalian Phenotypes (p ≤ 0.05) for protein interactors altered between PKCη WT and K65R (BFDR ≤ 0.01). (E) Dot plot displays all protein interactors that have opposite changes in abundance with UTP compared to vehicle treatment between PKCη WT and K65R (different directionality is designated by grey shading). Colormap indicates abundance (average spectral count; spec), dot size indicates relative abundance, and outline color indicates BFDR ≤ 0.01.
Figure 9:
Figure 9:. Effects of K65R mutation compared to PKCη WT in subcellular localization, kinase activity and cellular processes.
A rare mutation in PKCη, K65R, (linked to a recessively inherited intronic variant of PRKCH in family-based cohorts of AD) shifts the kinase’s activity to the Golgi and increases its interactions with Golgi-associated proteins, thereby potentially altering Golgi-associated functions.

Similar articles

References

    1. Livingston G et al. Dementia prevention, intervention, and care: 2020 report of the Lancet Commission. Lancet (London, England) 396, 413–446 (2020). - PMC - PubMed
    1. Wingo TS, Lah JJ, Levey AI & Cutler DJ Autosomal recessive causes likely in early-onset Alzheimer disease. Arch. Neurol 69, 59–64 (2012). - PMC - PubMed
    1. Freudenberg-Hua Y, Li W & Davies P The Role of Genetics in Advancing Precision Medicine for Alzheimer’s Disease-A Narrative Review. Front. Med 5, (2018). - PMC - PubMed
    1. Jansen IE et al. Genome-wide meta-analysis identifies new loci and functional pathways influencing Alzheimer’s disease risk. Nat. Genet 51, 404–413 (2019). - PMC - PubMed
    1. Kunkle BW et al. Genetic meta-analysis of diagnosed Alzheimer’s disease identifies new risk loci and implicates Aβ, tau, immunity and lipid processing. Nat. Genet 51, 414–430 (2019). - PMC - PubMed

LinkOut - more resources