Citrobacter rodentium infection activates colonic lamina propria group 2 innate lymphoid cells
- PMID: 40591723
- PMCID: PMC12237274
- DOI: 10.1371/journal.ppat.1013276
Citrobacter rodentium infection activates colonic lamina propria group 2 innate lymphoid cells
Abstract
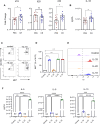
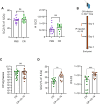
Group 3 innate lymphoid cells (ILC3s) play a major role in protecting against infection with the enteric mouse pathogen Citrobacter rodentium (CR) used to model infections with enteropathogenic and enterohaemorrhagic Escherichia coli. ILC3s-secreted IL-22 induces secretion of IL-18, antimicrobial peptides and nutritional immunity proteins as well as activation of tissue regeneration processes. While ILC2s have traditionally been associated with immune responses to helminth infection and allergic inflammation via the production of type 2 cytokines (e.g. IL-4, IL-5, IL-9 and IL-13), more recently they have been implicated in protection against Clostridium difficile and Helicobacter pylori infections. Here we show that colonic lamina propria ILC2s expand in response to CR infection and secrete IL-4, IL-5 and IL- 13, which are involved in maintenance of the intestinal barrier function, tissue repair and mucus secretion. When stimulated with IL-18, and IL-33 as a control, colonic ILC2s from uninfected mice secreted type 2 cytokines. Injection of IL-18 binding protein (IL18 BP), at 2- and 3-days post CR infection, blocked expansion of ILC2s in vivo. While ILC2s do not expand in CR-infected Il22-/- mice, injection of IL-18 into Il22-/- mice at 2- and 3-days post CR infection triggered ILC2s expansion. Importantly, injection of anti-IL-13, at 2- and 4-days post CR infection, diminished local secretion of IL-10 and IL-22. These data show that ILC2s are activated in response to infection with an enteric Gram-negative pathogen. Moreover, stimulation with IL-18 plays a role in ILC2s expansion and secretion of type 2 cytokines, which may participate in shaping the local immunological landscape.
Copyright: © 2025 Berkachy et al. This is an open access article distributed under the terms of the Creative Commons Attribution License, which permits unrestricted use, distribution, and reproduction in any medium, provided the original author and source are credited.
Conflict of interest statement
The authors have declared that no competing interests exist.
Figures


Similar articles
-
LKB1 regulates ILC3 postnatal development and effector function through metabolic programming.Front Immunol. 2025 Jun 5;16:1587256. doi: 10.3389/fimmu.2025.1587256. eCollection 2025. Front Immunol. 2025. PMID: 40539052 Free PMC article.
-
Context-dependent role of group 3 innate lymphoid cells in mucosal protection.Sci Immunol. 2024 Aug 16;9(98):eade7530. doi: 10.1126/sciimmunol.ade7530. Epub 2024 Aug 16. Sci Immunol. 2024. PMID: 39151019 Free PMC article.
-
The accessory type III secretion system effectors collectively shape intestinal inflammatory infection outcomes.Gut Microbes. 2025 Dec;17(1):2526134. doi: 10.1080/19490976.2025.2526134. Epub 2025 Jul 2. Gut Microbes. 2025. PMID: 40599135 Free PMC article.
-
The Black Book of Psychotropic Dosing and Monitoring.Psychopharmacol Bull. 2024 Jul 8;54(3):8-59. Psychopharmacol Bull. 2024. PMID: 38993656 Free PMC article. Review.
-
Behavioral interventions to reduce risk for sexual transmission of HIV among men who have sex with men.Cochrane Database Syst Rev. 2008 Jul 16;(3):CD001230. doi: 10.1002/14651858.CD001230.pub2. Cochrane Database Syst Rev. 2008. PMID: 18646068
References
-
- Barthold SW, Coleman GL, Bhatt PN, Osbaldiston GW, Jonas AM. The etiology of transmissible murine colonic hyperplasia. Lab Anim Sci. 1976;26(6 Pt 1):889–94. - PubMed
-
- Luperchio SA, Newman JV, Dangler CA, Schrenzel MD, Brenner DJ, Steigerwalt AG, et al. Citrobacter rodentium, the causative agent of transmissible murine colonic hyperplasia, exhibits clonality: synonymy of C. rodentium and mouse-pathogenic Escherichia coli. J Clin Microbiol. 2000;38(12):4343–50. doi: 10.1128/JCM.38.12.4343-4350.2000 - DOI - PMC - PubMed
-
- Jordan S, Frankel G, Mishra V. Citrobacter rodentium. Trends Microbiol. 2025. - PubMed
MeSH terms
Substances
Grants and funding
LinkOut - more resources
Full Text Sources
Miscellaneous

