. 2025 Jul 15;6(7):102206.
doi: 10.1016/j.xcrm.2025.102206. Epub 2025 Jun 30.

Comprehensive genetic profiling of sensorineural hearing loss using an integrative diagnostic approach

Affiliations

Comprehensive genetic profiling of sensorineural hearing loss using an integrative diagnostic approach

Sang-Yeon Lee et al. Cell Rep Med. .

Abstract

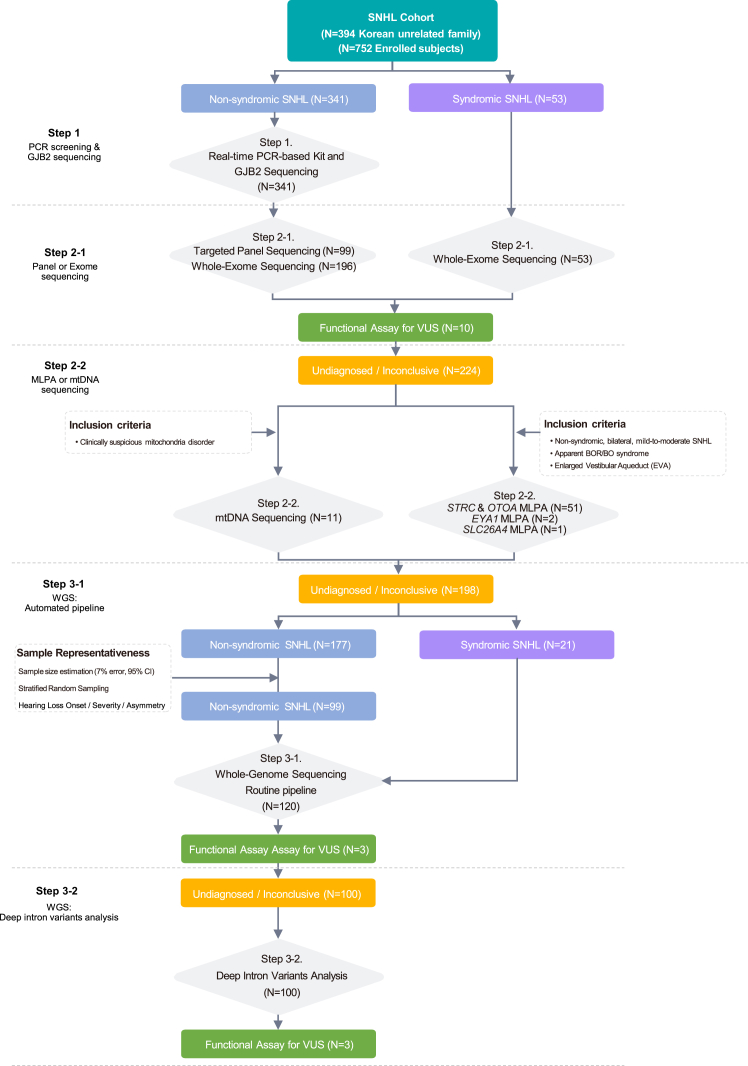
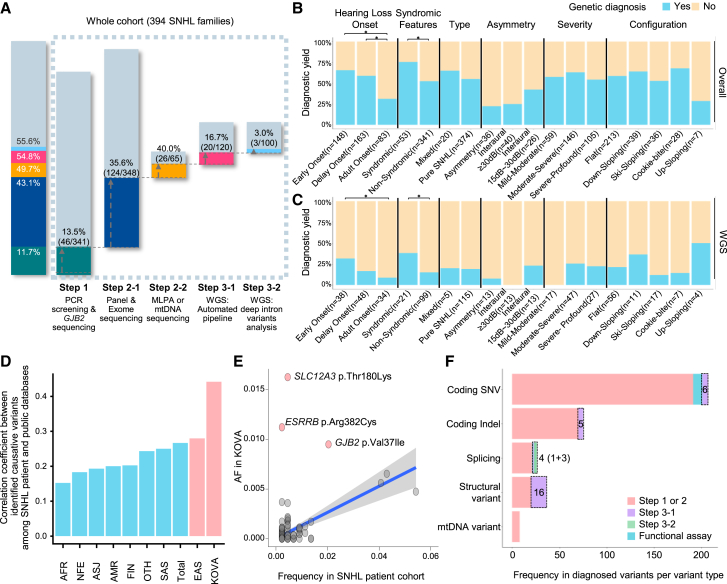
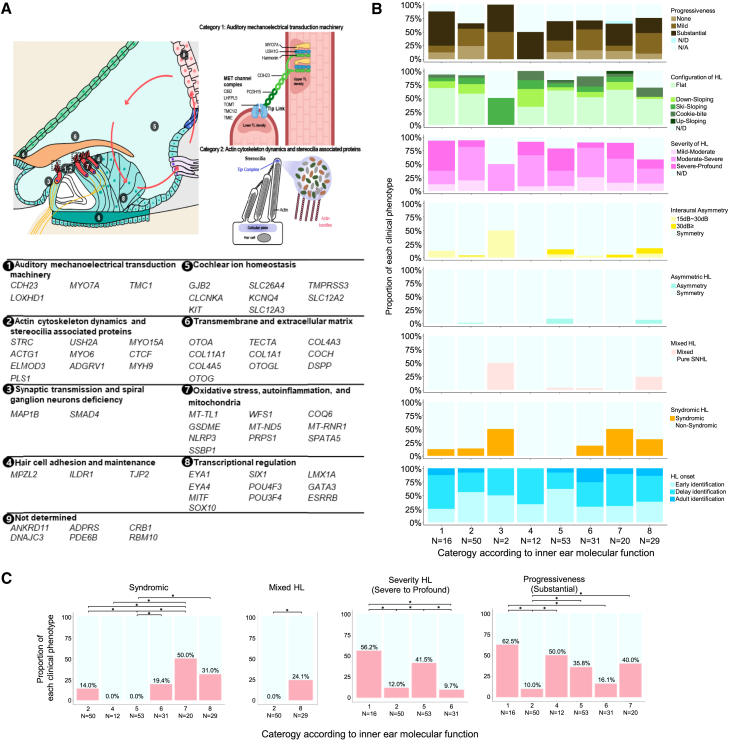
Despite the advent of next-generation sequencing, diagnosing genetic disorders remains challenging. We perform comprehensive genomic profiling of 394 families (752 individuals) with sensorineural hearing loss (SNHL) using a systematic multi-tiered approach, from single-gene analysis to whole-genome sequencing (WGS), complemented by functional assays and bioinformatic analysis. Our strategy achieves a cumulative diagnostic yield of 55.6% (219 families), with automated WGS analysis identifying pathogenic variants in an additional 20 families, primarily structural variants. Comparative analysis reveals higher frequencies of single pathogenic alleles in recessive genes within our cohort compared to controls. Subsequent analysis, including in silico predictions and in vitro validation, identifies three deep intronic pathogenic variants on opposite alleles. These findings demonstrate the value of comprehensive genomic analysis in resolving undiagnosed cases. Finally, we map the genome-phenome landscape of SNHL at the level of inner ear function. Our results highlight WGS as a transformative tool for precision medicine in genetic diseases.

Keywords: genotype-phenotype correlations; molecular diagnostics; precision medicine; rare genetic disorder; sensorineural hearing loss; stepwise genomic approach; whole-genome sequencing.


Conflict of interest statement

Declaration of interests Y.S.J. is the founder of Inocras, Inc., a genome analysis and interpretation company. Y.S.J., J.-Y.K., S.P., and Sangmoon Lee hold stocks or stock options in Inocras, Inc.

Figures

None
Graphical abstract
Figure 1
Figure 1
Study design and diagnostic pipeline Flow diagram illustrating a prospective, step-by-step genetic approach of 394 unrelated SNHL families and 752 individuals, including probands, in our cohort study.
Figure 2
Figure 2
Stepwise genetic diagnosis outcomes in patients with SNHL (A) Diagnostic yield of each genetic test for the whole SNHL cohort. Bar graph showing the cumulative diagnostic rate according to genetic diagnosis steps. (B and C) Diagnostic yield based on SNHL phenotypes and comparative analysis within the whole SNHL cohort (n = 394 families) (B) and within the WGS cases (n = 120 families) (C). Statistical significance for hearing loss onset and syndromic features was determined using one-way ANOVA with Bonferroni’s multiple comparisons tests and the t test, respectively. Significance levels are indicated as ∗p < 0.05. (D) Pearson’s correlation coefficient values for causative variants between the allele frequencies (AFs) in our cohort and those from other populations. (E) Dot plot shows the AF correlation between our cohort and KOVA. There are three variants (pink dots) showing higher AFs in KOVA. A fitted line of linear regression model (blue line) and 95% confidence intervals (gray area) are displayed. (F) Distribution of variant subtypes identified at each diagnostic step. WGS, whole-genome sequencing; MLPA, multiplex ligation-dependent probe amplification; mtDNA, mitochondrial DNA; SNHL, sensorineural hearing loss; AFR, African American; NFE, non-Finnish European; ASJ, Ashkenazi Jewish; AMR, admixed Americans or Latino; FIN, Finnish European; OTH, other ethnic origin; SAS, South Asian; EAS, East Asian; SNV, single-nucleotide variant; indel, insertion/deletion.
Figure 3
Figure 3
Genomic landscape of the SNHL cohort (A) Bar plot showing the frequencies and inheritance patterns of 63 SNHL-associated genes from 219 genetically diagnosed families. Pie chart showing the percentages of inheritance patterns. (B) Bar plot showing the mutational landscape of the total 352 likely pathogenic or pathogenic variants among the 63 SNHL genes. Pie chart showing the percentages of variant types. (C) Proportion of novel variants among identified causal variants. (D) Structural variants (SVs) were more common among novel variants compared to previously reported variants. (E) Novel variants were frequently identified through WGS (step 3-1) and SpliceAI-based deep intronic variant analysis (step 3-2). (F and G) Schematic illustrations showing the pathogenic variant that deletes exons in SPATA5 and CLCNKA in the probands (top, respectively). The genomic regions corresponding to each variant are visualized using the Integrative Genomics Viewer (bottom) for each figure. The detailed reconstruction of the CLCNKA deletion, including nearby copy-number variations, is illustrated in Figure S10. SNHL, sensorineural hearing loss; SNV, single-nucleotide variant; indel, insertion/deletion; SV, structural variation.
Figure 4
Figure 4
Analysis of carrier and deep intronic variants in undiagnosed patients with SNHL (A) Schematic diagram illustrating carrier status identification and screening for pathogenic deep intronic variants. (B) Bar plot showing the proportion of genetic carriers for SNHL-related genes across each cohort. (C) Cumulative distribution plot showing the MAF of candidate pathogenic variants across cohorts. (D) Schematic illustration of the location of each identified pathogenic variant within USH2A in each patient. (E) Schematic diagram of the pSPL3 vector with USH2A c.7120+1475A>G (left), c.14134-3169A>G (middle), and c.4628-26037A>G (right). (F) Electrophoresis gel image showing the bands corresponding to the pSPL3 empty vector (263 bp), each variant, and wild type. Representative results from at least three independent transfections and RT-PCR experiments are shown. (G) Schematic representation of the splice products with the wild-type splicing profile and the splice variant profiles for each mutant type. SNHL, sensory neural hearing loss; WGS, whole-genome sequencing; AR, autosomal recessive; MOI, mode of inheritance; P, pathogenic; LP, likely pathogenic; MAF, minor-allele frequency; SV, structural variation; TE, transposable element; SD, splicing donor; SA, splicing acceptor; PE, pseudoexon.
Figure 5
Figure 5
Functional classification and clinical relevance of SNHL-related genes (A) Schematic illustration of nine functional categories based on molecular mechanisms underlying inner ear function (top), along with a list of 63 genes identified in this study grouped into these categories (bottom). The dashed box in the stereocilia is zoomed to highlight category 1 and category 2. (B) Comparison of clinical phenotypic features across eight inner ear functional categories (excluding category 9: not determined). Cases with only one audiogram or a follow-up duration of less than 1 year were classified as “not available” (N/A) for hearing loss progression. Profound SNHL with thresholds ≥ 90 dB at 500 Hz on the initial audiogram was classified as “not determined” (N/D) for hearing loss progression. In cases with bilateral ear discrepancies in progressiveness, the overall category was defined as “substantial” if at least one ear showed substantial progression (e.g., substantial/mild, substantial/none, and substantial/N/D). If no ear was classified as substantial but at least one ear was classified as mild (e.g., mild/none and mild/N/D), the overall category was defined as “mild.” Furthermore, patients with mixed or asymmetric hearing loss were classified as N/D when analyzing severity and configuration of hearing loss. (C) Significant associations between clinical phenotypes and the eight functional categories; red bars indicate the proportion of affected probands within each category (refer to details in Table S10). Asterisks (∗) denote statistical significance (p < 0.05).

References

    1. Lieu J.E.C., Kenna M., Anne S., Davidson L. Hearing Loss in Children: A Review. JAMA. 2020;324:2195–2205. doi: 10.1001/jama.2020.17647. - DOI - PubMed
    1. Bowl M.R., Simon M.M., Ingham N.J., Greenaway S., Santos L., Cater H., Taylor S., Mason J., Kurbatova N., Pearson S., et al. A large scale hearing loss screen reveals an extensive unexplored genetic landscape for auditory dysfunction. Nat. Commun. 2017;8:886. - PMC - PubMed
    1. Pinero J., Ramirez-Anguita J.M., Sauch-Pitarch J., Ronzano F., Centeno E., Sanz F., Furlong L.I. The DisGeNET knowledge platform for disease genomics: 2019 update. Nucleic Acids Res. 2020;48:D845–D855. doi: 10.1093/nar/gkz1021. - DOI - PMC - PubMed
    1. Martin A.R., Williams E., Foulger R.E., Leigh S., Daugherty L.C., Niblock O., Leong I.U.S., Smith K.R., Gerasimenko O., Haraldsdottir E., et al. PanelApp crowdsources expert knowledge to establish consensus diagnostic gene panels. Nat. Genet. 2019;51:1560–1565. doi: 10.1038/s41588-019-0528-2. - DOI - PubMed
    1. Adams D.R., Eng C.M. Next-Generation Sequencing to Diagnose Suspected Genetic Disorders. N. Engl. J. Med. 2018;379:1353–1362. doi: 10.1056/NEJMra1711801. - DOI - PubMed

LinkOut - more resources