. 2025 Jul 1;11(1):288.
doi: 10.1038/s41420-025-02582-x.

Mutant p53 induces SH3BGRL expression to promote cell engulfment

Affiliations

Mutant p53 induces SH3BGRL expression to promote cell engulfment

Lobsang Dolma et al. Cell Death Discov. .

Abstract

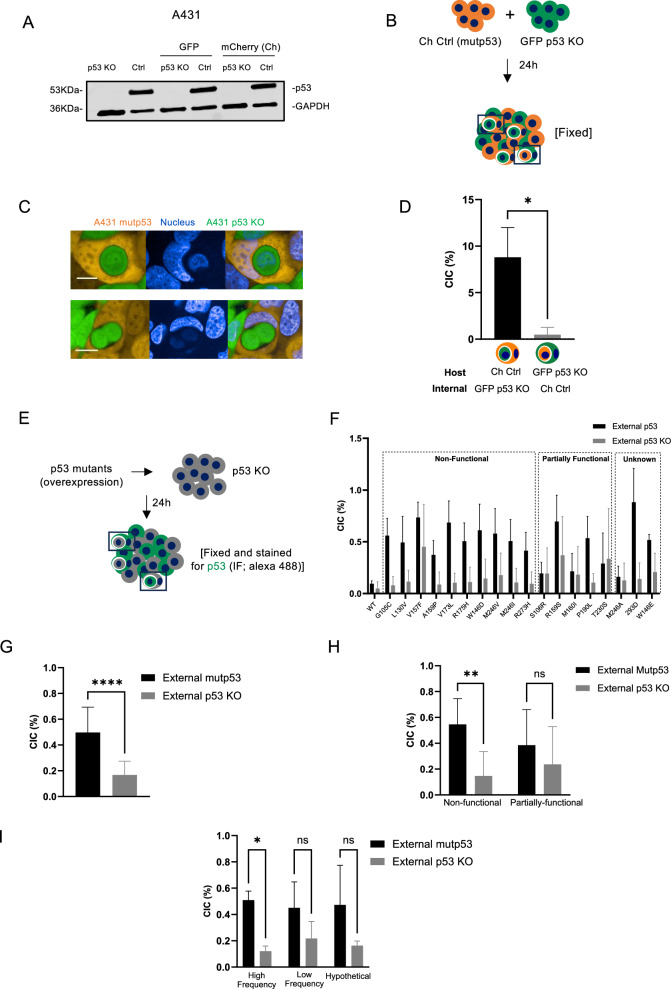
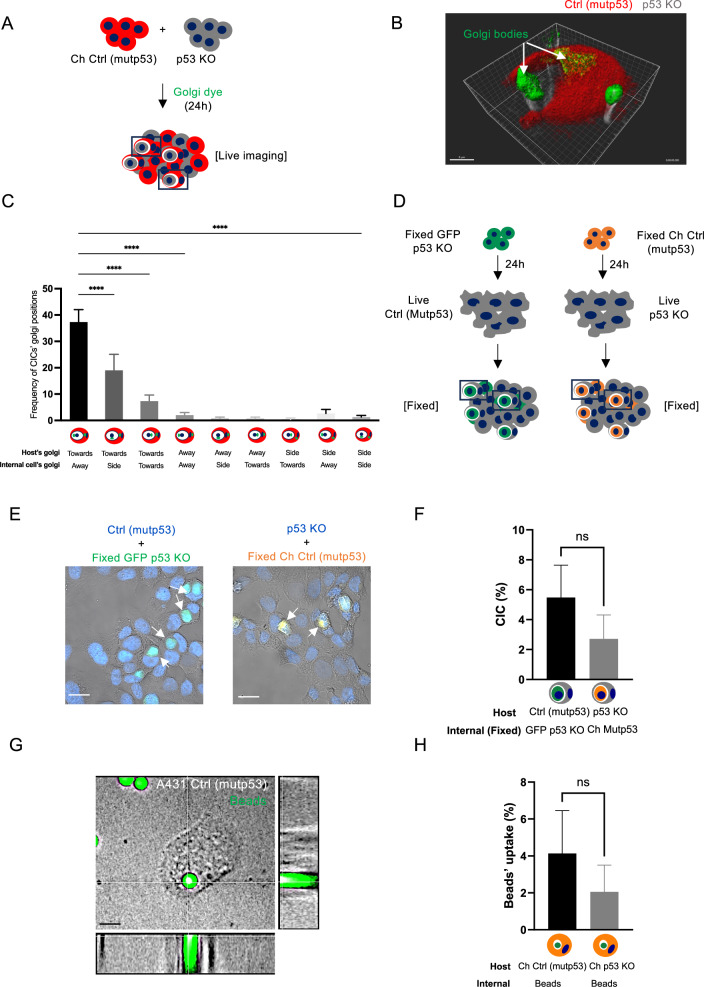
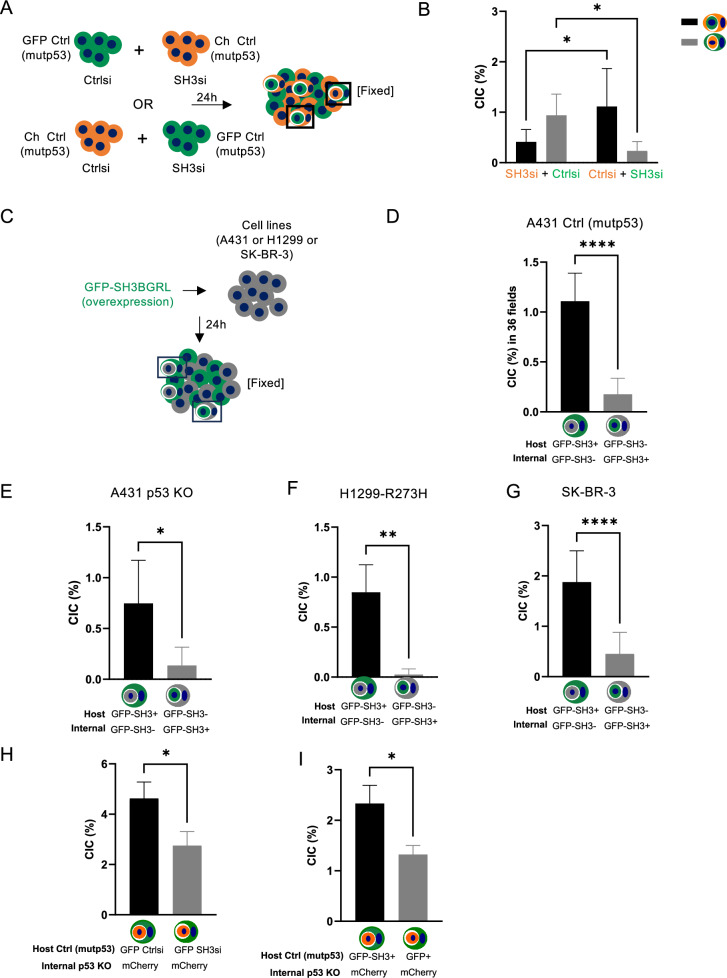
Previously, we identified that mutant p53 expression in cancer cells promotes engulfment of neighbouring cancer cells to form cell-in-cell (CIC) structures. This process gave mutant p53 cells an advantage in tumour formation in mouse xenograft experiments. TP53 can be found mutated at nearly every amino acid in cancers and mutant p53 expression is associated with various GOF (Gain-of-function) processes, including cancer cell invasion, metastasis, stemness and drug resistance. In the current manuscript, we identified SH3BGRL (Src homology 3 binding glutamate rich protein like) as a mutant p53-regulated gene and investigated to what extent SH3BGRL expression and cell engulfment are responsible for mutant p53-dependent anchorage-independent growth and chemoresistance. We demonstrate that mutant p53 expression drives cell engulfment in which the mutant p53 host cell moves in the direction of the target internal cell to form CIC structures. This is therefore more reminiscent of cell engulfment rather than cell entosis, in which cells invade into host cells. Using NGS (Next Generation Sequencing), we identified novel target genes of mutant p53 and demonstrate that cell engulfment requires SH3BGRL expression. We generated mutant p53 and p53 KO cell lines that stably overexpressed SH3BGRL and determined that SH3BGRL promotes etoposide resistance in mutant p53 cells and anchorage-independent growth independent of mutant p53 expression. Through FACS sorting of pure cell engulfing (CIC) populations, we could also show that engulfing cells have an enhanced etoposide resistance. These data suggest that SH3BGRL and cell engulfment are required for certain GOFs of mutant p53.


Conflict of interest statement

Competing interests: The authors declare no competing interests. Ethics approval: All animal experiments were approved by the AWERB (application number: BIOL-2022-04-21T09_50_20-pkkp47) of Durham University and under project licence number: PP8383164. Animal experiments are reported under ARIVE guidelines. For patient studies, ethics approval was not required as only publicly available database were used including the p53 database: https://tp53.cancer.gov/about and several patient datasets accessible via Xenabrowser: https://xenabrowser.net .

Figures

Fig. 1
Fig. 1. Mutant p53 often forms the outer cell in CIC structures.
A p53 (DO-1) protein expression in A431 Ctrl (mutp53) or A431 CRISPR p53 KO cell lines. Some cell lines had a stable expression of mCherry or GFP. GAPDH was used as the loading control. B Schematic of experimental setup for C, D. C A431 mCherry Ctrl (mutp53) cells (orange) were co-cultured with GFP p53 KO cells (green) and CIC structures imaged using confocal microscopy (Opera Phenix). Blue staining is Hoechst. Scale bars indicate 20 μm. D Scoring of CIC structures with host cells as mCherry or GFP positive in 144 fields (n = 3, student’s t-test, *p ≤ 0.05, Error bars=SD). E Schematic of experimental setup of co-cultures in (FI). F Non-fluorescent A431 p53 KO cells were transfected with various p53 mutants or WTp53. Cells were fixed and stained for p53 using immunofluorescence. CIC structures containing p53 positive cells were scored and displayed as cells that had p53 in the host cell (external p53) or inner cell (external p53 KO) (n = 3, Error bars = SD). p53 mutants were grouped as non-functional, unknown, or partially functional mutants. G Using all the p53 mutants shown in F, overall frequency of CIC structures with external mutp53 positive cells carrying internal p53 KO cells or external p53 KO cells carrying internal mutp53 positive cells were quantified (n = 3, one-way ANOVA, ****p ≤ 0.0001, Error bars = SD). H Non-functional mutants and partially functional mutants of F were grouped and total numbers of CIC structures in the two groups compared (n = 3, student’s t-test, **p ≤ 0.01, Error bars = SD). I Mutants of F were grouped based on mutational frequency and total numbers of CIC structures in the two groups compared (n = 3, two-way ANOVA, *p ≤ 0.05, Error bars = SD).
Fig. 2
Fig. 2. Mutant p53 status drives cell engulfment.
A Schematic of the experimental set up for B. B A431 mCherry Ctrl (mutp53) cells (red) were co-cultured with non-fluorescent p53 KO cells (grey), exposed to live Golgi-tracker dye (green) and live time-series imaging was done. A z-stack (46.08 μm in 193 planes) of the live cells was taken on the Andor spinning disk microscope (scale bar = 8 μm) and 3D image generated using Imaris image analysis software (version 9.2) (Oxford instruments). C A431 mCherry Ctrl (mutp53) cells were co-cultured with non-fluorescent p53 KO cells and fixed for immunofluorescence. The Golgi apparatus was stained with GM130, and CIC structures quantified based on the orientation of the host and internal cell Golgi as indicated at the bottom of the graph (n = 3, one-way ANOVA, ****p ≤ 0.0001, Error bars = SD). D Schematic of the experimental setup for (E). Non fluorescent A431 Ctrl (mutp53) cells and p53 KO cells were cultured in the presence of fixed GFP p53 KO or mCherry Ctrl (mutp53) cells, respectively. E Example images of CIC structures indicated by arrows (Zeiss LSM800 microscope, scale bar = 30 μm). F Quantification of A431 Ctrl (mutp53) and p53 KO cell ability to engulf fixed GFP p53 KO or mCherry Ctrl (mutp53) cells, respectively (n = 3, student’s t-test, Error bars=SD). A431 mCherry Ctrl (mutp53) or mCherry p53 KO cells were cultured in the presence of green, fluorescent beads. G Bead (5μm) uptake was imaged using confocal microscopy (Spinning disk). Blue staining is Hoechst and scale bars represent 30 μm. H Bead uptake was also measured using flow cytometry (n = 3, student’s t-test, Error bars = SD).
Fig. 3
Fig. 3. SH3BGRL expression is driven by mutant p53.
A Differential gene expression in A431 p53 KO cells was determined using NGS using parental (mutp53) and A431 Ctrl (mutp53) cells as controls. Indicated are the number of genes identified as differentially expressed (1.5 log2 fold) with the parental A431 cells. B Genes that are up or downregulated by more than 1.5 log2 fold change in A431 p53 KO cells compared to both A431 parental (mutp53) and Ctrl (mutp53) cells are depicted in red (upregulated) or blue (downregulated) in the Volcano plot. C Gene expression of potential CIC-relevant up (top) or downregulated (bottom) genes was validated through qRT PCR in independent lysates of A431 Ctrl (mutp53) and p53 KO cells (n = 3, two-way ANOVA, **p ≤ 0.01, *p ≤ 0.05, Error bars=SD). D A431 parental (mutp53) cells were transfected with p53 siRNA and TP53 (left) and SH3BGRL (right) gene expression measured using qRT PCR (n = 3, student’s t-test, **p ≤ 0.01, ****p ≤ 0.0001, Error bars=SD). E H1299 (p53 null) cells were transfected with a control (Pcb6) or mutant p53 (R273H) and examined for SH3BGRL mRNA expression using qRT PCR (n = 3, one-way ANOVA,*p ≤ 0.05, **p ≤ 0.01, Error bars = SD). F SK-BR-3 cells which endogenously express mutant p53 (R175H) were transfected with p53 siRNA or Ctrl siRNA and TP53 (left) and SH3BGRL (right) gene expression measured using qRT PCR (n = 3, student’s t-test, **p ≤ 0.01, ***p ≤ 0.001, Error bars=SD). G H1299 parental cells were transfected with a control or p63 siRNA and examined for SH3BGRL (right) or TAp63 (left) mRNA expression using qRT PCR (n = 3, student’s t-test, ****p ≤ 0.0001, Error bars = SD).
Fig. 4
Fig. 4. SH3BGRL is found expressed in outer cells in CIC structures.
A Schematic of co-cultures used in B. B A431 mCherry Ctrl (mutp53) (orange) or GFP Ctrl (mutp53) (green) cells were transfected with SH3BGRL siRNA or Ctrl siRNA as depicted in A and CIC structures examined through confocal microscopy (Zeiss LSM800). CIC structures with host GFP-labelled cells carrying mCherry-labelled cells or host mCherry-labelled cells taking up GFP-labelled cells were scored and depicted (n = 3, two-way ANOVA, *p ≤ 0.05, Error bars = SD). C Schematic of non-fluorescent cell co-cultures transfected with GFP-SH3BGRL used in (DG). A431 Ctrl (mutp53) cells (D), A431 p53 KO cells (E), H1299 cells with stable expression of mutant p53 (R273H) (F) and SK-BR-3 cells (G) were transfected with GFP-tagged SH3BGRL after which CIC structures consisting of host or internal GFP positive cells were scored (n = 3, student’s t-test, *p ≤ 0.05, **p ≤ 0.01, ****p ≤ 0.0001, Error bars = SD). H A431 GFP Ctrl (mutp53) cells were transfected with Ctrl siRNA or SH3BGRL siRNA and subsequently co-cultured with mCherry p53 KO cells. CIC structures with host GFP Ctrl (mutp53) cells carrying internal mCherry p53 KO cells were scored after 24 h (n = 3, student’s t-test, *p ≤ 0.05, Error bars=SEM). I A431 non-fluorescent Ctrl (mutp53) cells were overexpressed with GFP or GFP-SH3BGRL and co-cultured with mCherry p53 KO cells for CIC quantification. CICs with host GFP or GFP-SH3BGRL Ctrl (mutp53) cells and internal mCherry p53 KO cells were quantified (n = 3, student’s t-test, *p ≤ 0.05, Error bars=SEM).
Fig. 5
Fig. 5. SH3BGRL and CIC structures independently of each other promote etoposide resistance in mutant p53 cells.
A A431 Ctrl (mutp53) or p53 KO cells stably expressing GFP-SH3BGRL or GFP were grown in resazurin survival assays and treated with increasing doses of etoposide. Cell survival (%) after 72 h was determined through non-linear regression model (inhibitor vs normalised response) and IC50 calculated (n = 3, two-way ANOVA, **p ≤ 0.01, ****p ≤ 0.0001, Error bars = SEM). B A431 Ctrl (mutp53)cells with or without SH3BGRL knockdown were either grown on their own or co-cultured with p53 KO cells in survival assays. Equal numbers of cells were used in each condition, meaning that a co-culture has half the number of mutant cells than the single mutant p53 condition. Cell survival (%) after 72 h was determined through non-linear regression model (inhibitor vs normalised response) and IC50 calculated (n = 3, two-way ANOVA, **p ≤ 0.01,***p ≤ 0.001, ****p ≤ 0.0001, Error bars=SEM). C Schematics of the co-cultures incorporated for FACs sorting of GFP+, mCherry+ and double positive CIC populations used in D–F. D IC50 of etoposide survival assays as measured in the sorted cell populations of C (n = 3, two-way ANOVA, *p ≤ 0.05, **p ≤0.01, Error bars = SEM). 1a, 2a, 3a and 4a represent FACS sorted Ctrl (mutp53) GFP-SH3, Ctrl (mutp53) GFP, p53 KO GFP-SH3 and p53 KO GFP, respectively. 1b indicates FACS sorted mcherry p53 KO cells. 1c,2c, 3c and 4c represent FACS sorted CIC populations from mutp53 (GFP-SH3 or GFP) + mCherry p53 KO or p53 KO (GFP-SH3 or GFP) +mCherry p53 KO co-cultures as indicated in (C). E Percentage of red (mCherry) and green (GFP) cells in each CIC population shown in (D). F IC50 of etoposide survival assays on FACS sorted CIC populations or co-cultures that were set up only prior to etoposide survival assays based on the ratio of red and green cells in (E) (n = 3, two-way ANOVA, **p ≤ 0.01, ***p ≤ 0.001, Error bars = SEM).
Fig. 6
Fig. 6. SH3BGRL and CIC structures independently of each other promote anchorage-independent growth.
A431 Ctrl (mutp53) or p53 KO cells stably expressing GFP-SH3BGRL or GFP were grown in anchorage independent growth assays, imaged (A) and quantified for numbers of colonies (B) (n = 3, two-way ANOVA, *p ≤ 0.05, **p ≤ 0.01, ***p ≤ 0.001, Error bars = SD). C A431 Ctrl (mutp53) cells with or without SH3BGRL knockdown were grown on their own or co-cultured with p53 KO cells in anchorage-independent growth assays and colony formation was measured after 14 days (n = 3, two-way ANOVA,**p ≤ 0.01, ***p ≤ 0.001, Error bars = SD). D FACS-sorted cell populations in Fig. 5C were also studied for their ability to grow in anchorage-independent growth assays. The number of colonies are quantified (n = 3, two-way ANOVA, *p ≤ 0.05, Error bars = SD). E Graphical representation of mutant p53’s function in regulating CIC formation and SH3BGRL expression. Mutant p53 promotes SH3BGRL expression that can assist mutant p53 mediated etoposide resistance and promote anchorage-independent growth. CIC formation is likely to contribute to etoposide resistance and possibly to anchorage-dependent growth, but likely in a SH3BGRL-independent manner.

Similar articles

References

    1. Harris SL, Levine AJ. The p53 pathway: positive and negative feedback loops. Oncogene. 2005;24:2899–908. 10.1038/sj.onc.1208615. - PubMed
    1. Kamagata K, Itoh Y, Subekti DRG. How p53 molecules solve the target DNA search problem: a review. Int J Mol Sci. 2020;21:1031. - PMC - PubMed
    1. Kandoth C, McLellan MD, Vandin F, Ye K, Niu B, Lu C, et al. Mutational landscape and significance across 12 major cancer types. Nature. 2013;502:333–9. 10.1038/nature12634. - PMC - PubMed
    1. Muller PA, Trinidad AG, Caswell PT, Norman JC, Vousden KH. Mutant p53 regulates Dicer through p63-dependent and -independent mechanisms to promote an invasive phenotype. J Biol Chem. 2014;289:122–32. 10.1074/jbc.M113.502138. - PMC - PubMed
    1. Muller PA, Vousden KH. p53 mutations in cancer. Nat Cell Biol. 2013;15:2–8. 10.1038/ncb2641. - PubMed

LinkOut - more resources